Research Article · Volume 14, Issue 10, 15 September 2026 · Open Access
Comparative Metabolic, Oxidative, and Pancreatic Responses in Hormone-Induced Rat Models of Polycystic Ovary Syndrome
· · · ·
Affiliations & Notes ⌄
1Department of Veterinary Reproduction, Faculty of Veterinary Medicine, Universitas Brawijaya, Malang, Indonesia
2Faculty of Veterinary Medicine, Universitas Brawijaya, Malang, Indonesia
3Tulungagung Pet Care, Tulungagung, East Java, Indonesia. *Correspondence | Yudit Oktanella, Department of Veterinary Reproduction, Faculty of Veterinary Medicine, Universitas Brawijaya, Malang, Indonesia
EV-induced rats showed the highest glucose level and a more necrosis-dominant pancreatic pattern, which is consistent with a descriptive association between glucose dysregulation and pancreatic cellular injury.
TP and EV induction produced distinct metabolic, oxidative, and pancreatic injury profiles in female Wistar rats.
EV caused the highest blood glucose level and was associated with a descriptively necrosis-dominant pancreatic pattern, whereas TP caused the highest serum MDA/TBARS level and was associated with a descriptively inflammation-dominant pancreatic pattern.
These findings support the heterogeneous extra-ovarian character of PCOS models and indicate that combined assessment of glucose, MDA/TBARS, and pancreatic histopathology can help descriptively differentiate hyperglycaemia-related and oxidative-inflammatory pancreatic responses.
Selected from the article's own text.
Abstract
Polycystic ovary syndrome (PCOS) is a heterogeneous endocrine-metabolic disorder associated with hyperandrogenism, impaired insulin action, oxidative stress, and extra-ovarian tissue injury. This study compared blood glucose, serum malondialdehyde/TBARS-estimated lipid peroxidation, and pancreatic histopathology in testosterone propionate (TP)- and oestradiol valerate (EV)-induced PCOS rat models. Eighteen adult female Wistar rats were randomly assigned to control, TP-induced PCOS, and EV-induced PCOS groups (n = 6 each). TP was administered intraperitoneally at 100 mg/kg body weight for 12 consecutive days, whereas EV was administered intraperitoneally at 2 mg/kg body weight for 2 days. PCOS induction was verified by oestrous-cycle disruption. Blood glucose was measured using a glucometer, serum MDA was estimated using the thiobarbituric acid method, and pancreatic tissue was evaluated after hematoxylin-eosin staining. EV induction produced the highest glucose level (232.17 ± 91.30 mg/dL), and the large standard deviation was retained after verification against the original observation records, without exclusion of any animal. TP induction produced the highest serum MDA/TBARS value (62.23 ± 8.12 mg/mL); the numerical values and laboratory-reported unit were retained after rechecking the laboratory calculation sheet. Histopathological evaluation indicated that both hormone-induced models showed pancreatic vacuolization, necrosis, and inflammatory cell infiltration, with EV showing a descriptively more necrosis-dominant pattern and TP showing a descriptively more inflammation-dominant pattern. These findings suggest that TP and EV generate distinct metabolic-oxidative phenotypes in PCOS rats. The combined assessment of glucose, MDA/TBARS, and pancreatic morphology provides a descriptive interpretation of pancreatic involvement in PCOS-associated metabolic dysfunction, without implying a fully confirmed molecular mechanism.
Polycystic ovary syndrome (PCOS) is a common endocrine disorder in reproductive-age females and is diagnosed in adults when at least two of the three Rotterdam-based criteria are present: ovulatory dysfunction, clinical or biochemical hyperandrogenism, and polycystic ovarian morphology, after exclusion of related disorders . Therefore, polycystic ovarian morphology is not mandatory for diagnosis in all adult patients. Beyond reproductive impairment, PCOS is increasingly recognized as a systemic endocrine-metabolic disorder because insulin resistance, compensatory hyperinsulinemia, low-grade inflammation, and cardiometabolic risk frequently accompany the reproductive phenotype ; Helvaci and Yildiz, 2025; . In experimental animals, hyperandrogenism may be reflected by persistent oestrous-cycle disruption and ovarian cystic changes, while associated gross or microscopic tissue alterations depend on the induction model, duration, and target organ examined.
Insulin resistance has a central role in PCOS pathogenesis because reduced insulin-mediated glucose uptake can increase circulating glucose and stimulate compensatory insulin secretion. Hyperinsulinemia may further increase ovarian androgen production and reduce sex hormone-binding globulin, thereby maintaining the endocrine-metabolic loop of PCOS ; . Oxidative stress also contributes to PCOS progression through reactive oxygen species generation, mitochondrial dysfunction, lipid peroxidation, and impaired cellular signaling . MDA is commonly used as an end-product marker of lipid peroxidation and oxidative membrane injury .
The pancreas is relevant to PCOS-related metabolic dysfunction because pancreatic beta-cells compensate for insulin resistance by increasing insulin secretion. Prolonged glucose overload and oxidative stress may subsequently impair beta-cell function and promote degenerative or necrotic changes ; . Therefore, examining pancreatic histopathology together with glucose and MDA/TBARS can help clarify whether PCOS models produce comparable or divergent extra-ovarian metabolic injury patterns.
Hormone-induced rodent models are widely used to study PCOS mechanisms. TP models are commonly used to represent androgen-driven PCOS phenotypes involving insulin resistance, glucose disruption, inflammatory activation, and follicular changes ; . Letrozole-induced models are also widely used as an alternative androgen-excess PCOS model and provide an additional reference point for oxidative and inflammatory changes (Datu Agasi Mohd Kamal et al., 2022; . EV models can induce persistent oestrous alteration, cystic follicles, hyperglycaemia, hyperinsulinemia, and oxidative imbalance ; ; . The novelty of this work is the comparative descriptive integration of blood glucose, serum MDA/TBARS, and pancreatic histopathology to differentiate hyperglycaemia-dominant and oxidative-stress-dominant pancreatic responses in TP- and EV-induced PCOS rats. This study aimed to compare blood glucose level, serum MDA/TBARS level, clinical monitoring parameters (general activity, hair coat condition, feed and water intake, posture, response to handling, and mortality), gross pancreatic necropsy findings, and pancreatic microscopic alterations in female Wistar rats after TP and EV induction.
Materials and methods
Ethical approval
All procedures were conducted according to institutional guidelines for the care and use of laboratory animals. The study protocol was approved by the Research Ethics Committee of Universitas Brawijaya under ethical approval number 079-KEP-UB-2024. Animal handling, PCOS induction, necropsy, intracardiac blood collection after deep anesthesia, serum sampling, biochemical analysis, and tissue processing were performed using procedures adapted from previous PCOS animal-model work conducted at Universitas Brawijaya (; .
Study area and experimental location
Animal acclimatization, hormonal induction, clinical observation, necropsy, serum preparation, and histopathological processing were carried out at the Animal Experimentation Laboratory, Veterinary Anatomy Laboratory, and Animal Disease Diagnostic Laboratory, Faculty of Veterinary Medicine, Universitas Brawijaya, Malang, Indonesia. These laboratories provided controlled housing, sample collection, tissue fixation, and microscopic examination facilities.
Study design and animals
This study used a completely randomized experimental design. Eighteen adult female Wistar rats (Rattus norvegicus), approximately 5-6 months old and weighing 130-180 g, were randomly divided into three groups (n = 6 per group): control, TP-induced PCOS, and EV-induced PCOS. The experimental grouping and hormonal induction protocol are summarized in Table 1.
Reagents and materials
Testosterone propionate (T-Probolin; Keifei Pharma Co. Ltd., British Virgin Islands; androgenic steroid preparation) was used for TP induction. Oestradiol valerate (Progynon; Cadila Healthcare Ltd., India; long-acting oestrogen ester preparation) was used for EV induction and was diluted with sterile virgin coconut oil. Physiological saline solution (0.9% NaCl) was used for vaginal swab preparation and for the control group. Control rats received physiological saline by the intraperitoneal route following the same handling schedule as the induction groups; the injection volume followed the original laboratory dosing
Table 1: Experimental grouping and hormonal induction protocol for PCOS rat models.
Group
Number of rats
Treatment
Purpose
Control
6
Physiological NaCl without hormonal induction
Negative control
TP-induced PCOS
6
Testosterone propionate 100 mg/kg BW intraperitoneally once daily for 12 consecutive days
Hyperandrogenic PCOS-like model
EV-induced PCOS
6
Oestradiol valerate 2 mg/kg BW intraperitoneally for 2 days
Oestrogen-disrupted PCOS-like model
record and no additional intervention was introduced. Methylene blue was used for vaginal cytology staining. Ketamine hydrochloride (KTM-100 Ketamin; Guardian Pharmatama, Indonesia) and xylazine hydrochloride (Xyla; Interchemie, The Netherlands) were used for anesthesia before euthanasia. MDA analysis used 0.9% NaCl, distilled water, 10% trichloroacetic acid, 1 N hydrochloric acid, and 1% thiobarbituric acid reagent. Pancreatic tissue was fixed in 10% neutral buffered formalin and processed for HE staining.
PCOS induction and oestrous-cycle verification
TP induction was performed to represent an androgen-dominant PCOS-like phenotype, whereas EV induction was performed to represent an oestrogen-disrupted phenotype with persistent oestrous alteration. The TP protocol was adapted from Siahaan et al. (2022) and Oktanella et al. (2024), while the EV protocol was adapted from Venegas et al. (2019) and Oktanella et al. (2024). After hormonal induction, the oestrous cycle was verified by vaginal swab. A sterile cotton swab moistened with 0.9% NaCl was gently inserted into the vaginal canal and rotated. The collected cells were smeared onto glass slides, stained with methylene blue, and examined microscopically. Oestrous-cycle phase was identified based on the dominance of nucleated epithelial cells, cornified epithelial cells, and leukocytes.
Clinical monitoring and mortality recording
Clinical condition was monitored during acclimatization and hormonal induction. The observed parameters included general activity, hair coat condition, feed and water intake, posture, and response to handling. Mortality was recorded daily. No mortality occurred during the experimental period.
Blood glucose measurement
Blood glucose was measured after hormonal induction and before or during necropsy using a glucometer with compatible glucose test strips. Blood was applied to the strip according to the manufacturer instructions, and the value was recorded in mg/dL.
Euthanasia, necropsy, and gross examination
Rats were anesthetized using a ketamine-xylazine combination before euthanasia. After deep anesthesia, euthanasia and intracardiac blood collection were performed. This terminal collection method was included within the approved experimental procedure under ethical approval number 079-KEP-UB-2024. Necropsy was conducted immediately through a midline abdominal incision. The pancreas was examined macroscopically for colour change, enlargement, congestion, haemorrhage, visible necrotic foci, adhesion, and abnormal texture before tissue fixation. Gross findings were interpreted descriptively because no prospective gross pathology grading scale was applied.
Serum preparation and MDA measurement
Blood samples were allowed to clot and centrifuged to separate serum. Serum was transferred into 1.5 mL microtubes and stored at -20 degrees C until biochemical analysis. Serum MDA concentration was estimated using the thiobarbituric acid method described by Oktanella et al. []. Because thiobarbituric acid-based assays estimate total thiobarbituric acid reactive substances (TBARS), the values were interpreted as MDA/TBARS-estimated lipid peroxidation rather than a fully specific MDA-only measurement. Briefly, 100 microL serum was mixed with cold 0.9% NaCl and centrifuged. The supernatant reacted with distilled water, trichloroacetic acid, hydrochloric acid, and thiobarbituric acid reagent. After heating in a water bath at 100 degrees C for 20-30 min and cooling to room temperature, absorbance was measured at 532 nm using a microplate reader. The numerical values and laboratory-reported unit were retained after checking the original laboratory calculation sheet.
Pancreatic tissue collection, paraffin embedding, and HE staining
Pancreatic tissue was gently rinsed with physiological saline and fixed in 10% neutral buffered formalin. Fixed tissues were trimmed to appropriate size, dehydrated through graded alcohol concentrations, cleared in xylene, infiltrated with melted paraffin, and embedded in paraffin blocks using standard histological technique . Paraffin blocks were sectioned at approximately 3-5 micrometers using a rotary microtome. Sections were mounted on glass slides, deparaffinized, rehydrated, stained with hematoxylin and eosin, dehydrated, cleared, and mounted for microscopic evaluation.
Pancreatic histopathological evaluation
Pancreatic histopathology was evaluated using a light microscope at 400× magnification. Five microscopic fields were observed from each slide. The main lesions assessed were cytoplasmic vacuolization, necrosis, and inflammatory cell infiltration. Vacuolization was identified by clear cytoplasmic spaces and degenerative cellular swelling. Necrosis was identified by cytoplasmic eosinophilia, nuclear pyknosis, karyorrhexis, karyolysis, and loss of cellular outline. Inflammatory infiltration was identified by the presence of inflammatory cells in pancreatic interstitial or perivascular areas. Lesions were scored semiquantitatively
Moderate lesion involving 25-50% of observed field
3
Severe lesion involving >50% of observed field
Statistical analysis
Quantitative data were presented as mean ± standard deviation. Normality and homogeneity were checked before parametric testing. Blood glucose and MDA/TBARS levels were analyzed using one-way analysis of variance at a 95% confidence level. When significant differences were detected, post hoc pairwise comparisons were performed using the least significant difference test, consistent with the principles of post hoc comparison described by Kim (2015). Histopathological scores were analyzed using a non-parametric test because the data were semiquantitative ordinal scores. A p value < 0.05 was considered statistically significant. Correlation analysis between biochemical and histopathological parameters was not added in the present revision because the authors retained the original statistical plan and did not recalculate or modify the dataset; therefore, the integrated interpretation is presented as descriptive.
Results
PCOS model verification and clinical observations
The control group showed a regular oestrous cycle with sequential proestrus, oestrus, metestrus, and dioestrus phases. In contrast, hormone-induced groups showed oestrous-cycle disruption after induction. TP-induced rats showed irregular cyclicity characterized by persistent oestrus followed by persistent dioestrus, whereas EV-induced rats showed persistent oestrous disruption. Clinical monitoring included general activity, hair coat condition, feed and water intake, posture, response to handling, and mortality. No mortality was recorded during the experimental period.
Gross necropsy findings
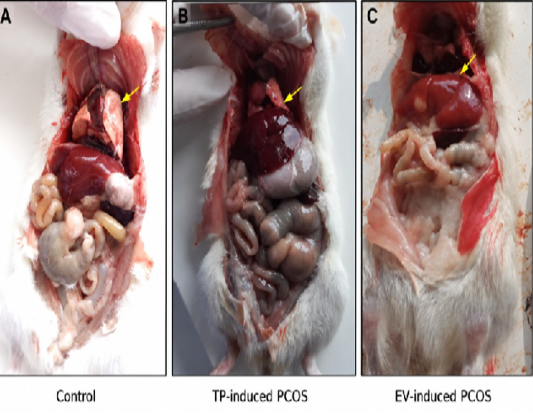
Gross pancreatic observations were evaluated before microscopic examination. Macroscopic assessment focused on colour change, enlargement, congestion, haemorrhage, visible necrotic foci, adhesion, and abnormal texture (Figure 1). Because no prospective gross pathology grading scale was applied, these macroscopic findings are presented as descriptive observations only and were not included in the statistical analysis.
Figure 1. Gross pancreatic observation in control and hormone-induced PCOS rats. Representative macroscopic photographs show pancreatic tissue from the control, testosterone propionate (TP)-induced PCOS, and oestradiol valerate (EV)-induced PCOS groups. Gross evaluation was performed immediately after necropsy and focused on pancreatic colour, enlargement, congestion, haemorrhage, visible necrotic foci, adhesion, and abnormal tissue texture. The control group was used as the physiological baseline, whereas the TP- and EV-induced groups were assessed descriptively for gross pancreatic alterations associated with hormone-induced PCOS-related metabolic disturbance. Because no prospective gross pathology scoring system was applied, the macroscopic findings are presented as descriptive observations only.
Blood glucose level
Blood glucose levels differed among experimental groups (Table 3). The control group showed a mean glucose level of 127.30 ± 46.10 mg/dL. The TP-induced group showed a modest increase to 145.50 ± 37.10 mg/dL. The EV-induced group showed the highest glucose level, 232.17 ± 91.30 mg/dL, representing an approximately 82.3% increase compared with control. Statistical analysis indicated that the EV group differed significantly from the control and TP groups (p < 0.05). The relatively large standard deviation in the EV group was retained after checking the original observation records, and no animal was excluded from the analysis.
Table 3: Blood glucose levels in control and hormone-induced PCOS rats.
Group
Blood glucose (mg/dL)
Control
127.30 ± 46.10 a
TP-induced PCOS
145.50 ± 37.10 a
EV-induced PCOS
232.17 ± 91.30 b
Note: Values are presented as mean ± standard deviation. Different superscript letters indicate significant differences among groups (p < 0.05).
Serum MDA level
Serum MDA/TBARS levels are shown in Table 4. The control group showed an MDA/TBARS level of 33.78 ± 5.28 mg/mL. TP induction produced the highest MDA/TBARS level (62.23 ± 8.12 mg/mL), which was significantly higher than both control and EV groups. The EV group showed an MDA/TBARS level of 32.54 ± 4.06 mg/mL, which was comparable with the control group. The numerical values and laboratory-reported unit were retained after checking the original laboratory calculation sheet; because the thiobarbituric acid method estimates TBARS, the values were interpreted as TBARS-estimated lipid peroxidation.
Table 4: Serum MDA levels in control and hormone-induced PCOS rats.
Group
Serum MDA/TBARS (mg/mL; laboratory-reported unit)
Control
33.78 ± 5.28 a
TP-induced PCOS
62.23 ± 8.12 b
EV-induced PCOS
32.54 ± 4.06 a
Note: Values are presented as mean ± standard deviation. Different superscript letters indicate significant differences among groups (p < 0.05).
Pancreatic histopathological changes
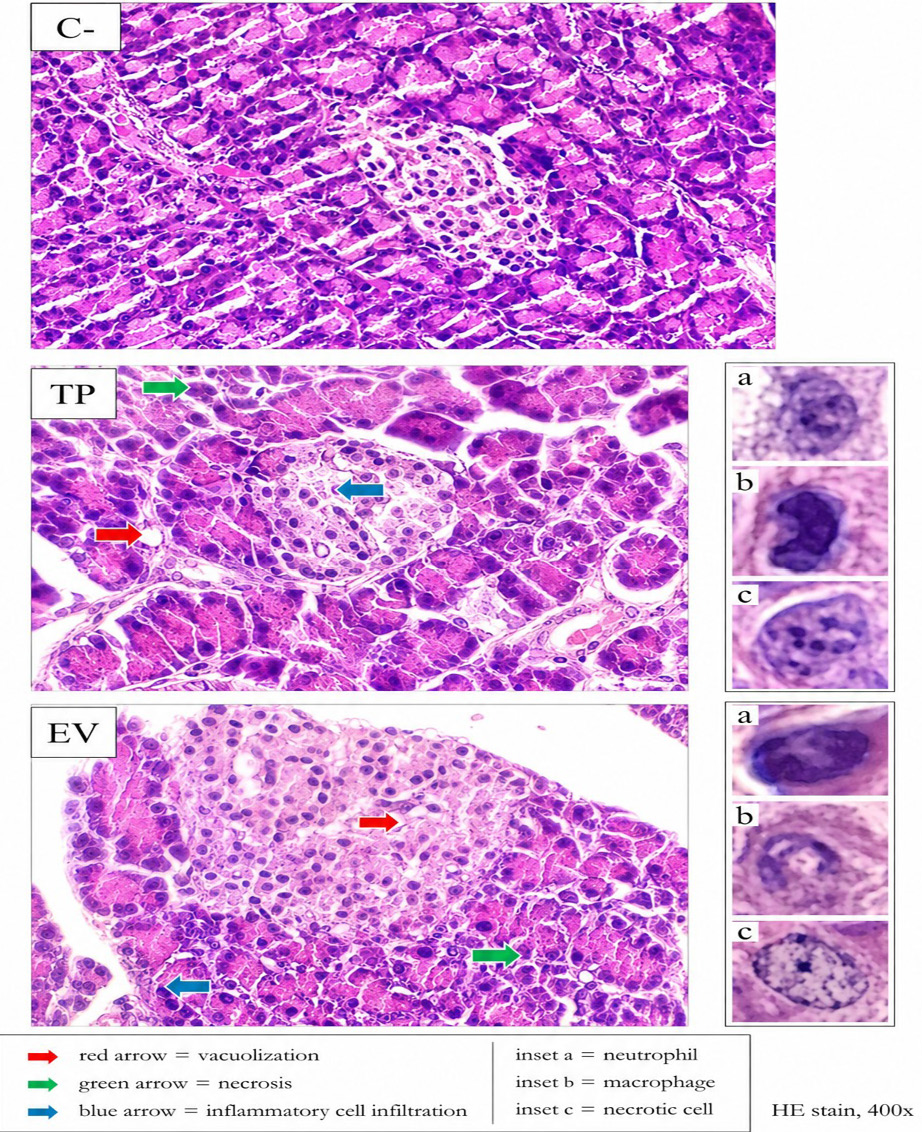
Microscopic examination showed that the control group had relatively preserved pancreatic architecture, with organized acinar tissue and visible pancreatic islets (Figure 2). In the TP-induced PCOS group, pancreatic tissue showed cytoplasmic vacuolization, interstitial inflammatory cell infiltration, and mild necrotic change. Inflammatory infiltration was more prominent in the TP group than in the other groups, indicating a descriptively inflammation-dominant pancreatic pattern. In the EV-induced PCOS group, pancreatic tissue showed more evident degenerative and necrotic changes, including cytoplasmic vacuolization, loss of cellular borders, eosinophilic cytoplasm, and nuclear pyknosis/karyorrhexis. This pattern was interpreted as a descriptively necrosis-dominant pancreatic response associated with the marked glucose elevation observed in EV-induced rats. These morphological interpretations are descriptive and do not prove cytokine-mediated, apoptotic, or other molecular mechanisms. Semiquantitative scores for pancreatic vacuolization, necrosis, and inflammatory cell infiltration are presented in Table 5.
Figure 2. Pancreatic histopathological features in control and hormone-induced PCOS rat models. Red arrows indicate cytoplasmic vacuolization, green arrows indicate necrosis, and blue arrows indicate inflammatory cell infiltration. The inset shows representative neutrophil (a), macrophage (b), and necrotic cell (c). HE staining, 400× magnification.
Representative hematoxylin-eosin-stained pancreatic sections show tissue architecture in the control, testosterone propionate (TP)-induced PCOS, and oestradiol valerate (EV)-induced PCOS groups. The control group shows relatively preserved pancreatic architecture, organized acinar tissue, and visible pancreatic islets. TP-induced PCOS rats show cytoplasmic vacuolization, interstitial inflammatory cell infiltration, and mild necrotic changes, indicating a descriptively inflammation-dominant lesion pattern. EV-induced PCOS rats show more evident degenerative and necrotic changes, including loss of cellular borders, eosinophilic cytoplasm, and nuclear pyknosis/karyorrhexis, indicating a descriptively necrosis-dominant lesion pattern.
Integrated metabolic, oxidative, and pancreatic injury profile
The EV-induced PCOS group showed the highest blood glucose level and a descriptively necrosis-dominant pancreatic lesion pattern. The TP-induced PCOS group showed the highest serum MDA/TBARS level and a
Table 5: Pancreatic histopathological scores in control and hormone-induced PCOS rats.
Histopathological parameter
Control
Testosterone propionate-induced PCOS
Oestradiol valerate-induced PCOS
Vacuolization
0.27 ± 0.20ᵃ
1.07 ± 0.48ᵇ
0.93 ± 0.20ᵇ
Necrosis
0.50 ± 0.30ᵃ
0.80 ± 0.18ᵃ
1.10 ± 0.17ᵇ
Inflammation
0.30 ± 0.37ᵃ
1.37 ± 0.69ᵇ
0.50 ± 0.61ᵃ
Note: Values are presented as mean ± standard deviation. Different superscript letters in the same row indicate significant differences among groups (p < 0.05).
descriptively inflammation-dominant pancreatic lesion pattern. Both hormone-induced groups showed pancreatic vacuolization compared with control, suggesting that TP and EV can both produce pancreatic degenerative changes, but through different dominant injury profiles (Table 6). This integrated profile is descriptive because no correlation coefficients were added in the current revision.
Table 6: Summary of dominant alterations in each experimental group.
Group
Dominant biochemical response
Dominant pancreatic response
Interpretation
Control
Baseline glucose and MDA
Preserved pancreatic structure
Physiological baseline
TP-induced PCOS
Highest MDA
Inflammation-dominant lesion
Oxidative-inflammatory phenotype
EV-induced PCOS
Highest glucose
Necrosis-dominant lesion
Hyperglycaemia-necrosis phenotype
Discussion
In the current study, TP and EV induction produced different metabolic, oxidative, and pancreatic responses in female Wistar rats. EV induction caused the greatest increase in blood glucose, whereas TP induction caused the highest serum MDA/TBARS concentration. This tendency supports a descriptive interpretation that EV induced a hyperglycaemia-dominant phenotype in PCOS and TP induced an oxidative-stress-dominant phenotype. These findings align with current understanding that PCOS is not limited to reproductive dysfunction but represents a heterogeneous systemic endocrine-metabolic disorder involving insulin resistance, hyperandrogenism, inflammation, oxidative stress, and variable cardiometabolic risk ; ; .
The marked glucose elevation in the EV group suggests more severe disruption of glucose homeostasis than in the TP group. Previous EV-induced PCOS studies have reported hyperglycaemia, hyperinsulinemia, lipid abnormalities, cystic follicles, and ovarian dysfunction ; . These findings support the suitability of EV induction for modelling PCOS-related metabolic disturbance. TP-induced models can also elevate glucose and insulin through androgen-related insulin resistance , but in the present dataset the increase was smaller than that produced by EV. This difference may reflect the distinct endocrine characteristics of the two models, with EV strongly disturbing hypothalamic-pituitary-ovarian axis regulation and glucose metabolism, while TP primarily represents androgen-driven oxidative and inflammatory disruption.
The highest MDA/TBARS concentration in the TP group indicates stronger systemic lipid peroxidation after TP induction. MDA is an end-product of lipid peroxidation and reflects oxidative damage to cellular membranes . The TP-associated increase in MDA/TBARS is compatible with previous evidence that androgenic PCOS models can activate inflammatory and oxidative pathways ; . However, this finding differs from some EV- and letrozole-based PCOS studies in which oxidative stress markers were also elevated (Datu Agasi Mohd Kamal et al., 2022; ; ;
. The discrepancy may be explained by differences in induction agent, dose, treatment duration, sampling time, target tissue, and whether systemic or tissue-specific oxidative markers were measured. Because the present thiobarbituric acid method estimates TBARS, the result should be interpreted as an estimate of lipid peroxidation rather than a fully specific MDA-only measurement.
Pancreatic histopathology descriptively supported the biochemical patterns. EV-induced rats showed the highest glucose level and a more necrosis-dominant pancreatic pattern, which is consistent with a descriptive association between glucose dysregulation and pancreatic cellular injury. In contrast, TP-induced rats showed the highest MDA/TBARS level and a more inflammation-dominant pancreatic pattern, which is consistent with a descriptive association between androgen-related lipid peroxidation and inflammatory tissue response. The increase in vacuolization in both hormone-induced groups indicates shared degenerative pancreatic stress despite different dominant injury profiles. Similar pancreatic beta-cell injury and metabolic disruption have been reported in PCOS models and in studies of glucose-related pancreatic stress ; .
Overall, the results suggest that pancreatic injury in hormone-induced PCOS may arise through overlapping but non-identical injury profiles. EV may act predominantly through hyperglycaemia, beta-cell metabolic overload, and necrotic injury, whereas TP may act predominantly through androgen-related oxidative stress, lipid peroxidation, and inflammatory activation. These interpretations should be viewed as biologically plausible and descriptive because inflammatory cytokines, apoptotic markers, insulin signaling proteins, and correlation coefficients were not evaluated in the present dataset. This distinction is important for selecting PCOS animal models according to the intended experimental outcome. EV induction may be more suitable for evaluating hyperglycaemia-associated pancreatic damage, whereas TP induction may be more appropriate for studying androgen-associated oxidative stress and inflammation.
Limitations and recommendations
This study was limited by the absence of direct insulin, HOMA-IR, GLUT-4, IRS-1/PI3K, pancreatic insulin immunoexpression, antioxidant enzyme activity, inflammatory cytokines, apoptotic markers, tissue-specific ROS measurements, and paired biochemical-histopathological correlation analysis. Therefore, the proposed mechanism should be interpreted as a biologically supported descriptive interpretation based on glucose, serum MDA/TBARS, and histopathology rather than a fully confirmed molecular pathway. Gross pancreatic findings were also descriptive because a prospective gross pathology grading scale was not applied. In addition, the thiobarbituric acid method estimates TBARS and may be influenced by assay interference; therefore, the MDA values should be interpreted as TBARS-estimated lipid peroxidation. Future studies should include insulin-related indices, pancreatic beta-cell markers, antioxidant enzymes such as SOD, CAT, and GPx, inflammatory and apoptotic markers, molecular analysis of insulin-signalling pathways, and correlation analysis between biochemical and histopathological parameters. Representative gross and histological images are submitted separately through the Manuscript Handler system with complete figure legends.
Conclusion
TP and EV induction produced distinct metabolic, oxidative, and pancreatic injury profiles in female Wistar rats. EV caused the highest blood glucose level and was associated with a descriptively necrosis-dominant pancreatic pattern, whereas TP caused the highest serum MDA/TBARS level and was associated with a descriptively inflammation-dominant pancreatic pattern. These findings support the heterogeneous extra-ovarian character of PCOS models and indicate that combined assessment of glucose, MDA/TBARS, and pancreatic histopathology can help descriptively differentiate hyperglycaemia-related and oxidative-inflammatory pancreatic responses. Future work should validate these findings using insulin-resistance indices, antioxidant enzymes, inflammatory and apoptotic markers, pancreatic beta-cell molecular markers, and paired correlation analysis.
Declarations
Ethical approval: The study was approved by the Research Ethics Committee of Universitas Brawijaya under ethical approval number 079-KEP-UB-2024.
Data availability
The datasets generated and analyzed during the current study are available from the corresponding author upon reasonable request.
Funding
This research was supported by the DPPSPP FKH UB 2024 Internal Funding under contract number 1745/UN10.F13/2024.
Abbreviation
ANOVA, Analysis of variance; BW, Body weight; EV, Oestradiol valerate; HE, Hematoxylin-eosin; HOMA-IR, Homeostatic model assessment of insulin resistance; MDA, Malondialdehyde; PCOS, Polycystic ovary syndrome; ROS, Reactive oxygen species; TP, Testosterone propionate.
ACKNOWLEDGEMENTS
The authors thank the Faculty of Veterinary Medicine, Universitas Brawijaya, and all lasboratory staff involved in animal maintenance, sample collection, biochemical analysis, and histopathological preparation.
NOVELTY STATEMENT
This study provides a direct comparative assessment of testosterone propionate- and oestradiol valerate-induced PCOS rat models by integrating blood glucose, serum MDA/TBARS-estimated lipid peroxidation, and pancreatic histopathology. The findings reveal descriptively distinct extra-ovarian injury profiles, with EV showing a hyperglycaemia-necrosis pattern and TP showing an oxidative-inflammatory pattern, which may help guide model selection for future PCOS metabolic and pancreatic studies.
AUTHOR’S CONTRIBUTION
Y.O. conceived and supervised the study. S.M.H., N.F.R.P., J., and N.R.M. contributed to animal handling, sample collection, laboratory analysis, data interpretation, and manuscript preparation. All authors reviewed and approved the final manuscript.
Generate AI and AI assisted technology statement
The authors declare that no generative AI and AI assisted technology was used in the creation of this manuscript.
Conflict of interest
The authors declare that they have no competing interests.
Figures
Figure 1:.
Gross pancreatic appearance in control and hormone-induced PCOS rats. Representative macroscopic photographs show pancreatic tissue from the control (A), testosterone propionate (TP)-induced PCOS (B), and oestradiol valerate (EV)-induced PCOS (C) groups. Yellow arrows indicate the pancreatic region. Gross assessment focused on colour, enlargement, congestion, haemorrhage, visible necrotic foci, adhesion, and abnormal tissue texture. Because no prospective gross-pathology grading system was applied, the findings are presented descriptively.
Figure 2:.
Pancreatic histopathological features in control and hormone-induced PCOS rat models. Representative hematoxylin-eosin-stained sections show relatively preserved pancreatic architecture in the control group, cytoplasmic vacuolization and prominent inflammatory cell infiltration in the TP-induced PCOS group, and more evident degenerative and necrotic changes in the EV-induced PCOS group. Red arrows indicate cytoplasmic vacuolization, green arrows indicate necrosis, and blue arrows indicate inflammatory cell infiltration. Insets show a representative neutrophil (a), macrophage (b), and necrotic cell (c). HE stain, 400× magnification.
Figure 3:.
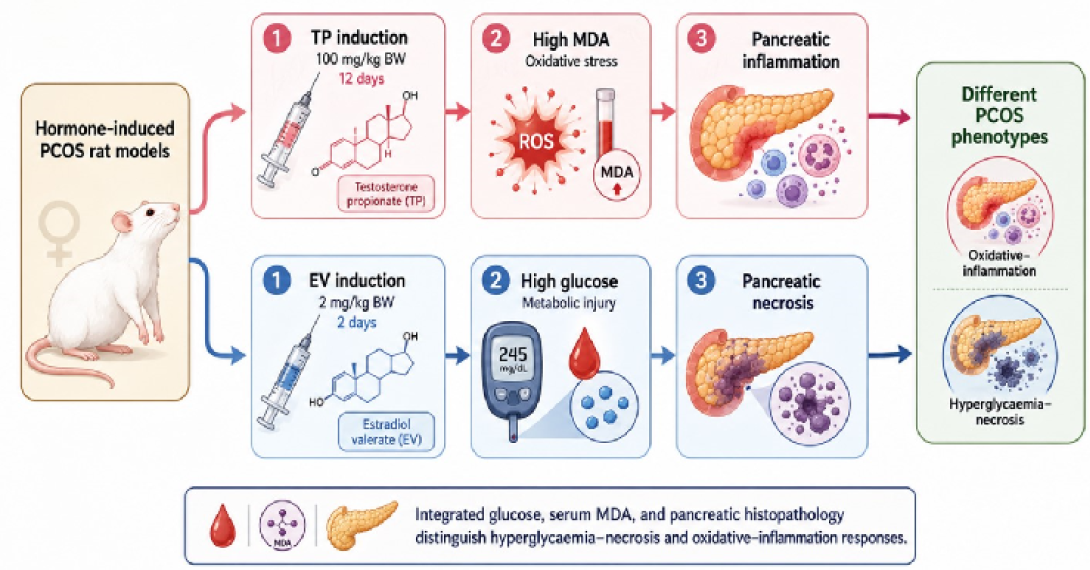
Schematic summary of the distinct metabolic, oxidative, and pancreatic responses observed in TP- and EVinduced PCOS rat models. TP induction (100 mg/kg BW for 12 days) was characterized by the highest serum MDA/ TBARS level and an inflammation-dominant pancreatic lesion pattern, whereas EV induction (2 mg/kg BW for 2 days) was characterized by the highest blood glucose level and a necrosis-dominant pancreatic lesion pattern. The schematic provides a descriptive integration of the study findings and does not imply a fully confirmed molecular mechanism. Table 6: Summary of dominant alterations in each experimental group.
References
Armanini D, Boscaro M, Bordin L, Sabbadin C (2022). Controversies in the pathogenesis, diagnosis and treatment of PCOS: Focus on insulin resistance, inflammation, and hyperandrogenism. Int. J. Mol. Sci., 23(8):4110. https://doi.org/10.3390/ijms23084110[CrossRef]
Cordiano R, Di Gioacchino M, Mangifesta R, Panzera C, Gangemi S, Minciullo PL (2023). Malondialdehyde as a potential oxidative stress marker for allergy-oriented diseases: An update. Molecules, 28(16):5979. https://doi.org/10.3390/molecules28165979[CrossRef]
Datu Agasi Mohd Kamal DA, Ibrahim SF, Ugusman A, Mokhtar MH (2022). Kelulut honey ameliorates oestrus cycle, hormonal profiles, and oxidative stress in letrozole-induced polycystic ovary syndrome rats. Antioxidants, 11(10):1879. https://doi.org/10.3390/antiox11101879[CrossRef]
Dinic S, Arambasic Jovanovic J, Uskokovic A, Mihailovic M, Grdovic N, Tolic A, Rajić J, Đorđević M, Vidaković M (2022). Oxidative stress-mediated beta cell death and dysfunction as a target for diabetes management. Front Endocrinol., 13:1006376. https://doi.org/10.3389/fendo.2022.1006376[CrossRef]
Farhadi-Azar M, Ghahremani M, Mahboobifard F, Noroozzadeh M, Yaghmaei P, Tehrani FR (2023). Effects of Rosa damascena on reproductive improvement, metabolic parameters, liver function and insulin-like growth factor-1 gene expression in estradiol valerate-induced polycystic ovarian syndrome in Wistar rats. Biomed. J., 46(3). https://doi.org/10.1016/j.bj.2022.05.003[CrossRef]
Farhadi-Azar M, Mahboobifard F, Mousavi M, Saei Ghare Naz M, Farahmand M, Yaghmaei P, Ramezani Tehrani F (2025). Therapeutic efficacy of rosa damascena Mill. on oxidative stress parameters and cyclooxygenase-2 gene expression in estradiol valerate-induced polycystic ovarian syndrome in Wistar rats. Sci. Rep., 15:34428. https://doi.org/10.1038/s41598-025-17484-2[CrossRef]
Genazzani AD, Genazzani AR (2023). Polycystic ovary syndrome as metabolic disease: New insights on insulin resistance. Touch REVIEWS Endocrinol., 19(1):71-77. https://doi.org/10.17925/EE.2023.19.1.71[CrossRef]
Helvaci N, Yildiz BO (2025). Polycystic ovary syndrome as a metabolic disease. Nat. Rev. Endocrinol., 21:230-244. https://doi.org/10.1038/s41574-024-01057-w[CrossRef]
Jing J, Peng YC, Fan W, Han SJ, Peng Q, Xue C, Qin X, Liu Y, Ding Z (2025). Obesity-induced oxidative stress and mitochondrial dysfunction negatively affect sperm quality. FEBS Open Bio., X;13(4):763-778. https://doi.org/10.1002/2211-5463.13589[CrossRef]
Kim HY (2015). Statistical notes for clinical researchers: Post-hoc multiple comparisons. Restor. Dent. Endod., 40(2):172-176. https://doi.org/10.5395/rde.2015.40.2.172[CrossRef]
Kokabiyan Z, Yaghmaei P, Jameie SB, Hajebrahimi Z (2022). Therapeutic effects of eugenol in polycystic ovarian rats induced by estradiol valerate: A histopathological and biochemical study. Int. J. Fertil. Steril., 16(3):184-191.
Mirseyyed SF, Zavareh S, Nasiri M, Hashemi-Moghaddam H (2024). An experimental study on the oxidative status and inflammatory levels of a rat model of polycystic ovary syndrome induced by letrozole and a new high-fat diet. Int. J. Fertil. Steril., 18(1):45-53.
Mohammed SA, Abd Elhaliem NG, Fanous YL, Abdelrahman A, Moghazy HM (2022). Erythropoietin, myoinositol and metformin modulate insulin sensitivity indices, pancreatic beta cell mass and hepatocellular changes in a rat model of polycystic ovary syndrome. Ain Shams Med. J., 73(4):803-821. https://doi.org/10.21608/asmj.2022.285444[CrossRef]
Mukai E, Fujimoto S, Inagaki N (2022). Role of reactive oxygen species in glucose metabolism disorder in diabetic pancreatic beta-cells. Biomolecules, 12(9):1228. https://doi.org/10.3390/biom12091228[CrossRef]
Naseri L, Akbaribazm M, Khazaei M (2024). Hormonal and physiological manipulation methods to induce polycystic ovary in rodents: A review of the new findings. OBM Genet., 8(3):1-23. https://doi.org/10.21926/obm.genet.2403248[CrossRef]
Oktanella Y, Ismiawati H, Zakaria H, Untari H (2024). Exploring blood pressure dynamics and oxidative stress markers in an animal model of polycystic ovary syndrome. Open Vet. J., 14(8):1858-1865. https://doi.org/10.5455/OVJ.2024.v14.i8.14[CrossRef]
Oktanella Y, Untari H, Wuragil DK, Ismiawati H, Hasanah NA, Agustina GC, Pratama DAO (2023). Evaluation of renal disturbance in animal models of polycystic ovary syndrome. Open Vet. J., 13(8):1003-1011. https://doi.org/10.5455/OVJ.2023.v13.i8.6[CrossRef]
Rasouli MA, Katz J, Dumesic DA (2025). Interface between reproductive and metabolic dysfunction in polycystic ovary syndrome. Curr. Opin. Obstet. Gynecol., https://doi.org/10.1097/GCO.0000000000001037[CrossRef]
Sadeghi HM, Adeli I, Calina D, Docea AO, Mousavi T, Daniali M, Nikfar S, Tsatsakis A, Abdollahi M (2022). Polycystic ovary syndrome: A comprehensive review of pathogenesis, management, and drug repurposing. Int. J. Mol. Sci., 23(2):583. https://doi.org/10.3390/ijms23020583[CrossRef]
Siahaan SCPT, Santoso B, Widjiati (2022). Effectiveness of Moringa oleifera leaves on TNF-alpha expression, insulin levels, glucose levels and follicle count in Rattus norvegicus PCOS model. Diabetes Metab. Syndr. Obes., 15:3255-3270. https://doi.org/10.2147/DMSO.S385492[CrossRef]
Sun MZ, Wu Y, Yuan C, Lyu JY, Zhao XY, Ruan YC, Guo JH, Chen H, Huang WQ (2024). Androgen-induced upregulation of CFTR in pancreatic beta-cell contributes to hyperinsulinemia in PCOS model. Endocrine, 83:242-250. https://doi.org/10.1007/s12020-023-03516-2[CrossRef]
Suvarna KS, Layton C, Bancroft JD (2018). Editors; Bancroft’s Theory and Practice of Histological Techniques. 8th ed. Elsevier.
Teede HJ, Tay CT, Laven JJE, Dokras A, Moran LJ, Piltonen TT, Costello MF, Boivin J, Redman LM, Boyle JA, Norman RJ, Mousa A, Joham AE (2023) Recommendations from the 2023 International Evidence-based Guideline for the assessment and management of polycystic ovary syndrome. J. Clin. Endocrinol. Metab., 108(10):2447-2469. https://doi.org/10.1210/clinem/dgad463[CrossRef]
Venegas B, De Leon Gordillo LY, Rosas G, Espinoza JA, Moran C, Dominguez R, Morales-Ledesma L (2019). In rats with estradiol valerate-induced polycystic ovary syndrome, the acute blockade of ovarian beta-adrenoreceptors improves ovulation. Reprod. Biol. Endocrinol., 17:95. https://doi.org/10.1186/s12958-019-0539-y[CrossRef]
Yan H, Wang L, Zhang G, Li N, Zhao Y, Liu J, Jiang M, Du X, Zeng Q, Xiong D, He L, Zhou Z, Luo M, Liu W (2024) Oxidative stress and energy metabolism abnormalities in polycystic ovary syndrome: From mechanisms to therapeutic strategies. Reprod. Biol. Endocrinol., 22:159. https://doi.org/10.1186/s12958-024-01337-0[CrossRef]
Zeber-Lubecka N, Ciebiera M, Hennig EE (2023). Polycystic ovary syndrome and oxidative stress - From bench to bedside. Int. J. Mol. Sci., 24(18):14126. https://doi.org/10.3390/ijms241814126[CrossRef]