The Padang reports showed recurrent AI Type A detection, a marked change in the reported H5/H9/HxNx classification composition, and pool-level AI and ND marker patterns.
Official surveillance reports from Padang live bird markets showed recurrent AI Type A-positive results during 2020–2023, with positive samples reported in every surveillance year and positivity among tested samples remaining above 50%.
Among the years with follow-up classification, the reported H9 share declined from 94.8% in 2020 to 31.5% in 2023, while the unresolved HxNx category increased from 3.4% to 68.5%.
A separate September 2023 pooled activity additionally documented AI and Newcastle disease marker patterns at the pool level and was interpreted independently of the annual series.
Selected from the article's own text.
Abstract
Live bird market surveillance can document repeated pathogen detection and reporting patterns, but differences in sampling structure can limit direct comparison across surveillance activities. This study descriptively reanalysed aggregated surveillance data from 12 traditional live bird markets in Padang, Indonesia, during 2020–2023. Annual avian influenza (AI) Type A positivity and reported H5, H9, and HxNx classifications were recalculated from published counts. A separate pooled dataset from September 2023 was analysed independently for AI and Newcastle disease (ND) marker-detection patterns. Across 1,651 tested samples, 963 were AI Type A positive, giving an overall weighted surveillance positivity of 58.3%. Annual positivity remained above 50%, ranging from 53.7% in 2021 to 70.7% in 2020. Among AI Type A-positive samples with reported classification results, the H9 proportion declined from 94.8% in 2020 to 31.5% in 2023, while the source-reported unresolved HxNx category increased from 3.4% to 68.5%. In the separate pooled dataset, 28 of 72 pools contained at least one AI or ND marker, and 20 of the 28 positive pools contained two or three reported markers. The count-derived pooled detection value of 38.9% was internally consistent with the reported category counts but differed from the 49% value stated in the source narrative. These findings document recurrent AI Type A detection among tested surveillance samples and a marked change in the reported classification composition, while risk-based sampling and differing data structures limit population-level and cross-dataset inference. Continued surveillance would benefit from broader characterisation of unresolved AI-positive samples and more consistent reporting of denominators, pool composition, sampling procedures, and poultry-origin information.
Avian influenza (AI) remains an important poultry-health concern in Indonesia because its continued circulation can affect poultry production, trade, and disease-control activities ; . Traditional live bird markets are important surveillance locations because they bring together poultry from different suppliers and production areas. Birds, cages, slaughtering activities, waste, and market environments may therefore provide opportunities for the introduction, detection, and spread of poultry pathogens . Previous studies in Indonesia have shown that environmental sampling in live bird markets can detect AI virus contamination and provide useful information for veterinary surveillance ; . More recent Indonesian evidence has continued to identify genetically diverse H5N1 viruses in live bird markets, including detections from bird and environmental samples . Newcastle disease also remains an important poultry disease in Indonesia, with continuing epidemiological and control relevance .
Official veterinary reports provide valuable surveillance information, but differences in data availability, sampling design, and reporting format can limit comparisons across surveillance activities . This is particularly important for risk-based surveillance, which intentionally targets animals or locations with a higher probability of disease detection . Consequently, the proportion of positive samples should not be interpreted directly as population prevalence . A careful secondary analysis can improve the usefulness of these reports by reconstructing explicit numerators and denominators, analysing datasets with different sampling units separately, checking internal consistency between reported counts and percentages, and identifying which comparisons remain supportable.
The aim of this study was to harmonise and descriptively reanalyse aggregated data from previously published surveillance activities in Padang live bird markets during 2020–2023 while retaining the distinctions between their reporting structures. Specifically, the study summarised annual AI Type A surveillance positivity, the reported H5, H9, and HxNx classification composition, and AI and Newcastle disease marker-detection patterns in a separate pooled surveillance activity from September 2023. Together, these measures capture three levels of routine surveillance information: broad AI detection across reporting years, follow-up classification of AI-positive material, and pool-level multi-marker reporting. The September 2023 pooled dataset was included as a complementary surveillance activity and was not treated as part of the annual 2020–2023 series. The analysis was designed to describe and compare the available surveillance indicators within their reporting structures, not to estimate population prevalence or to perform formal time-series or clustering analysis. The reanalysis also aimed to identify reporting elements that would improve the interpretation and verification of future live bird market surveillance.
MATERIALS AND METHODS
Study design and surveillance setting
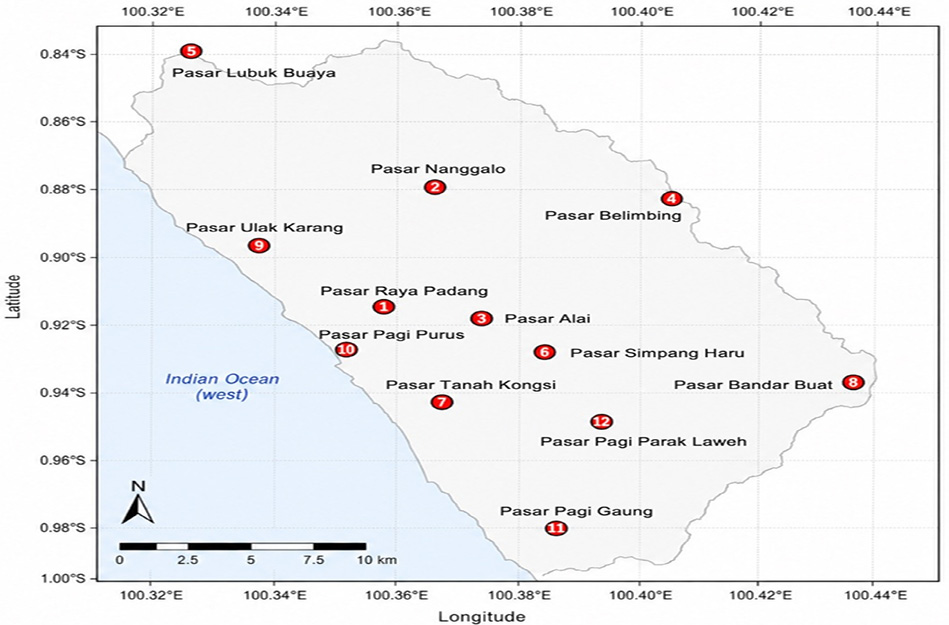
This study was a retrospective secondary analysis of aggregated official veterinary surveillance data from traditional live bird markets in Padang City, West Sumatra, Indonesia. The original surveillance covered 12 markets (Figure 1): Pasar Raya Padang, Pasar Nanggalo, Pasar Alai, Pasar Belimbing, Pasar Lubuk Buaya, Pasar Simpang Haru, Pasar Tanah Kongsi, Pasar Bandar Buat, Pasar Ulak Karang, Pasar Pagi Purus, Pasar Pagi Gaung, and Pasar Pagi Parak Laweh. The present study did not influence the original sampling design, specimen collection, or laboratory testing. It restructured and analysed the aggregated counts reported by Balai Veteriner Bukittinggi.
The source surveillance was risk-based rather than probability-based. In the published surveillance protocol, market slaughtering activity was treated as a higher-risk characteristic; trader selection considered the number of traders, sales frequency, market location, live-bird volume, carcass volume, and slaughtering activity. Sampling was conducted one to three times per year, with frequency depending on field conditions and budget availability. Consequently, the analysed proportions represent positivity among tested surveillance samples and must not be interpreted as prevalence in the poultry population, the market population, or individual markets.
Data sources and dataset structure
Data were extracted from two articles published in Buletin Informasi Kesehatan Hewan, Volume 26 Number 108 and Volume 26 Number 109 (Balai Veteriner Bukittinggi, 2024a, b). The first source provided annual avian influenza (AI) Type A results for 2020-2023, comprising 1,651 tested samples and 963 AI Type A-positive samples. The surveillance included poultry and environmental swab samples. Poultry hosts reported in the source included broilers, native or kampung chickens, layers, ducks, Muscovy ducks, and geese, although host-specific annual denominators were not consistently reported. It also reported H5, H9, and HxNx classifications for 2020, 2022, and 2023. In 2021, only AI Type A detection was conducted; H5, H9, and HxNx follow-up classification was not performed. The source described poultry tracheal/
cloacal swabs and environmental swabs. AI detection was performed using RT-PCR and embryonated chicken egg inoculation, with AI Type A-positive material subsequently reported as H5, H9, or HxNx under the source testing scheme.
The second source described a separate surveillance activity conducted in September 2023. It comprised 72 pooled samples representing 317 poultry or environmental sampling units: 240 broilers, 60 native chickens, 12 environmental swabs, and five ducks. Of the 72 pools, 44 were negative for all reported AI and ND markers, while the remaining pools were assigned to reported pool-level detection categories comprising single or combined AI H5, AI H9, and Newcastle disease (ND) markers. The unit of analysis for this dataset was the pool; the 317 represented poultry or environmental sampling units were used only to describe sample composition. The published source did not provide a complete per-pool size distribution. For this pooled surveillance activity, poultry and environmental swabs were pooled and investigated by embryonated chicken egg inoculation, followed by HA/HI identification of AI H5, AI H9, and ND patterns.
Laboratory classifications were accepted as reported in the official sources. No specimens were retested, and assay performance, viral viability, genome sequence, and molecular lineage could not be independently evaluated from the aggregated data.
Data extraction and harmonisation
Annual AI Type A surveillance positivity was calculated as the number of AI Type A-positive samples divided by the number tested in each surveillance year. Overall weighted surveillance positivity was calculated as the total number of AI Type A-positive samples divided by the total number tested across 2020-2023. For years with available classification results, H5, H9, and HxNx shares were calculated separately using the number of classified AI Type A-positive samples as the denominator. Percentage-point changes were used only as descriptive summaries.
For the annual dataset, the extracted variables were surveillance year, total samples tested, AI Type A-positive samples, and the numbers reported as H5, H9, or HxNx. The number of negative samples was calculated as the difference between the total tested and AI Type A-positive counts.
The source term HxNx was retained in descriptive tables for traceability. It was interpreted as an AI Type A-positive sample not classified as H5 or H9 under the reported testing scheme and was not treated as a single confirmed subtype. H5, H9, and HxNx were retained as separate reported classifications in all descriptive summaries. The 2021 observations were retained for annual AI Type A surveillance positivity but excluded from classification summaries because downstream H5/H9/HxNx testing was not performed in that year.
For the pooled dataset, the extracted variables were the number of negative pools and the number of pools in each reported pattern: ND only, AI H9 only, AI H5 only, AI H5 plus AI H9, AI H5 plus ND, AI H9 plus ND, and AI H5 plus AI H9 plus ND. Marker-specific indicators were reconstructed by summing all patterns containing the relevant marker. Single-marker patterns contained one reported marker, whereas multi-marker patterns contained two or three reported markers. These terms describe marker occurrence within the same pooled sample and do not establish individual-bird co-infection.
All percentages were recalculated from the published numerators and denominators. The pooled-pattern counts yielded 28 pools with at least one AI or ND marker and 44 negative pools, corresponding to 28/72 (38.9%). The source narrative also stated 49%. The count-based estimate was used because it was internally consistent with the reported category frequencies, while the discrepancy was retained as a source-data limitation. Harmonisation referred to standardising variable labels and denominators, recalculating percentages from published counts, separating datasets with different sampling units, and documenting internal inconsistencies. No missing values were imputed and no published source counts were altered.
Descriptive analysis
Counts and proportions were summarised for all outcomes. Annual positivity, overall weighted positivity, classification shares, and pooled-pattern proportions were presented descriptively with explicit numerators and denominators.
Changes in reported classification composition were described using the separate H5, H9, and HxNx counts and percentages for 2020, 2022, and 2023. No significance testing was used to infer subtype replacement.
The pooled dataset was analysed primarily through counts and proportions. The principal derived indicators were any AI or ND detection, any AI detection, H5-containing patterns, H9-containing patterns, ND-containing patterns, and single-, two-, three-, and multi-marker patterns. Marker-specific indicators were descriptive and intentionally overlapped when a pool contained more than one reported marker; therefore, they were not summed to estimate an overall burden.
Calculations were implemented in a transparent Microsoft Excel workbook using formula-based recalculation and internal consistency checks against the published counts.
Analytical scope
No regression, time-series forecasting, incidence estimation, or causal risk-factor modelling was conducted. Only four aggregated annual observations were available, and market-, species-, specimen-, and date-level outcomes were not consistently reported. Accordingly, the analysis describes observed surveillance-sample patterns rather than a monotonic epidemiological trend, population-level prevalence, or the effect of market practices. Pool-level multi-marker detection indicates that markers occurred within the same pooled sample but cannot identify whether they occurred in the same bird.
Ethical considerations
The study used aggregated, publicly available secondary data. It involved no new animal sampling, animal experimentation, human participants, or identifiable private information. Formal ethical approval was therefore not required. The original surveillance sources were acknowledged, and all analytical changes were limited to transparent recalculation, harmonisation, and descriptive comparison and consistency checking of published counts. No source counts were altered.
RESULTS
Annual AI type A surveillance positivity
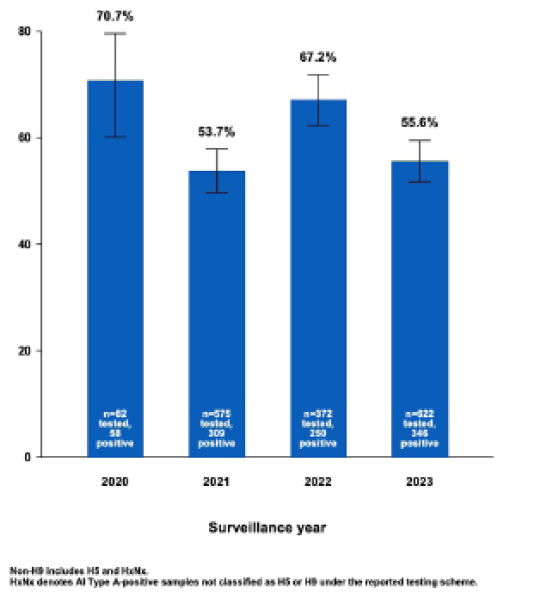
Across the four surveillance years, 963 of 1,651 tested samples were positive for AI Type A, corresponding to an overall weighted surveillance positivity of 58.3%. Annual positivity remained above 50%, ranging from 53.7% in 2021 to 70.7% in 2020 (Table 1; Figure 2A). Positivity was 67.2% in 2022 and 55.6% in 2023.
Table 1: Annual avian influenza type a surveillance positivity in padang live bird markets, 2020–2023.
Year
Tested, n
AI Type A positive, n
Negative, n
Surveillance positivity, %
2020
82
58
24
70.7
2021
575
309
266
53.7
2022
372
250
122
67.2
2023
622
346
276
55.6
Overall
1,651
963
688
58.3
Note. Surveillance positivity was calculated from the reported number of AI Type A-positive samples divided by the number tested in each surveillance year. The overall value is the weighted proportion, calculated as 963/1,651. Because surveillance was risk-based, these percentages describe tested surveillance samples and should not be interpreted as market- or population-level prevalence.
The annual pattern therefore indicated recurrent AI Type A detection among tested surveillance samples, with variation between reporting years but no consistent increasing or decreasing pattern.
Reported H5, H9, and HxNx classifications
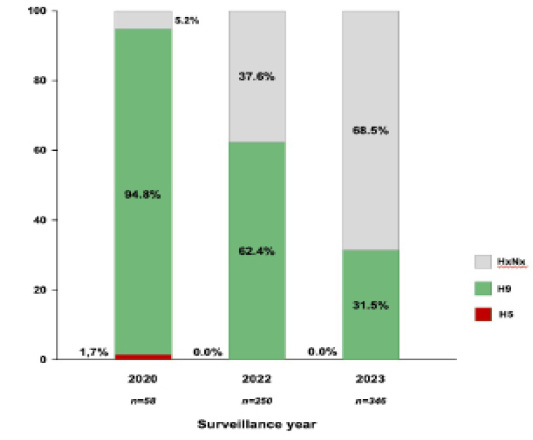
Classification results were available for all reported AI Type A-positive samples in 2020 (58/58), 2022 (250/250), and 2023 (346/346); H5, H9, and HxNx follow-up classification was not performed in 2021. Among AI Type A-positive samples with available classification results, the H9 proportion declined from 94.8% in 2020 to 31.5% in 2023, with an intermediate value of 62.4% in 2022. In contrast, the source-reported HxNx share increased from 3.4% in 2020 to 37.6% in 2022 and 68.5% in 2023 (Table 2; Figure 2B). One sample in 2020 was reported as H5 (1.7%), while no H5-classified samples were reported in 2022 or 2023.
Table 2: Reported H5, H9, and HxNx classification among AI type A-positive samples with available classification results.
Year
Classified positives, n
H5, n (%)
H9, n (%)
HxNx, n (%)
2020
58
1 (1.7)
55 (94.8)
2 (3.4)
2022
250
0 (0.0)
156 (62.4)
94 (37.6)
2023
346
0 (0.0)
109 (31.5)
237 (68.5)
Note. Classification results were available for 2020, 2022, and 2023. In 2021, only AI Type A detection was conducted and H5/H9/HxNx follow-up classification was not performed. The source term HxNx is retained for traceability and represents AI Type A-positive material not reported as H5 or H9 under the published testing scheme; it is not treated as a single confirmed molecular subtype.
These results indicate a marked change in the reported classification profile but do not identify the subtype or subtypes represented by HxNx.
Pooled AI and ND marker-detection patterns
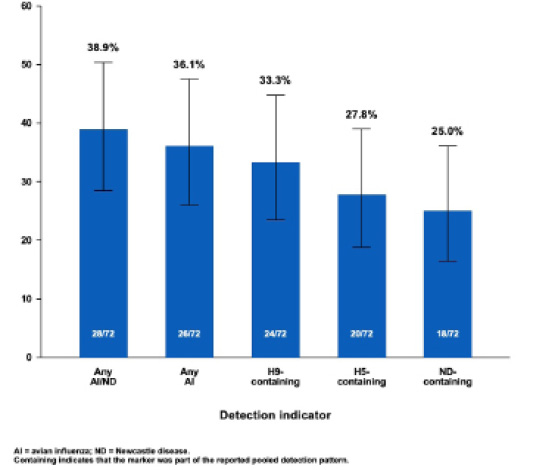
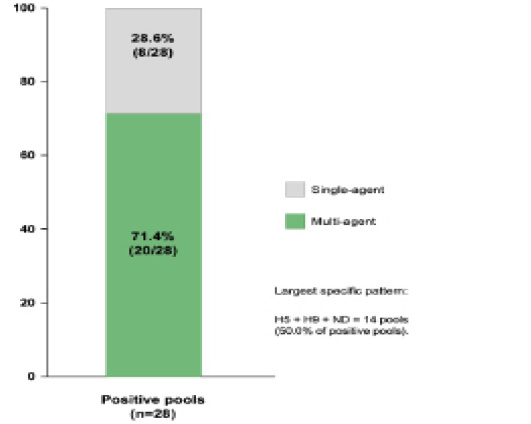
In the separate September 2023 dataset, 28 of 72 pools contained at least one reported AI or ND marker, corresponding to 38.9% of all pools (Table 3; Figure 3A). Among the 28 positive pools, 20 contained two or three reported markers (71.4%). The largest specific pattern was the combined H5, H9, and ND pattern, reported in 14 pools (19.4% of all pools) (Figure 3B).
All percentages in this analysis refer to the 72 pooled samples rather than the 317 poultry or environmental sampling units represented by those pools. Individual-level positivity could not be estimated from the published aggregated pool data. The count-based estimate of 38.9% was used because the reported categories summed consistently to 28 positive and 44 negative pools, whereas the source narrative stated 49%. The corresponding negative proportion was 44/72 (61.1%), supporting the count-based value. The 49% statement was therefore retained only as a source-data inconsistency.
DISCUSSION
This study shows what can be extracted, checked, and interpreted from routinely published live bird market surveillance reports while also identifying where differences in sampling and reporting limit epidemiological interpretation. The Padang reports showed recurrent AI Type A detection, a marked change in the reported H5/H9/HxNx classification composition, and pool-level AI and ND marker patterns. The reanalysis also identified an internal inconsistency in the published pooled-data summary. However, differences in sampling structure, diagnostic reporting, and data aggregation limited direct comparison across surveillance activities. The annual and pooled datasets were therefore interpreted separately rather than as a single longitudinal dataset. These findings support continued live bird market surveillance while illustrating the limits of inference from aggregated risk-based data.
Table 3: Pool-level avian influenza and Newcastle disease marker-detection patterns in September 2023.
Reported pool-level pattern
Pools, n
Share of 72 pools, %
Negative for all reported AI/ND markers
44
61.1
ND only
2
2.8
AI H9 only
6
8.3
AI H5 only
0
0.0
AI H5 + AI H9
4
5.6
AI H5 + ND
2
2.8
AI H9 + ND
0
0.0
AI H5 + AI H9 + ND
14
19.4
Total
72
100.0
Note. The unit of analysis is the pool (n = 72), not the 317 poultry or environmental sampling units represented by those pools. At least one AI or ND marker was reported in 28/72 pools (38.9%), and 20/28 positive pools (71.4%) contained two or three reported markers. Marker detection within the same pool does not establish individual-bird co-infection. The source narrative also reported 49% positivity, but the published category counts and 44 negative pools support the count-based value of 38.9%; this discrepancy should be reported as a source-data limitation.
The annual results indicate recurrent AI Type A detection rather than a consistent temporal trend. Surveillance positivity remained above 50% in all four reporting years. Because surveillance effort was not fixed and host- and specimen-specific annual denominators were not consistently available, the observed annual variation cannot be separated from changes in surveillance composition or underlying virus circulation. The detectability of avian influenza in live bird markets can vary according to specimen type, sampling frequency, and pooling strategy ; . Long-term market surveillance has also shown that influenza viruses may be repeatedly detected even when detection patterns vary across time and sampling settings . Because these surveillance characteristics were not consistently reported in the Padang records, their contribution to the observed annual variation could not be determined.
The most pronounced change in the annual classification data was observed in the reported H5/H9/HxNx composition. H9 accounted for most AI Type A-positive samples with classification data in 2020 but less than one-third in 2023, while the source-reported HxNx share increased from 3.4% to 68.5%. In each year in which H5/H9/HxNx classification was performed, the reported classification counts accounted for all AI Type A-positive samples; however, this follow-up classification was not performed in 2021.
In the Padang reports, HxNx represented an unresolved classification rather than a molecularly identified subtype. The available reports do not allow the reason for the increase in HxNx to be determined. The Padang findings should therefore be interpreted as a change in the reported classification composition, not as a confirmed replacement of H9 by another subtype. Broader subtype testing or sequencing of selected unresolved AI-positive samples, where feasible, would be required to identify the viruses represented by the HxNx category.
The pooled dataset provided a separate view of AI and ND marker detection. Most positive pools contained two or three reported markers, and the combined H5, H9, and ND pattern was the largest category. Pooling is commonly used to improve surveillance efficiency when material is collected from several birds or sampling sites . However, detection of AI and ND markers in the same pool does not demonstrate that both viruses occurred in the same bird. The present findings should therefore be interpreted as pool-level multi-marker patterns rather than evidence of individual-bird co-infection. The presence of H5-containing patterns in this separate September 2023 activity should not be directly contrasted with the absence of H5-classified samples in the annual 2023 dataset because the two reports differed in surveillance activity, sampling unit, pooling structure, and laboratory reporting. They therefore do not form a single H5 time series.
Implications for surveillance and market control
The findings indicate that live bird market surveillance would benefit from greater consistency across surveillance activities. Annual comparisons would be more informative if markets, sampling periods, specimen types, pooling procedures, and diagnostic algorithms were maintained consistently or clearly documented. AI Type A-positive samples that remain unresolved after H5 and H9 testing should receive broader subtype characterisation. Where resources permit, sequencing a selected subset of what is represented by the HxNx category. The internal difference between the published 49% narrative value and the count-derived 38.9% pooled detection value also shows why numerators, denominators, and pattern counts should be reported and checked together.
Surveillance reports should clearly present the sampling unit, numerator, denominator, pool composition, specimen type, sampling date, market identifier, and diagnostic method. These details would make reported proportions easier to verify and would allow future analyses to compare results by market, species, sampling period, and source area. For Padang markets, repeated detections can support targeted hygiene follow-up at slaughtering and high-throughput market points, while recording poultry origin and supplier information would strengthen traceback after positive findings ; ; ; ; . These actions should be treated as surveillance-informed priorities rather than intervention effects demonstrated by the Padang dataset.
Study limitations
This study was limited by the structure of the published surveillance data. The original surveillance was risk-based rather than probability-based, so the observed positivity cannot be interpreted as market- or population-level prevalence. Sampling characteristics were not consistently reported across years, subtype classification was unavailable for 2021, and the pooled 2023 data did not permit individual-bird inference. Annual host- and specimen-specific denominators were also not consistently available, and surveillance effort varied between reporting periods. These limitations constrain direct temporal and epidemiological comparisons and highlight the need for consistent sampling and diagnostic documentation in future live bird market surveillance. They define the level of inference rather than make the published surveillance counts unusable. The data remain suitable for descriptive reanalysis, internal consistency checking, and identifying the reporting elements needed for stronger future epidemiological interpretation.
CONCLUSION
Official surveillance reports from Padang live bird markets showed recurrent AI Type A-positive results during 2020–2023, with positive samples reported in every surveillance year and positivity among tested samples remaining above 50%. Among the years with follow-up classification, the reported H9 share declined from 94.8% in 2020 to 31.5% in 2023, while the unresolved HxNx category increased from 3.4% to 68.5%. The available reports do not allow this change to be attributed to either viral population change or differences in surveillance and testing. A separate September 2023 pooled activity additionally documented AI and Newcastle disease marker patterns at the pool level and was interpreted independently of the annual series. The main contribution of this reanalysis is therefore to define what the published surveillance counts can reliably show and where reporting structure limits stronger epidemiological interpretation. For Padang, the findings support continued market surveillance, broader characterisation and selected sequencing of unresolved AI-positive samples where feasible, and more consistent documentation of numerators, denominators, pool composition, sampling procedures, and poultry origin to improve verification and traceback.
ACKNOWLEDGEMENTS
The authors acknowledge Balai Veteriner Bukittinggi for making the official veterinary surveillance bulletins publicly available. The interpretations and conclusions in this manuscript are those of the authors.
NOVELTY STATEMENT
This study descriptively reanalyses two differently structured official surveillance reports from Padang live bird markets while retaining their distinct sampling units and reporting structures. It reconstructs explicit numerators and denominators, documents the marked change in reported H5/H9/HxNx classification composition, and identifies an internal inconsistency in the pooled-data summary. HxNx is interpreted as an unresolved source classification rather than evidence of confirmed subtype replacement.
AUTHOR’S CONTRIBUTION
HA: Conceptualisation, methodology, data curation, formal analysis, visualisation, project administration, and writing—original draft. FDSF: Data extraction, validation, investigation, and writing—review and editing. KBA: Methodological review, validation, interpretation of findings, and writing—review and editing. WF: Data extraction, validation, investigation, and writing—review and editing. TL: Validation, interpretation of findings, and writing—review and editing. HMM: Methodological review, validation, and interpretation of findings, All authors read and approved the final manuscript.
Funding
This research received no specific grant from any funding agency in the public, commercial, or not-for-profit sectors.
Generative AI and AI assisted technology statement
The authors declare that no generative AI and AI assisted technology was used in the creation of this manuscript.
Conflict of interest
The authors have declared no conflict of interest.
Figures
Figure 1:.
Locations of the 12 traditional live bird markets included in the surveillance analysis in Padang City, West Sumatra, Indonesia. Numbered markers indicate: (1) Pasar Raya Padang, (2) Pasar Nanggalo, (3) Pasar Alai, (4) Pasar Belimbing, (5) Pasar Lubuk Buaya, (6) Pasar Simpang Haru, (7) Pasar Tanah Kongsi, (8) Pasar Bandar Buat, (9) Pasar Ulak Karang, (10) Pasar Pagi Purus, (11) Pasar Pagi Gaung, and (12) Pasar Pagi Parak Laweh.
Figure 2A:.
Annual AI type a survellance positivity.
Figure 2B:.
Reported H5, H9 and HxNx classifications among Al Type A-positive samples.
Figure 3A:.
Marker-detection rates among 72 pooled samples.
Figure 3B:.
Detection-pattern complexity among 28 positive pools.
References
Balai Veteriner Bukittinggi (2024a). Buletin informasi kesehatan hewan (Vol. 26, No. 108).
Balai Veteriner Bukittinggi (2024b). Buletin informasi kesehatan hewan (Vol. 26, No. 109).
Basuno E, Yusdja Y, Ilham N (2010). Socio-economic impacts of avian influenza outbreaks on small-scale producers in Indonesia. Transboundary Emerg. Dis., 57(1–2): 7–10. https://doi.org/10.1111/j.1865-1682.2010.01121.x[CrossRef]
Chaka H, Goutard F, Gil P, Abolnik C, Servan de Almeida R, Bisschop S, Thompson PN (2013). Serological and molecular investigation of Newcastle disease in household chicken flocks and associated markets in Eastern Shewa zone, Ethiopia. Trop. Anim. Health Prod., 45(3): 705–714. https://doi.org/10.1007/s11250-012-0278-y[CrossRef]
Chowdhury S, Azziz-Baumgartner E, Kile JC, Hoque MA, Rahman MZ, Hossain ME, Ghosh PK, Ahmed SSU, Kennedy ED, Nahar N, Rahman M, Islam A, Gurley ES (2020). Association of biosecurity and hygiene practices with environmental contamination with influenza A viruses in live bird markets, Bangladesh. Emerg. Infect. Dis., 26(9): 2087–2096. https://doi.org/10.3201/eid2609.191029[CrossRef]
Dharmayanti NLPI, Hewajuli DA, Ratnawati A, Hartawan R (2020). Genetic diversity of the H5N1 viruses in live bird markets, Indonesia. J. Vet. Sci., 21(4): e56. https://doi.org/10.4142/jvs.2020.21.e56[CrossRef]
Dharmayanti NLPI, Nurjanah D, Nuradji H, Suyatno T, Indriani R (2024). Newcastle disease virus: The past and current situation in Indonesia. J. Vet. Sci., 25(1): e3. https://doi.org/10.4142/jvs.23022[CrossRef]
Henning J, Hesterberg UW, Zenal F, Schoonman L, Brum E, McGrane J (2019). Risk factors for H5 avian influenza virus prevalence on urban live bird markets in Jakarta, Indonesia: Evaluation of long-term environmental surveillance data. PLOS ONE, 14, Article e0216984. https://doi.org/10.1371/journal.pone.0216984[CrossRef]
Hood G, Roche X, Brioudes A, von Dobschuetz S, Fasina FO, Kalpravidh W, Makonnen Y, Lubroth J, Sims L (2021). A literature review of the use of environmental sampling in the surveillance of avian influenza viruses. Transboundary Emerg. Dis., 68(1): 110–126. https://doi.org/10.1111/tbed.13633[CrossRef]
Humblet M-F, Vandeputte S, Mignot C, Bellet C, de Koeijer AA, Swanenburg M, Afonso A, Sanaa M, Saegerman C (2016). How to assess data availability, accessibility and format for risk analysis? Transboundary Emerg. Dis., 63(6): e173–e186. https://doi.org/10.1111/tbed.12328[CrossRef]
Indriani R, Samaan G, Gultom A, Loth L, Irianti S, Indryani S, Adjid R, Dharmayanti NLPI, Weaver J, Mumford E, Lokuge K, Kelly PM, Darminto (2010). Environmental sampling for avian influenza virus A (H5N1) in live-bird markets, Indonesia. Emerg. Infect. Dis., 16(12): 1889–1895. https://doi.org/10.3201/eid1612.100402[CrossRef]
Khan SU, Gurley ES, Gerloff N, Rahman MZ, Simpson N, Rahman M, Haider N, Chowdhury S, Balish A, Uz Zaman R, Nasreen S, Das BC, Azziz-Baumgartner E, Sturm-Ramirez K, Davis CT, Donis RO, Luby SP (2018). Avian influenza surveillance in domestic waterfowl and environment of live bird markets in Bangladesh, 2007–2012. Sci. Rep., 8, Article 9396. https://doi.org/10.1038/s41598-018-27515-w[CrossRef]
Kurscheid J, Stevenson M, Durr PA, Toribio JALML, Kurscheid S, Ambarawati IGAA, Abdurrahman M, Fenwick S (2017). Social network analysis of the movement of poultry to and from live bird markets in Bali and Lombok, Indonesia. Transboundary Emerg. Dis., 64(6): 2023–2033.
Molia S, Boly IA, Duboz R, Coulibaly B, Guitian J, Grosbois V, Fournié G, Pfeiffer DU (2016). Live bird markets characterization and trading network analysis in Mali: Implications for the surveillance and control of avian influenza and Newcastle disease. Acta Trop., 155, 77–88. https://doi.org/10.1016/j.actatropica.2015.12.003[CrossRef]
Rehman S, Effendi MH, Witaningrum AM, Nnabuike UE, Bilal M, Abbas A, Abbas RZ, Hussain K (2023). Avian influenza (H5N1) virus, epidemiology and its effects on backyard poultry in Indonesia: A review. F1000 Res., 11, Article 1321. https://doi.org/10.12688/f1000research.125878.2[CrossRef]
Samaan G, Gultom A, Indriani R, Lokuge K, Kelly PM (2011). Critical control points for avian influenza A H5N1 in live bird markets in low resource settings. Prev. Vet. Med., 100(1): 71–78. https://doi.org/10.1016/j.prevetmed.2011.03.003[CrossRef]
Stärk KDC, Regula G, Hernandez J, Knopf L, Fuchs K, Morris RS, Davies P (2006). Concepts for risk-based surveillance in the field of veterinary medicine and veterinary public health: Review of current approaches. BMC Health Serv. Res., 6, Article 20. https://doi.org/10.1186/1472-6963-6-20[CrossRef]
Vergne T, Meyer A, Long PT, Elkholly DA, Inui K, Padungtod P, Newman SH, Fournié G, Pfeiffer DU (2019). Optimising the detectability of H5N1 and H5N6 highly pathogenic avian influenza viruses in Vietnamese live-bird markets. Sci. Rep., 9, Article 1031. https://doi.org/10.1038/s41598-018-37616-1[CrossRef]
Williams MS, Ebel ED, Wells SJ (2009). Poisson sampling: A sampling strategy for concurrently establishing freedom from disease and estimating population characteristics. Prev. Vet. Med., 89(1–2): 34–42. https://doi.org/10.1016/j.prevetmed.2009.01.005[CrossRef]
Zhou X, Wang Y, Liu H, Guo F, Doi SAR, Smith C, Soares Magalhães RJ (2018). Effectiveness of market-level biosecurity at reducing exposure of poultry and humans to avian influenza: A systematic review and meta-analysis. J. Infect. Dis., 218(12): 1861–1875. https://doi.org/10.1093/infdis/jiy400[CrossRef]