Advances in Animal and Veterinary Sciences
Research Article
Validation of a High Performance Liquid Chromatography (HPLC) Method for the Determination of Oxytetracycline Residues in Milk
Latifa Boultif1, Noreddine Zeghilet2, Bassem Chebira1, Amir Agabou1, Abdesselam Mekroud1
1PADESCA Laboratory, institute of Veterinary science, University of Constantine 1, Algeria; 2GSPA Laboratory, institute of Veterinary science, University of Constantine 1, Algeria.
Abstract | Tetracyclines are antibacterial agents widely used in preventing and treating infectious diseases in food producing animals. This extensive use can lead to an increase in their residues levels in food of animal origins. These residues will pass through the food chain to the consumers. In addition, the residues in milk may have many consequences on consumers’ health: allergic reactions in human’s antibiotics give rise to an increase in the antibiotic resistance of pathogenic bacteria, which may result in direct toxity, allergy and resistance to antibiotics. In this way, authors look to detect and quantify Oxytetracycline residues in milk by High Performance Liquid Chromatography (HPLC). They have, at first, proceeded to the optimization of various analysis parameters [stationary phase, mobile phase, absorption spectrum (wavelengths), flow rate and injected volume], then they have continued with their validation using adequate statistical analysis methods (Repetitiveness reproducibility, Linearity of the calibration curve) and the adaptation of an extraction technique of this antibiotic from cow’s milk. The results of the validation process led to the adaptation of following parameters: Sample concentration: 0, 4 mg/mL (diluted in methanol), stationary phase: column C18 reversed phase (Grafted silica gel), mobile phase: acetonitrile, injected volume: 11 µl, wavelength (UV detector): 325 nm and flow rate: 1, 5 mL/min. The drug was extracted with mixture acetonitrile/HPLC water and simply cleaned up on Whatman filter, then on a nylon membrane filter of 45 µm/ 47 mm.
Keywords | Oxytetracycline, Residues, Milk, HPLC
Editor | Kuldeep Dhama, Indian Veterinary Research Institute, Uttar Pradesh, India.
Received | October 10, 2014; Revised | November 08, 2014; Accepted | November 09, 2014; Published | November 16, 2014
*Correspondence | Latifa Boultif, University of Constantine 1, Algeria; Email: boultiflatifa@hotmail.fr
Citation | Boultif L, Zeghilet N, Chebira B, Agabou A, Mekroud A (2014). Validation of a high performance liquid Chromatography (hplc) method for the determination of oxytetracycline residues in milk. Adv. Anim. Vet. Sci. 2 (10): 574-581.
DOI |http://dx.doi.org/10.14737/journal.aavs/2014/2.10.574.581
ISSN (Online) |2307-8316; ISSN (Print) | 2309-3331
Copyright © 2014 Boultif et al. This is an open access article distributed under the Creative Commons Attribution License, which permits unrestricted use, distribution, and reproduction in any medium, provided the original work is properly cited.
INTRODUCTION
Milk is an important inexpensive dietary source. It contains valuable proteins and calcium essential for promoting growth in children and general health of the population. In Algeria, milk is considered as the principal source of animal proteins (Amellal, 1995).
Tetracyclines produced by Streptomyces spp. are broad spectrum antibiotics active against most Gram-positive and Gram-negative bacteria (Oka et al., 1995). In Algeria, they are used prophylactically and therapeutically in dairy cattle and other domestic animals. However the misuse of these molecules conducts to the presence of their residues in food of animal origin (Wangfuengkanagul et al., 2004).
Antibiotics residues have a negative impact on consumers’ health and food processing industries. Indeed, the presence of antibiotics residues may harm to the consumers’ health through direct toxicity (Guy et al., 2004; Leroy and Fanir, 2005), allergic reactions (Federicci-Mathieu, 2000), carcinogenic processes, pathologies related to the modification of intestinal flora (Broutin et al., 2005; Châtaigner and Stevens, 2005; Fabre and Joyes, 2000), increase of the selection pressure and spread of drug resistant bacteria within animals and human populations (Châtaigner and Stevens, 2005; Sanders, 2005). For food processing industry, the spoil concerns notably manufacturing of fermented products (Brouillet, 2002; Form, 2003; Maghuin-Rogister et al., 2001). In fact, the lactic bacteria being sensitive to very low concentrations of antibiotics (Brouillet, 2002; Fabre and Joyes, 2000), the presence of their residues inhibit partially or totally the growth of these ferments and results in many defects (Robb, 2006; Vera, 2005) including accidents in cheese manufacturing, yogurt and other fermented milk products (Broutin et al., 2005; Ryckaert et al., 2003; Zinedine et al., 2007).
In this context, methods must be developed for the monitoring of antibiotics residues notably in milk. For that two sorts of tests are used: microbiological tests (screening methods) and physicochemical tests (confirmation methods) (Fergusson et al., 2002). Among this last kink of analyses, High Performance Liquid Chromatography (HPLC) is recognized as a powerful method for the quantitative analysis of antibiotics residues in milk (Oliveira et al., 2006; Reig and Toldra, 2008). It has several merits; it detects very small amounts of these residues, it presents an extreme sensitiveness and it possesses a great strength of separation and an excellent reproducibility.
This work has for principal objective: the detection and the quantification by High Performance Liquid Chromatography of oxytetracycline residues in milk. We optimize various analysis parameters [stationary phase, mobile phase, absorption spectrum (wavelengths), flow rate and injected volume] and the adaptation of an extraction method.
Oxytetracycline has been chosen because of its large use in veterinary medicine in Algeria, notably in the treatment of respiratory infections. This antibiotic is also directly implicated in the appearance of dairy industry spoils.
MATERIAL AND METHOD
Instrumentation
HPLC Shimadzu corporate Body device consists of : a column (type VP-ODS 250 L*40, filled with grafted silica gel: column C18 in reversed phase), two pumps (models LC-10 ATvp, pumps 1 reference S/N: C20974009859J2, pump 2 references S/N: C21014009440CD), two UV detectors (models SPD-10Avp/10AVvp equipped of a Deuterium lamp, absorption spectrum (UV detector) 190 to 350 nm, reference S/N: C21004001496LP), a gas cleaner: (Models DGU-20A5 reference S/N: L20244301983CR), a control system or integrator (models SCL-10 AVP, reference S/N: C21014009440CD), an injection loop, two reservoirs of mobile phase and a plastic piping allowing the progression of the liquid phase in the different compartments of the device. The other equipment consist of a centrifuge, a filtrating device, cold chamber, analytical scale and HPLC special injection syringes (capacity 20 and 50 µL, reference C 670-12554-03).
Reagents
Methanol ultra-residue of analytical grade (Sigma-Aldrich, Ref. 5363C), Acetonitrile (Biochem. Chemopharma, Ref. 6235A.) and water HPLC rank (Sigma-Aldrich, Ref. 34877).
Liquid chromatography solvents were filtered with 0.45µm Teflon and Nylon membranes before used. Purified samples were filtered through 13mm, 0.45µm Nylon filters (Supelco, Ref. 58067).
Standards and Work Solutions
Standard stock solution was prepared by diluting Oxytetracycline hydrochloride (Sigma-Aldrich. Veteranal Ref. 46598) in methanol (4 mg/mL).
The working solutions were prepared daily by appropriately diluting the stock solutions with mobile phase and stored in amber flask at 4°C until use.
Sampling
Milk sample was collected at a farm located in Constantine (North-East Algeria). The milk simple is presumed exempt from antibiotics. The collected sample (200 ml) was conveyed quickly in an isothermal tray to the laboratory where it was stored at 4°C.
Optimization of Analysis Parameters
In order to detect and to quantify the oxytetracycline residues in the milk by HPLC, it was necessary to start at first with the optimization of the analysis parameters namely: stationary phase, mobile phase, absorption spectrum (wavelengths), flows rate, injection volume. This step necessitated more than seven hundred essays.
Examination of the Method’s Reliability
Repetitiveness
Repetitiveness consists of realizing the technique by the same team at the same laboratory. The essay results must be obtained by the same operator following the same procedure, using the same equipment and during a current interval of time (According to ISO 3534-1 and ISO 5725-1 standards). To test the Repetitiveness of our obtained results, we carried out three series of 6 essays, on the same day, with the same solution of work, the same operator, the same place, the same equipment and with the same analysis conditions.
Reproducibility
In this case, the essays are realized in different conditions. At least one of the following parameters is voluntarily modified: operator, device, solution setting, and differed realizations in time (According to ISO 3534-1 and ISO 5725-1 standards). To achieve this, two different operators carried out three series of twenty essays each, with three different work solutions (one for every series) and in few days apart.
Linearity of the Calibration Curve
The linearity of the variation of the heights peaks area (surfaces) according to the variation of the concentrations of the injected product must be verified for every composite. The correlation coefficients between heights of the peaks and concentrations, as well as the parameters of the corresponding lines of linear regression must be calculated (ISO 3534-1, ISO 5725-1). To establish the curve linearity and to determine the regression line for the oxytetracycline, we used different on day prepared dilutions: 1/1, 1/2, 1/4, 1/8, 1/16.
Statistics Study
Repeatability Calculation
We realized an average comparison according to Student‘s test. We calculated the average, the standard deviation and the variance from the obtained surfaces to calculate the value of “t” and to compare it with Student’s values at the respective risks of 1% and 5%.
The “t” is measured between every two series (a and b, a and c, b and c) according to the following formula:
t = |Xa - Xb|/√ σ²/Na + σ²/Nb
Xa being the average of the first series (series a)
Xb being the average of the second series (series b)
σ² being the variance between the two series a and b
Na being the number of the repetitions of the series a
Nb being the number of the repetitions of the series b
If ‘’t’’ is inferior to student’s values, the difference between the two series is not significant that means that our method is repeatable or reproducible.
If the calculated ‘’t’’ is superior to student’s values, the difference between the series is significant and our method is not reliable.
Reproducibility Calculation
The same preceding formula (test of Student) is applied on the obtained surfaces in every series.
Extraction method
The second section of our study consists in the adaptation of an extraction method of oxytetracycline in milkin this way, we adopted a technique from different recommended methods (Diaz et al., 2007; Helio et al., 2007). This method is based on the following steps: 10 ml of milk are mixed with 20 ml of acétonitrile and 6 ml of HPLC water. The mixture is divided up into four tubes, which are homogenized in the vortex for 1 minute then centrifuged at 6000 rpm for 10 min. Next, the supernatants (aqueous portions) are collected, filtered using Whatman filters. Then 20 ml of acetonitrile are added to the filtrate, the mixture is divided again into 4 new tubes, which are vortexed during 1 min and centrifuged for the second time at 3000 rpm for 5 min. Finally, the aqueous portions are harvested and filtered two times: firstly with a Whatman filter, then with a nylon membrane filter of 45 µm/ 47 mm. This method was applied on a milk sample presumed exempt of antibiotics. A half of the sample quantity was doped with the oxytetracycline standard and the remaining half was used as a control.
RESULTS AND DISCUSSION
Withheld Parameters
Our experimental investigations allowed keeping following HPLC analysis parameters: Sample conce tration: 0, 4 mg/mL (diluted in methanol), stationary phase: column C18 reversed phase (Grafted silicagel), mobile phase: acetonitrile, injected volume: 11 µl, wavelength (UV detector): 325 nm, flow rate: 1, 5 mL/min and analysis time: 8 min.
The isocratic mode (single mobile phase) was applied during all the experimentation. Various compositions can be used: Wang et al. (2004), Reed et al. (2004); Cinquina et al. (2003) used a mobile phase composed by a combination of acétonitrile and methanol, while for Wan et al. (2013), the mobile phase consisted of acetonitrile and water containing 0.1% formic acid.
Concerning the absorption spectrum, different wavelengths are used. Fritz and Zuo (2007) chose a wavelength of 365 nm, Coyne et al. (2004) used 353 nm, Reed et al. (2004) used 350 nm and Furusawa (2003) used 357 nm.
The flow rate affects the retention time. The increase of flow rate decreases the retention time and vice versa. In many studies a flow rate of 1 ml/min was used (Wang et al., 2004; Cinquina et al., 2003), while in others the chosen flow rate was 1.2 mL/min (Reed et al., 2004).
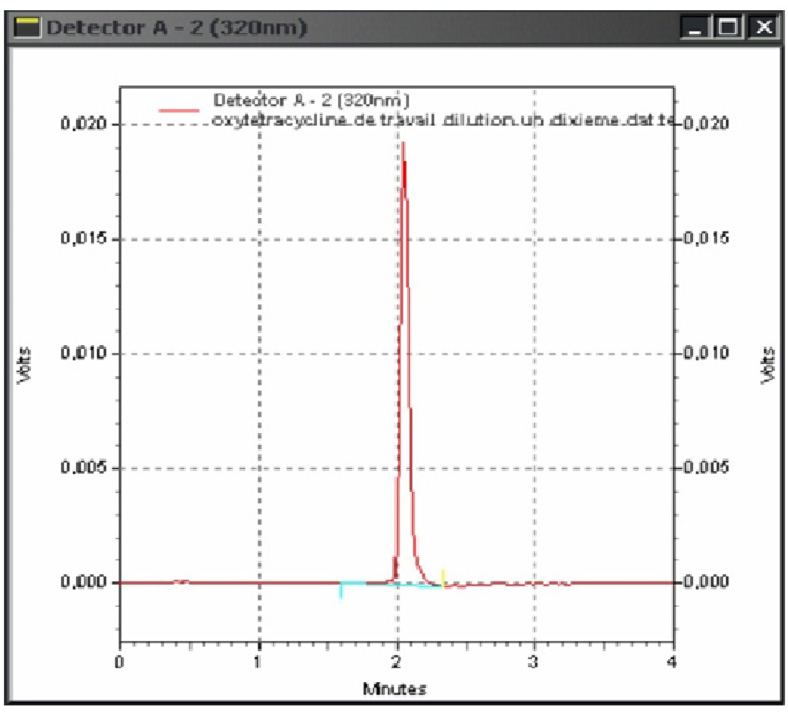
The figure 1 given below shows the obtained chromatogram while using the withheld parameters, the retention time of the oxytetracycline is 2.15 min. With other parameters this retention time can change, so for Spisso et al. (2009) the retention time is 10.80 min. It is 6.13 min for Fritz and Zuo (2007), 4.63 min for Koesukwiwat et al. (2007) and 4.54 min for Zhu et al. (2001).
Reliability examination of the withheld parameters
The repeatability
The obtained results (Table 1), expressed in peak’s area, are subjected to the Student statistical test. The verification of the Repetitiveness is done comparing the series two by two. After statistical analysis, it is proven that there is no significant difference between the three series. The “t” in the three cases (table 1) is inferior to the student’s values (at the risks of 1% = 4.6 and at 5% = 2.78). That means that the analysis method is repeatable in the conditions of required analysis.
The reproducibility
The peaks areas (Table 2) are subjected to the statistical tests of Student. As for the repeatability, it was necessary to compare the series two by two. We also noticed that there is no significant difference between the three series. Calculated “t” is inferior to Student’s values which confirms that the method is reproducible in our analysis conditions.
The Linearity of the Calibration Curvwe
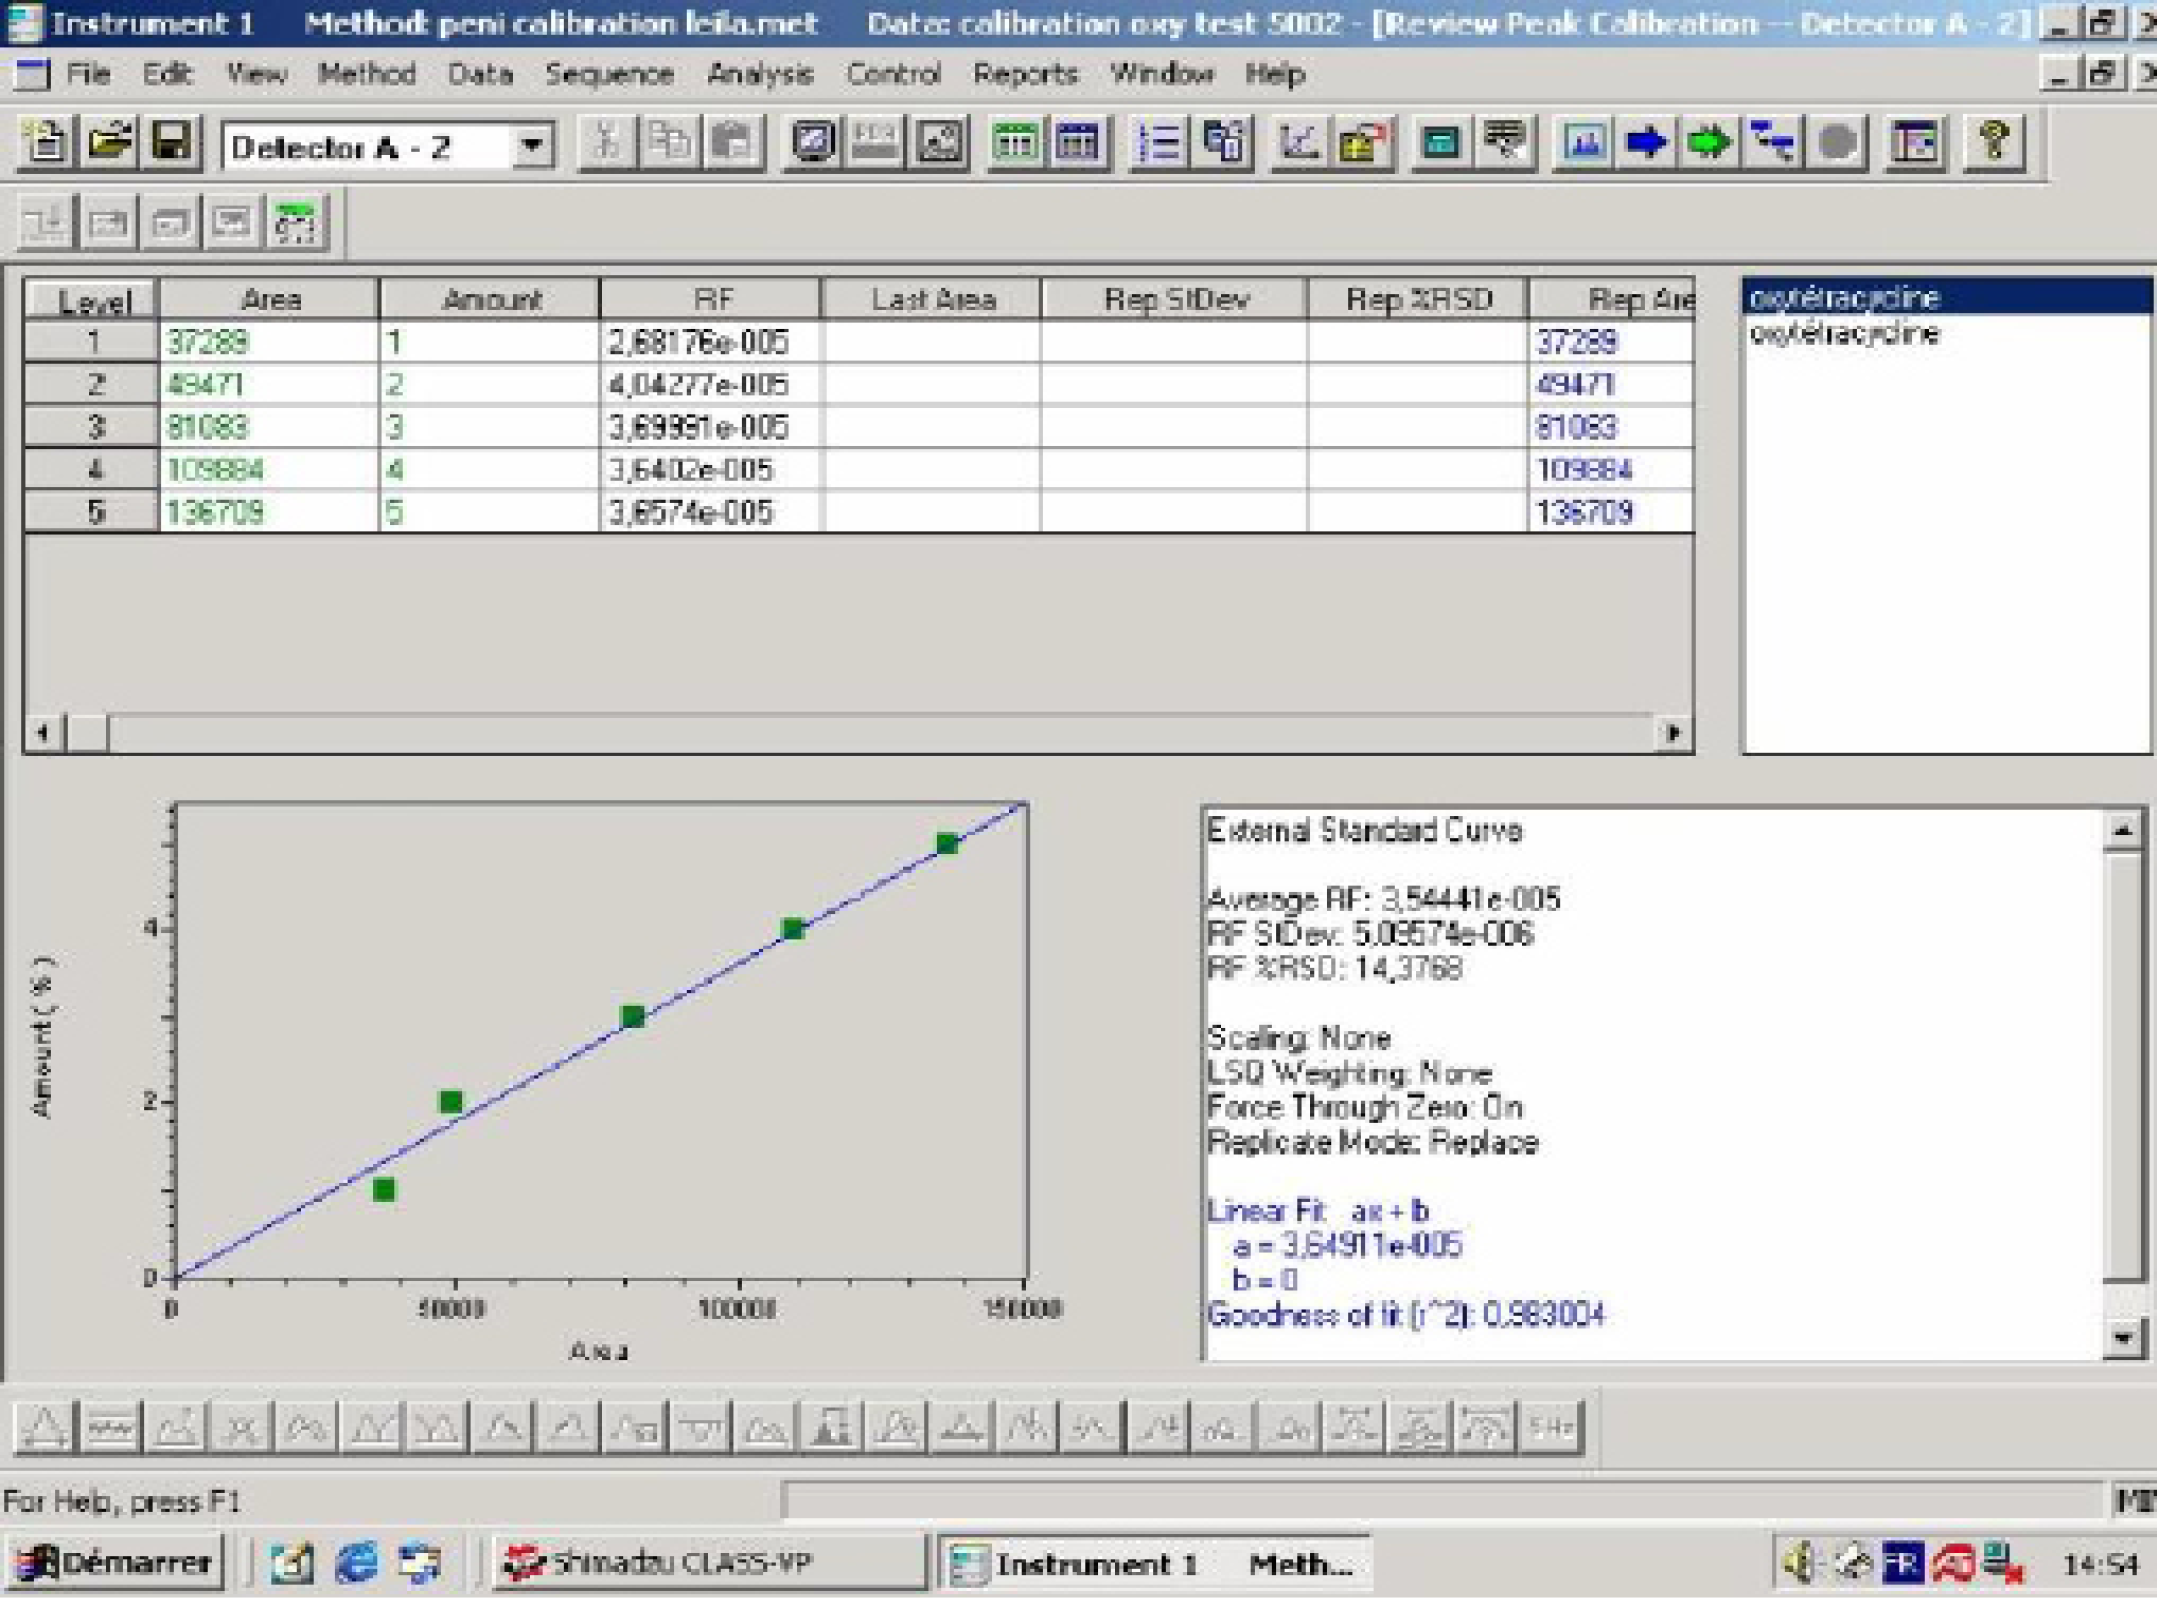
The calibration curve represented in figure 2 is demonstrative. The correlation coefficient is equal to 0.9830.
This stage is described in many works as in Koesukwiwat et al. (2007), who reports to have used external standard calibration method. Where the average values were used to constructed calibration curves by plotting the corresponding peak area with analyte concentration. The same operation is made by Sun et al., (2009); Pinar, (2007); Cinquina, (2003).
Table 1: Statistical results of repeatability p: 6
|
Series a (n=6) |
Series b (n=6) |
Series c (n=6) |
||
|
Average |
46134,2 |
45051,3 |
45982,0 |
|
|
Standard deviation |
2557,08 |
2748,77 |
2810,47 |
|
|
Coefficient of variance |
7231525494 |
3317104972 |
3285151967 |
|
|
Calculated t |
t (a & b)= 0.72 |
t (b & c)= 0.68 |
||
|
t (a&c)= 0.39 |
||||
Table 2: Statistical results of reproducibility p: 6
|
Series A (n=20) |
Series B (n=20) |
Series C (n=20) |
||
|
Average |
41873,8 |
41468,9 |
42206,7 |
|
|
Standard deviation |
1204,7 |
1216,19 |
1243,49 |
|
|
Variance |
1451299,71 |
1479108,05 |
1546257,91 |
|
|
Confidence Interval |
41873,8 ± 563.8 |
41468,9 ± 569.2 |
42206,7 ± 582.0 |
|
|
Calculated t |
t (A&B) = 0.59 |
t (B&C)= 1.07 |
||
|
t (A&C)= 0.47 |
||||
Extraction Method
In order to eliminate the undesirable components, and to extract the antibiotics in milk, the preparation of the sample is usually necessary. Different methods of extraction can be applied such as: the liquid-liquid extraction, the ultra-filtration, the precipitation of the proteins and the solid phase extraction (Oliveira et al., 2006). To extract the oxytetracycline from milk, many extraction methods can be used: Fritz and Zuo (2007) proceeded to the centrifugation of sample until the proteins precipitated. Then the solid-phase extraction was used. Zhu et al. (2001) used only Solid-phase extraction (SPE) as extraction method. While Spisso et al. (2009) and Koesukwiwat et al. (2007) used only a liquid extraction.
After using the adopted extraction method for milk sample, we obtained a transparent and homogenous liquid which is injected directly in the HPLC device.
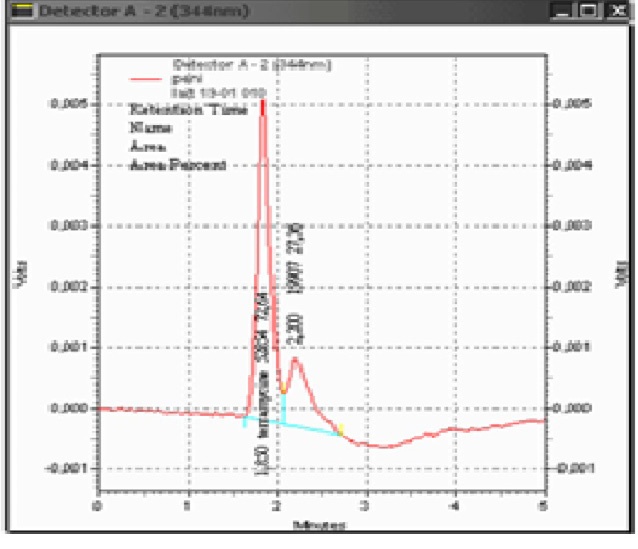
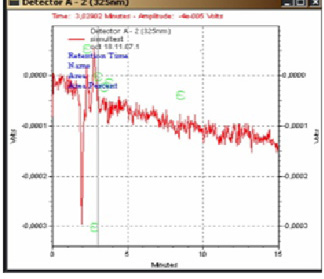
After doping the milk sample by the oxytetracycline standard, we obtained a corresponding peak after 1.90 min (figure 3). For the negative control sample, no peak could be identified (figure 4).
CONCLUSION
This study involved the optimization and validation of a High Performance Liquid Chromatography (HPLC) method for the detection and quantification of oxytetacyclines residues in cow’s milk as well as the adaptation of a technique for its extraction.
Results in these preliminary steps have already served to detect and quantify oxytetracycline residues in a reduced number of samples. This allows us to initiate a meticulous study on the presence and quantity of this antibiotic residues in milk produced in our region.
REFERENCES


