

Production of Protein Hydrolysate from Rohu (Labeo rohita) Waste using Fungal Proteases


Production of Protein Hydrolysate from Rohu (Labeo rohita) Waste using Fungal Proteases
Masood Sadiq Butt1, Sadia Aslam1,2, Rizwan Shukat1,*, Syed Qamar Abbas1, Muhammad Issa Khan1, Shadab Shaukat3 and Muhammad Shahid4
1National Institute of Food Science and Technology, Faculty of Food, Nutrition and Home Sciences, University of Agriculture, Faisalabad
2School of Food and Agricultural Sciences, University of Management and Technology, Lahore
3Faculty of Agriculture, University of Agriculture, Faisalabad
4Department of Biochemistry, Faculty of Sciences, University of Agriculture, Faisalabad
ABSTRACT
Fish waste contains an appreciable amount of proteins, enzymes and fats. It was considered as garbage of no financial value and disposed of without any attempt of recovery. The aim of this study was to optimize the hydrolysis conditions for production of protein hydrolysate with enhanced functionality. Minced rohu (Labeo rohita) waste mainly comprising of head, tail, fins and skin was considered as raw material to prepare protein hydrolysate using flavorzyme enzyme. The results showed that response surface methodology was employed to optimize the reaction conditions (temperature, time, pH and enzyme to substrate ratio) for enzymatic hydrolysis of fish proteins. The optimum reaction conditions for degree of hydrolysis (DH) using flavorzyme enzyme were temperature 46.37oC, time of hydrolysis 116.91 min, [E]/[S] ratio 1.97% and pH of 7.99. The experimental value of DH at optimized conditions was 50.13% while the statistically predicted value for DH was 50.78%. The obtained protein hydrolysate contains high concentration of protein (72.55%) and amino acid (99.71 g/100g) of which 31.2% are essential amino acids. Chemical score of protein hydrolysate was closer to FAO/WHO reference protein. Tryptophan was found most limiting amino acid in fish protein hydrolysate. The nutritional value of fish protein hydrolysate was suitable to suggest it as potential food ingredient in functional foods.
Article Information
Received 23 July 2019
Revised 23 May 2020
Accepted 01 February 2021
Available online 26 May 2021
Authors’ Contribution
MSB and RS planned the research and analyzed the data. SA conducted the research and performed the experiments. SA and SS wrote the manuscript. RS, SQA, MIK and MS supervised the research.
Key words
Labeo rohita, Protein hydrolysate, Proteases, Fish proteins, Amino acids.
DOI: https://dx.doi.org/10.17582/journal.pjz/20190723040754
* Corresponding author: [email protected]
0030-9923/2021/0004-1373 $ 9.00/0
Copyright 2021 Zoological Society of Pakistan
Introduction
The world fish production is increasing at 6.6% rate annually and currently stands at 174 million. Share of fisheries is significant in GDP i.e. 0.41%. Total fish production of Pakistan is 0.47 million metric (GoP, 2017-18). Due to increased production of fish in oceans and fish farms, its utilization has also increased in fish based dishes.
Rohu fish (Labeo rohita) belongs to the family Cyprinidae and order Cypriniformes. It is inhabited in the rivers of subcontinent (Talwar and Jhingran, 1991). Rohu fish culture is being reared in semi-intensive, full-size systems in ponds and low-lying regions of Pakistan.
Fish waste is considered as garbage of no financial value (Gildberg and Stenberg, 2001). 25% of the total fish production is estimated to be discarded as a waste annually (Rustad, 2003). Skin, bones, head, scales and viscera are fish wastes (Benjakul and Morrisey, 1997). Fish waste contains appreciable amount of protein (Kristinsson and Rasco, 2000). Waste of fish industry, if not properly processed may be the root cause of health, environmental and economic issues (Vidotti et al., 2003). Value of the fish proteinaceous waste can be increased by transforming it into protein hydrolysate (Aspmo et al., 2005).
Response surface methodology (RSM) is a statistical tool commonly used to optimize the complicated processes and employ quantitative information from the experimental layout to deduce and instantly resolve problems involving two or more variable quantities. Likewise degree of hydrolysis is the fraction of proteins hydrolyzed at equilibrium. Hydrolysis could be enzymatic or chemical.
The enzymatic processing of protein can be performed under regulated conditions of pH and temperature using proteases from microbial or plant sources (Shahidi et al., 1995). Flavorzyme is a fungal peptidase obtained from Aspergillus oryzae and performs well at pH 7 and temperature 50oC.
Enzymatic hydrolysis and solubilization of proteins from different origins has been investigated extensively by many authors (Aspmo et al., 2005). Flavorzyme is used for protein hydrolysis to produce bioactive peptides with suitable functional characteristics (Kristinsson and Rasco, 2000). Amiza et al. (2011) optimized the enzymatic hydrolysis conditions for preparation of protein hydrolysate from silver catfish and recommended hydrolysis for 134 min at 58°C temperature and substrate pH 9.4 and 8.3 % of enzyme to substrate concentration. Current study was designed to optimize the experimental conditions through the application of response surface methodology for the production of protein hydrolysate from fish waste using flavorzyme protease.
Materials and Methods
Rohu (Labeo rohita) fish was procured from local fish market of Faisalabad (Punjab, Pakistan). Fish waste such as skin, head, tail and fins of fish were removed to serve as raw material for this experiment. Fish waste was grinded to obtain the mince and then packed in polyethylene bags and stored at -18oC for further use. The proteolytic enzyme flavorzyme used for fish protein hydrolysis was procured from Novozymes A/S (Bagsvaerd, Denmark). All the chemicals required for this research were procured from Sigma Aldrich (Germany).
Composition analysis of fish waste
Moisture, ash, crude fat and crude protein contents of minced fish waste were determined by the methods outlined by AOAC (2002).
Extraction and quantification of soluble fish proteins
A chemical method was used for the extraction of soluble fish proteins as described by Arnesen and Gildberg (2005). Rohu fish waste (2 kg) was homogenized in 2000 mL of water. The pH of the blend was maintained at 11 with inclusion of 62 mL of 3M NaOH solution. In first step sample mixture was centrifuged at 4000 g for 15 min at 4°C. Afterwards supernatant was separated and pellet was suspended in 2 L of distilled water and 15 ml of 3 molar NaOH solution was added to maintain the pH at 11. The second step of protein extraction was conducted for 1 h and the sample was centrifuged again at similar parameters as in previous step. Again, supernatant was collected and pellet was dissolved in 2 L of water, 145 mL HCl was used to adjust the pH at 2. The pellet was again dissolved in 2L of distilled water and the pH was regulated to 2 using 3 molar HCl solution (145 mL) before centrifugation for 15 min. All these supernatants from the three extractions were pooled together. pH of the resultant blend was adjusted at 7 by adding 3 molar NaOH solution. The samples were placed at room temperature to precipitate for 15 min and the soluble fraction of protein was obtained by centrifuge at 5000 g for 60 min at 4°C (at pH 7).
Protein concentration determination in fish protein extract was performed using kjeldhal method as described by AOAC (2002).
Enzymatic hydrolysis of fish proteins
The extracted protein solution was hydrolyzed by using the flavourzyme enzyme. The hydrolysis reaction was carried out in water bath shaker at 150 rpm using flavorzyme enzyme under conditions as provided in Table I. After completion of hydrolysis time, sample was heated at 100°C for 10 min to discontinue the reaction. Centrifugation of sample was performed at 4°C and 4100 rpm for 40 min to get soluble hydrolysate. Protein hydrolysates was collected as the supernatant, lyophilized and stored at −40°C prior to analysis.
Table I.- Independent factors and coded design levels used in RSM studies for flavorzyme.
|
Factors |
Levels |
||
|
-1 |
0 |
+1 |
|
|
pH |
5.0 |
6.5 |
8.0 |
|
Temperature (oC) |
40 |
45 |
50 |
|
E/S ratio (W/W) |
1.5 |
2.0 |
2.5 |
|
Time (Min) |
60 |
90 |
120 |
The software Design Expert (Trial version 11 Stat-Ease Inc., NY, USA) was used for designing the experimental model and data analysis via execution of response surface methodology (RSM). The four explanatory variables were used in this experiment including temperature (A), time of hydrolysis (B), [E]/[S] (C) and pH (D), while response variable was DH (Y). Different coded values of explanatory variables are depicted in Table I. A central composite design (CCD) was applied with 30 exploratory runs including sixteen full factorial points, seven replicates of central points and seven axial points. The fitness of statistical model was studied by applying the following quadratic equation:
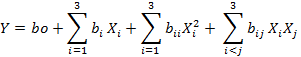
Where, Y indicates the response variable, bo represent the intercept while bi, bii, and bij were symbolized for the coefficients of linear, quadratic and interaction terms whereas Xi and Xj indicate the independent variables, respectively.
Predicted values were calculated and compared with the experimental values to validate the model. Regression model was statistically tested by Fisher’s test for ANOVA to assess the statistical momentousness of the regression coefficients. 3D response surface plots were depicted by Design Expert (DE) software version 11 to demonstrate the relationship between different levels of the independent and dependent variables.
Supplementary Table I shows actual and predicted values of DH (%) of rohu fish protein hydrolysate by flavorzyme and Supplementary Table II shows analysis of variance (ANOVA) for the quadratic response surface model for DH using flavorzyme.
Table II.- Suggested/predicted conditions for degree of hydrolysis (DH) of Rohu fish protein using Flavorzyme by Design expert software.
|
No. |
Temp |
Time |
E/S ratio |
pH |
DH (Y1) |
Desirability |
|
1 |
60.00 |
120 |
2.5 |
8.50 |
55.70412 |
1 |
|
2 |
59.99 |
113.74 |
2.34 |
8.50 |
52.89567 |
1 |
|
3 |
59.99 |
106.39 |
2.35 |
8.50 |
52.42623 |
1 |
|
4 |
59.99 |
111.60 |
2.41 |
8.49 |
53.73986 |
1 |
|
5 |
59.99 |
110.67 |
2.49 |
8.49 |
55.1911 |
1 |
|
6 |
59.99 |
96.92 |
2.46 |
8.49 |
53.14002 |
0.99 |
|
7 |
59.99 |
112.52 |
2.49 |
8.40 |
55.22382 |
0.99 |
|
8 |
59.99 |
111.51 |
2.34 |
8.50 |
52.70548 |
0.99 |
|
9 |
59.99 |
93.78 |
2.45 |
8.49 |
52.5067 |
0.99 |
|
10 |
59.99 |
103.70 |
2.366 |
8.50 |
52.40 |
0.99 |
This analysis of degree of hydrolysis (DH) was conducted by following the procedure (Adler-Nissen 1979; Aslam et al., 2020). A hydrolyzed 125 mg sample was added in 25 mL of 1% SDS solution. The solution was warmed in water bath for 15 min at 50°C and later cooled to room temperature. The sample (250 µL) was added in 2 ml of 0.2 molar phosphate buffer to adjust the pH at 8.2 and heated at 50°C for 1 h in water bath. The pH was lowered by using 4 ml of 0.1 molar HCl to discontinue the reaction. The sample was stored for 30 min at 25°C and spectrophotometric absorbance was estimated at 340 nm via VU-VIS spectrophotometer (CECIL-CE7200). A standard curve of L-leucine was used to quantify the DH applying the given formula:
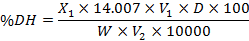
Where, X1 is ηmol of leucine read out from the standard leucine curve, V1 is volume of the sample used (25 mL), D is dilution factor, W is mass of the sample, and V2 is volume used for the reaction.
Freeze drying of fish protein hydrolysates
Protein hydrolysates with highest DH were selected and freeze dried. The samples were loaded to the trayed bottles and frozen at –40oC and allowed to stand at this temperature for 1 h. Pressure was maintained at 200 mL and temperature was raised up to –15oC for primary drying. Primary drying was carried out for overnight then products were subjected to secondary drying at 20oC for 2 h. Final products were obtained in the form of crystalline white powder with greenish tinge.
Amino acid profiling of protein hydrolysate
The amino acid profile of fish protein hydrolysates prepared through enzymatic hydrolysis was conducted using amino acid analyzer (Waters, USA). The protocol followed was elucidated by Ghosh et al. (1997) using Pico. Tag column (3.9 mm ×15 cm) and work station. Eighteen amino acids were detected which were Ala, Arg, Asp, Cys, Glu, Gly, His, Ile, Leu, Lys, Met, Phe, Pro, Ser, Thr, Trp, Tyr and Val. A protein sample (20 mg) was hydrolyzed with hydrochloric acid (6N) for 24 h at 24°C. Hydrolyzed samples were neutralized by sodium hydroxide solution (6N). Derivatization of the samples was carried out by phenyl isothiocyanate (PITC) solution at 25°C for 20 min. Afterwards, samples were injected in to high performance liquid chromatography (HPLC 1525, Waters) at 38°C provided with fluorescence detector and reversed phase column as mentioned in Pico Tag manual. Amino acids present in hydrolyzed protein samples were calculated quantitatively by comparing with retention time and peak areas of amino acids against standards.
For the determination of the tryptophan, samples were mixed with 100 mL of sodium hydroxide solution (4.2M) and 0.3 mL of triglycerine at pH 5.0. Quantification of tryptophan was performed at wavelength of 400 nm by colorimetric analysis (Deng et al., 2002). Chemical scores of flavorzyme prepared hydrolysates was determined by following the equation mentioned by Nilsang et al. (2005) regarding essential amino acid content in reference protein as per FAO/WHO (1991).

Results and discussion
Composition of minced rohu fish waste products (head, tail, skin, frames and fins) shows that moisture content for rohu (Labeo rohita) waste was 78.18%. The range of moisture content was in corroboration with the findings of Dhanapal et al. (2013). Results also showed that crude fat, ash and crude protein content of initial raw material was 1.41%, 1.2% and 18.39%, respectively. The protein content in fish waste was in line with the previous results outlined by other investigators (Azizah et al., 2001; Bhaskar and Mahendrakar, 2008). It was also found in literature that protein content of fish muscles is between 5-20%, but in some species it varies from 5-28% (Murray and Burt, 2001).
In rohu fish protein extract the crude protein content was 11.40±0.025% and concentration of true protein was 10.54±0.01%. The current results are comparable to the results obtained by Batista et al. (2009) who found the 17% and 9% protein content for hake fish and monk fish waste, respectively.
Figure 1 shows two major bands at approximately 30 and 35 KDa which correlate the findings of Reed and Park (2008).
The results about actual and predicted values of DH (%) of rohu fish protein hydrolysate by flavorzyme shows that maximum degree of hydrolysis (50.49%) was at temperature 50oC after 120 min, E/S 2.5 % and pH=8 and the conditions of the least DH (14.36%) were at temperature 40oC, time of hydrolysis 60 min, E/S 1.5 % and pH=5, respectively. Little difference was observed between actual and predicted values of DH% which suggested the high validity of the experimental model to the estimated response variables.
Analysis of variance (ANOVA) for the quadratic response surface model for DH using flavorzyme demonstrate that the F-value of model was 26.41 which showed the high significance of experimental model. It implied that there was only a 0.01% possibility that high value of Fisher’s test (26.41) could appear. ANOVA for DH of fish protein using flavorzyme revealed that experimental model was highly significant at a 99% confidence interval. The F-value of lack of fit was 4.62 which implied that there was a 5.24% chance that a large F-value (4.62) of “lack of fit” could appear due to error. The R2 (Coefficient of determination) value was 96.10% indicating that this statistical model could express the actual relationship between selected parameters very well and only 4.90% of total variation cannot express the DH of fish protein by flavorzyme. The adjusted R2 for DH by flavorzyme was 92.46% and predicted R2 was 80.73%. The Predicted R² of 0.8073 was in appropriate harmony with the adjusted R² of 0.9246 because the variation between them was below 0.2. In this experiment standard deviation and coefficient of variation were 2.85 and 9.725, respectively which indicates that there were low chances of error to occur in this experiment.
The following second order polynomial equations express the dependence of degree of hydrolysis on the independent variables. The response surface regression equation generated by the RSM for flavorzyme enzyme can be explained as following:
Y (DH) = 30.58 + 5.09A + 4.07B + 2.08C + 9.90D – 0.53AB + 0.14AC + 2.65AD + 0.03BC + 1.97BD + 0.36CD – 7.76A2 – 2.10B2 + 2.49C2 + 5.30D2
Equations indicated that highest value of estimated regression coefficients were for pH 9.9 using flavorzyme. It can be deduced from the equation that pH is the most important explanatory variable having strong influence on response variable i.e. DH. These findings are in corroboration with the result mentioned by Nilsang et al. (2005). Adequate precision for this experiment was 20.96. Adequate precision determines the experimental signal to noise ratio and a ratio higher than 4 is required. All independent factors temperature, time of hydrolysis, [E]/[S] and pH had significant (p<0.01) independent and linear effect on degree of hydrolysis of Rohu fish protein hydrolysate using flavorzyme enzyme at 99% confidence interval. The interaction terms temperature-pH (AD) and time of hydrolysis-pH (BD) had significant (p<0.05) effect on degree of hydrolysis for flavorzyme at 95% confidence interval. Other interaction terms such as temperature-time of hydrolysis (AB), temperature-[E]/[S] (AC), time of hydrolysis-[E]/[S] (BC) and [E]/[S]-pH (CD) had no momentous (P>0.05) impact on DH of fish protein for flavorzyme enzyme.
The interaction influence of the explanatory variable on the DH using flavorzyme are demonstrated through three-dimensional response surface graphs (Fig. 2A-F). Figure 2A shows the interaction effect of temperature and time of hydrolysis of flavorzyme on degree of hydrolysis. The result accomplished that the DH improved with the increasing the temperature and time of hydrolysis because enzyme activity is improved with increasing the reaction time. Figure 2B show the impact of temperature and [E]/[S] (AC) on DH for flavorzyme while keeping the impact of pH and time of hydrolysis fixed. It can be concluded from the results that the higher concentration of E/S would have a positive effect on DH while decrease of E/S ratio made the decrease in DH for flavorzyme enzyme. In the presence of higher number of enzymes molecules there will be more chances of proteolytic reaction to occur. At higher enzyme concentration, large number of enzyme molecules became integrated with the protein molecules thus liberating the peptides of lower molecular weight in the system. These outcomes are in harmony with the results described by Normah et al. (2005) for the optimum enzyme concentration for fish protein hydrolysis. Figure 2C demonstrates the impact of pH and temperature on DH for flavorzyme while keeping the impact of time and [E]/[S] as constant. Increase in temperature and pH had positive impact on DH. Enzyme activity upgraded with increasing the temperature up to its optimum temperature. Results are not surprising because optimum pH for flavorzyme is 5-8. Figuer 2D shows the impact of hydrolysis time and [E]/[S] on DH. Increase in time of hydrolysis had positive influence on DH. With the increase in [E]/[S] ratio efficiency of the hydrolysis reaction also increased. Figure 2E demonstrates the effect of time of hydrolysis and pH. Increase in time of hydrolysis and pH had positive impact on DH for flavorzyme. Interaction effect of BD was significant (p<0.05). Figure 2F show the influence of [E]/[S] and pH on DH for flavorzyme. [E]/[S] and pH had positive impact on response variable. Quadratic term A2 had highly significant (p<0.01) effect on DH at 99% confidence interval and D2 had significant (p<0.05) impact on DH for flavorzyme at 95% confidence interval. Other quadratic terms such as B2 and C2 had no momentous impact (p>0.05) on DH for flavorzyme enzyme.
The optimal reaction conditions for different explanatory variables were determined by using ‘Numerical Optimization’ of the Design-Expert11 software. The optimum reaction conditions for DH using flavorzyme enzyme were temperature 46.37oC, time of hydrolysis 116.91 min, [E]/[S] 1.97% and pH of 7.99 and that the DH was predicted to be 50.78%.
Table II shows suggested values of DH by Design-Expert Software version 11 for flavorzyme. Desirability profiles (if 1 or closer to 1) showed that the experimental specifications were most appropriate to achieve the optimum DH. To examine the precision of the predicted model, hydrolysis experiments under the resulted optimum conditions were carried out and DH for flavorzyme was found 50.13%. The optimum conditions for this study were in compliance with the results mentioned by Bhaskar et al. (2008) for hydrolysis of fish waste proteins using proteolytic enzymes and Amiza et al. (2013) for silver catfish waste.
The compositional analysis was performed for final product (lyophilized rohu fish protein powder). Lyophilized rohu protein powder was developed by using the specifications of hydrolysis reaction that was provided with the highest degree of hydrolysis i.e. The highest DH using Flavorzyme, 50.49% was obtained at temperature 50oC, time of hydrolysis 120 min, E/S 2.5% and pH=8.
The results about compositional analysis for fish protein powder prepared using flavorzyme showed that moisture content was 7.86%, protein content was 72.55%, ash content 11.42 % and fat content 0.43%. In this research the protein content of rohu fish protein hydrolysate powder was higher as compared to tilapia protein hydrolysate powder (37.7-49.6%) as reported by Azizah et al. (2001), Catla protein hydrolysate (14.25%) as suggested by Bhaskar et al. (2008) and was in line with the mackerel, white croaker and sardine protein hydrolysates (82.7-85.1%) as reported by Arvanitoyannis and Kassaveti (2013). Thiansilakul et al. (2008) mentioned that round scad fish protein hydrolyzed using flavorzyme yielded 69% of protein.
Table III shows amino acid composition of freeze-dried fish protein powder prepared by flavorzyme. The results showed that the Histidine (1.98±0.03), isoleucine (3.05±0.03), leucine (6.93±0.08), lysine (6.26±0.07), methionine (1.96±0.05), phenylalanine (3.02±0.05), tryptophan (0.29±0.01), threonine (3.54±0.07) and valine (4.07±0.05) tended to be predominate in protein hydrolysate prepared by flavorzyme assisted hydrolysis. The current results are in line with the results described by Satya and Dora (2011) who revealed that concentration of the amino acids increases with increase in DH. To estimate the nutritional value of protein hydrolysates prepared by using protease its chemical scores was calculated on the basis of reference protein. Tryptophan is present in least amount while lysine was present in excess in flavorzyme based hydrolysate while other essential amino acids were present in adequate quantity. The amino acid profile of protein hydrolysate in current study were in harmony with the findings of Benjakul and Morrisey (1997) who studied the amino acid profile of pacific whiting waste.
Table III.- Mean values for essential amino acids and chemical score of fish protein hydrolysates.
|
Essential amino acids |
Amino acid concentration (%) |
Chemical score |
|
Histidine |
1.98±0.03 |
0.99 |
|
Isoleucine |
3.05±0.03 |
0.84 |
|
Leucine |
6.93±0.08 |
0.99 |
|
Lysine |
6.26±0.07 |
1.13 |
|
Methionine |
1.96±0.05 |
0.56 |
|
Phenylalanine |
3.02±0.05 |
0.70 |
|
Tryptophan |
0.29±0.01 |
0.24 |
|
Valine |
4.07±0.05 |
0.75 |
|
Threonine |
3.54±0.07 |
0.88 |
|
Non-essential amino acids |
||
|
Arginine |
7.03±0.02 |
- |
|
Alanine |
8.71±0.04 |
- |
|
Aspartic acid |
8.48±0.02 |
- |
|
Serine |
4.40±0.01 |
- |
|
Cystine |
0.10±0.001 |
- |
|
Glutamic acid |
10.07±0.01 |
- |
|
Glycine |
21.22±0.05 |
- |
|
Proline |
7.74±0.03 |
- |
|
Tyrosine |
0.86±0.01 |
- |
|
Arginine |
7.03±0.02 |
- |
Mean values of 3 determinations ± standard deviation.
It can be inferred from the mean values for non-essential amino acids that in protein hydrolysate prepared by flavorzyme cysteine was the limiting amino. In flavorzyme based protein hydrolysate the most abundant amino acids were glycine (21.22±0.05), glutamic acid (10.07±0.01) and aspartic acid (8.48±0.02). Bhasker et al. (2008) reported the higher concentration of aspartic acid and glutamic acid in protein hydrolysate from catla fish waste using commercial protease. The results regarding amino acid composition of current study are in corroboration with the results of Roslan et al. (2014) who described the amino acid profile of tilapia muscle protein hydrolysate. Present findings are also in line with the results of See et al. (2011).
Conclusion
Fungal protease i.e. flavorzyme enzyme was quite efficient for the hydrolysis of fish proteins. The degree of hydrolysis of rohu fish protein was significantly influenced by reaction conditions such as temperature, pH, time of hydrolysis and [E]/[S]. The optimized conditions for the production of protein hydrolysate were temperature 46.37oC, time of hydrolysis 116.91 min, [E]/[S] ratio 1.97% and pH of 7.99 to get the degree of hydrolysis close to 50.78%. It was also concluded that response surface methodology may provide most suitable and economic processes to produce fish protein hydrolysates. Protein hydrolysate in powder form was developed from rohu fish waste with high protein concentration (72.55%) and rich amino acid score. Fish protein hydrolysate has a good potential to be used as food additive. The hydrolyzed proteins and peptides of small size has great utilization due to their enhanced and improved functional characteristics. Thus, production of fish protein hydrolysate is an effective alternative utilization of fish industrial waste and opportunity for fish processors to get more profit. Further studies to evaluate the functional properties of fish hydrolysates will pave the way towards novel innovation in protein hydrolysis.
Acknowledgements
Authors acknowledge the financial support provided by Higher Education Commission Govt. of Pakistan (grant number 315-15854-2AV3-086). Author Sadia Aslam thanks the National Institute of Food Science and Technology, University of Agriculture Faisalabad, Pakistan for analytical services rendered by them.
There is supplementary material associated with this article. Access the material online at: https://dx.doi.org/10.17582/journal.pjz/20190723040754
Statement of conflict of interest
The authors have declared no conflict of interests.
References
Adler-Nissen, J., 1979. Determination of the degree of hydrolysis of food protein hydrolysate by trinitrobenzensulfonic acid. J. Agric. Fd. Chem., 27: 1256-1262. https://doi.org/10.1021/jf60226a042
Amiza, M.A., Nurul Ashikin, S. and Faazaz, A.L., 2011. Optimization of enzymatic protein hydrolysis from silver catfish (Pangasius sp.) frame. Int. Fd. Res. J., 18: 775-78.
Amiza, M.A., Ow, Y.W. and Faazaz, A.L., 2013. Physicochemical properties of silver catfish (Pangasius sp.) frame hydrolysate. Int. Fd. Res. J., 20: 1255-1262.
AOAC, 2002. Official methods of analysis, 17th ed. Association of Official Analytical Chemists, Washington, USA.
Arnesen, J.A. and Gildberg, A., 2007. Extraction and characterization of gelatine from Atlantic salmon (Salmo salar) skin. Bioresour. Technol., 98: 53-57. https://doi.org/10.1016/j.biortech.2005.11.021
Arvanitoyannis, I.S. and Kassaveti, A., 2008. Fish industry waste: Treatments, environmental impacts, current and potential uses. Int. J. Fd. Sci. Technol., 43: 726-745. https://doi.org/10.1111/j.1365-2621.2006.01513.x
Aslam, S., Shukat, R., Khan, M.I. and Shahid, M., 2020. Effect of dietary supplementation of bioactive peptides on antioxidant potential of broiler breast meat and physicochemical characteristics of nuggets. Fd. Sci. Anim. Resourc., 40: 55-73. https://doi.org/10.5851/kosfa.2019.e82
Aspmo, S.I., Horn, S.J. and Eijsink, V.G.H., 2005. Enzymatic hydrolysis of Atlanic cod (Gadus morhua L.) viscera. Process Biochem., 40: 1957-1966. https://doi.org/10.1016/j.procbio.2004.07.011
Azizah, A.H., Jamilah, B. and Gan, H.B., 2001. Nutritional quality of spray dried protein hydrolysate from Black Tilapis (Oreochromis mossambicus). Fd. Chem., 78: 69-74. https://doi.org/10.1016/S0308-8146(01)00380-6
Batista, I.., Ramos, C., Mendonca, R. and Nunes, M.L., 2009. Enzymatic hydrolysis of sardine (Sardina pilchardus) by-products and lipid recovery. J. aquat. Fd. Prod. Technol., 18: 120-134. https://doi.org/10.1080/10498850802581823
Benjakul, S. and Morrisey, M.T., 1997. Protein hydrolysate from pacific whiting solid waste. J. Agric. Fd. Chem., 61: 131-138.
Bhaskar, N. and Mahendrakar, N.S., 2008. Optimization of enzymatic hydrolysis of visceral waste proteins of Catla (Catla catla) for preparing protein hydrolysate using a commercial protease. Bioresour. Technol., 99: 4105-4111. https://doi.org/10.1016/j.biortech.2007.09.006
Deng, S.G., Peng, Z.Y., Yang, P. and Xia, X.Z., 2002. Application of multi-enzymatic method in fermented fish sauce production from Harengula zunasi’s offal. Fd. Ferment. Indust., 28: 32-36.
Dhanapal, K., Saravani, K. and Balasubramanian, A. and Reddy, G.V.S., 2013. Quality determination of rohu (Labeo rohita) during ice storage. Tamilnadu J. Vet. Anim. Sci., 9: 146-152.
FAO/WHO, 1991. Protein quality evaluation: Report of the Joint FAO/WHO Expert Consultation. Food and Nutrition Paper 51, FAO, Rome.
Ghosh, A.K., Naskar, A.K. and Sengupta, S., 1997. Characterization of a xylanolytic amyloglucosidase of Termitomyces clypeatus. Biochim. biophys. Acta, 1339: 289-296. https://doi.org/10.1016/S0167-4838(97)00011-3
Gildberg, A. and Stenberg, E.A., 2001. A new process for advanced utilization of shrimp waste. Process Biochem., 36: 809-812. https://doi.org/10.1016/S0032-9592(00)00278-8
GoP, 2017-2018. Pakistan economic survey. Economic Advisor’s Wing, Finance Division, Islamabad.
Kristinsson, H.G. and Rasco, B.A., 2000. Biochemical and functional properties of Atlantic Salmon (Salmo salar) muscle hydrolyzed with various alkaline protease. J. Agric. Fd. Chem., 24: 177-187. https://doi.org/10.1111/j.1745-4514.2000.tb00694.x
Murray, J. and Burt, J.R., 2001. The composition of fish. Torry Advisory Note No. 38, Ministry of Technology, Torry Research Station, U.K., pp. 14.
Nilsang, S., Lertsiri, S., Suphantharika, M. and Assavanig, A., 2005. Optimization of enzymatic hydrolysis of fish soluble concentrate by commercial protease. J. Fd. Eng., 70: 571-578. https://doi.org/10.1016/j.jfoodeng.2004.10.011
Normah, I., Jamilah, B., Saari, N. and Che Man Yaakob, B., 2005. Optimization of hydrolysis conditions for the production of threadfin bream (Nemipterus japonicus) hydrolysate by Alcalase®. J. Muscle Fds., 16: 87-102. https://doi.org/10.1111/j.1745-4573.2005.07404.x
Reed, Z.H. and Park, J.W., 2008. Qualification and quantification of fish protein in prepared surimi crabstick. J. Fd. Sci., 73: 329-334. https://doi.org/10.1111/j.1750-3841.2008.00759.x
Roslan, J. Kamal, S.M.N., Yunos, K.F.M. and Abdullah, N., 2014. Optimization of enzymatic hydrolysis of tilapia (Orechomis niloticus) muscles using response surface methodology. Sains Malysiana, 43: 17151723.
Rustad, T., 2003. Utilization of marine byproducts. Elec. J. Environ. Agric. Fd. Chem., 2: 458-463.
Satya, S.D. and Dora, K.C., 2011. Optimization of the production of shrimp waste protein hydrolysate using microbial proteases adopting response surface methodology. J. Fd. Sci. Technol., 51: 16-24. https://doi.org/10.1007/s13197-011-0455-4
See, S.F., Hoo, L.L. and Babji, A.S., 2011. Optimization of enzymatic hydrolysis of Salmon skin by alcalase. Int. Fd. Res. J., 18: 1359-1365.
Shahidi, F., Han, X.Q. and Synowiecki, J., 1995. Production and characteristics of protein hydrolysates from capelin (Mallotus villosus). Fd. Chem., 53: 285-293. https://doi.org/10.1016/0308-8146(95)93934-J
Talwar, P.K. and Jhingran, A.G., 1991. Fisherine status and their link between sediment CNP content of Kadinamkulam Estuary at Kerala, India. Oxford and IBH Publishing Co. Pvt. Ltd., New Delhi, pp. 1097.
Thiansilkalu, Y., Benjakul, S. and Shahidi, F., 2007. Functional properties and antioxidative activity of protein hydrolysate from round scad (Decapterus maruadsi). Fd. Chem., 103: 1385-1394. https://doi.org/10.1016/j.foodchem.2006.10.055
Vidotti, R.M., Viegas, E.M.M. and Careiro, D.G., 2003. Amino acid composition of processed fish silage using different raw materials. Anim. Feed Sci. Technol., 105: 199-204. https://doi.org/10.1016/S0377-8401(03)00056-7
To share on other social networks, click on any share button. What are these?


