Fig. 2.
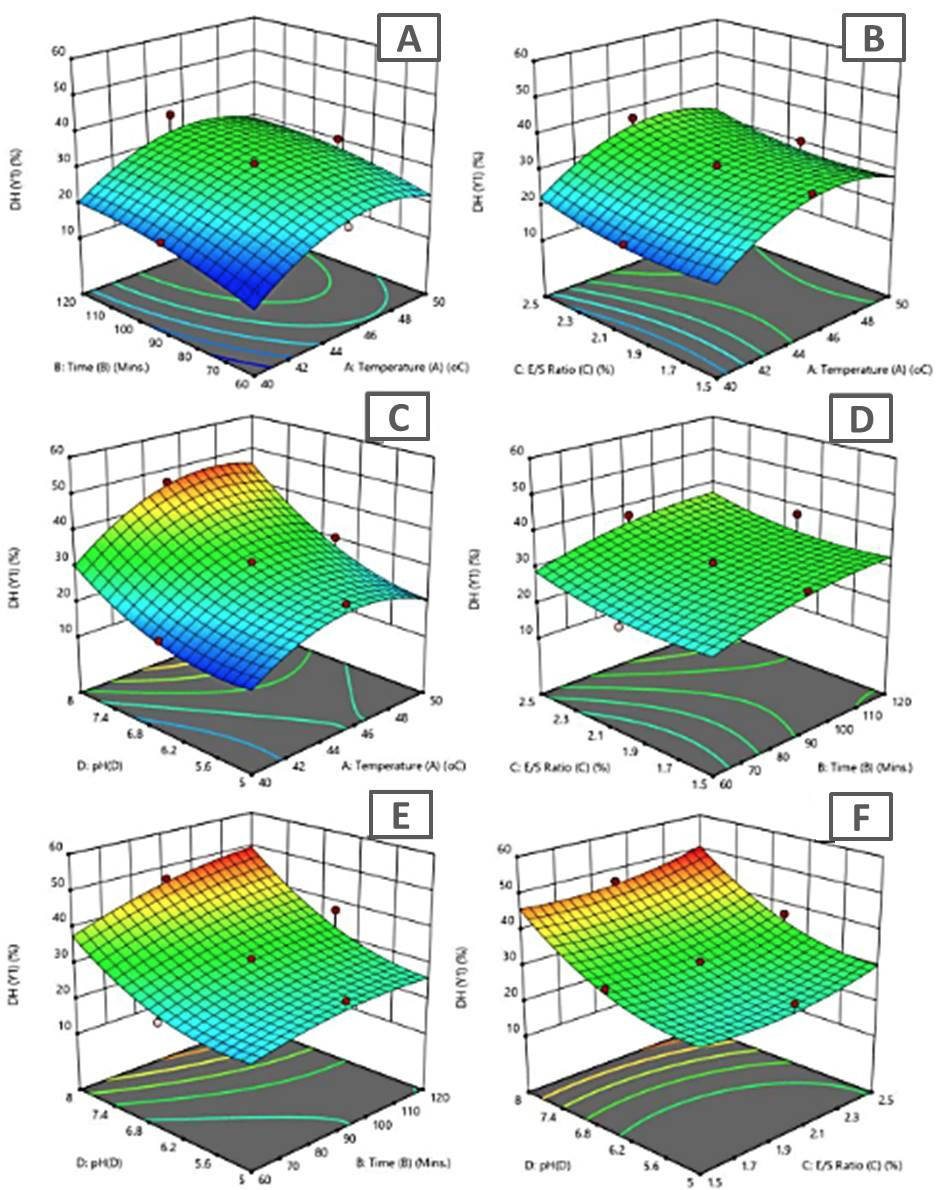
RSM 3D graphs for DH using flavorzyme as a function of (A) time and temperature. B, E/S ratio and temperature. C, temperature and pH (D) time and E/S (E) pH and time (F) E/S and pH.
RSM 3D graphs for DH using flavorzyme as a function of (A) time and temperature. B, E/S ratio and temperature. C, temperature and pH (D) time and E/S (E) pH and time (F) E/S and pH.