
Genetic Variability and Performance of Cotton (Gossypium hirsutum L.) Genotypes for Yield Related Agro-Morphologic and Fiber Quality traits under Water Deficit Natural Environment


Research Article
Genetic Variability and Performance of Cotton (Gossypium hirsutum L.) Genotypes for Yield Related Agro-Morphologic and Fiber Quality traits under Water Deficit Natural Environment
Hafeez-ur-Rehman1*, Umar Farooq1, Muhammad Asim Bhutta2, Saghir Ahmad2, Muhammad Akram2, Muhammad Rafiq Shahid2, Hammad Hussnain2, Muhammad Shahid2, Muhammad Mehmood Iqbal2, Ali Raza2 and Muhammad Iqbal2
1Cotton Research Station Sahiwal, Punjab, Pakistan; 2Cotton Research Institute Multan, Punjab, Pakistan.
Abstract | Development of cotton (Gossypium hirsutum L.) cultivars with natural tolerance to drought stress is the foremost agenda of cotton breeders these days under the current scenario of climate change. The major purpose of the present study was to evaluate the cotton genotypes under naturally developed water-deficit condition and evaluating them in comparative study with natural full irrigation condition. For the purpose, seven cotton genotypes along with a drought tolerant check (FH-142) were evaluated for two cotton growing seasons (2018 and 2019) to study their performance in terms of yield, drought response indices along with other agro-morphological and fiber quality traits in both irrigation regimes. Analysis of Variance (ANOVA) showed existence of considerable genotypic variations for studied traits. Genotypes with high GMP and low DSI were selected as potential drought-tolerant genotypes. Under drought stress condition, cotton yield had a strong positive association with NBP, PH and significantly positive with BW; whereas negative with GOT, FS. These results depict that NBP, PH and BW are the major contributors towards yield under drought stress. Results also emphasized that water-deficit situation seriously impact ginning out turn and fiber strength in cotton. Based on AMMI scatter plot, three genotypes and one check were found tolerant to drought stress. The objective of the study is to evaluate genotypes under drought stress and utilize the best performing drought tolerant genotypes in breeding programme for the development of drought tolerant cotton varieties. The studied genotypes SLH-105,SLH-106,SLH-107, SLH-108, SLH-109, SLH-110, SLH-11can be exploited as a new drought tolerant high yielding cotton variety and also as a genetic resource in various breeding programs with the aim to improve drought tolerance in cotton.
Received | December 23, 2021; Accepted | January 14, 2022; Published | March 31, 2022
*Correspondence | Hafeez-ur-Rehman, Cotton Research Station Sahiwal, Punjab, Pakistan; Email: hafeez2016khan@gmail.com
Citation | Rehman, H.U., U. Farooq, M.A. Bhutta, S. Ahmad, M. Akram, M.R. Shahid, H. Hussnain, M. Shahid, M.M. Iqbal, A. Raza and M. Iqbal. 2022. Genetic variability and performance of cotton (Gossypium hirsutum L.) genotypes for yield related agro-morphologic and fiber quality traits under water deficit natural environment. Sarhad Journal of Agriculture, 38(2): 657-668.
DOI | https://dx.doi.org/10.17582/journal.sja/2022/38.2.657.668
Keywords | Cotton (Gossypium hirsutum L.), Yield, Fiber quality, Water-deficit, Correlation, AMMI analysis
Copyright: 2022 by the authors. Licensee ResearchersLinks Ltd, England, UK.
This article is an open access article distributed under the terms and conditions of the Creative Commons Attribution (CC BY) license (https://creativecommons.org/licenses/by/4.0/).
Introduction
Cotton is consumed worldwide as natural fiber, significantly in textile industries. It counts for one third of all types of globally manufactured fibers (Grishanov, 2011). Cotton fiber is appraised for its exceptional comfort, versatility and enduring performance. Which is being utilized to manufacture diverse sorts of fabrics (Cotton Australia, 2020), edible oil as well as animal feed (Mordor, 2018). About 64% of total fiber derived from cotton lint is employed in apparel industry, 28% for household furnishing and8% for various other industrial applications (Mordor, 2018). In cooking oil industries, cholesterol-free oil is extracted by mechanized crushing of cotton seeds, which is further used as an ingredient in other billion-dollar industries such as pharmaceuticals, personal care products including cosmetics as well as in plastics and rubber industries (Lu, 2018; Fashion United, 2019). Moreover, cotton crop being the most profitable non-food crop, sustains about USD 03 trillion global fashion industry, with USD 1.3 trillion global garment exports in 2019 (Tridge, 2019).
In Pakistan, cotton has ranked first in agriculture and textile sector in terms of national economy with the contribution of about 0.6% to Gross Domestic Production (GDP) and 3.1% of the total value added in sector of agriculture. Despite its economical worth, cotton crop in Pakistan has been facing different challenges such as overlapping major crop season particularly sugarcane, fluctuating international prices, lack of robust policies safeguarding due profitability of cotton growers. During the year 2020-21, cotton was cultivated on 2.079 million hectares with17.4% contraction as compared to the cultivated area of 2.517 million hectares last year resulting in declined trend in production by 22.8% to 7.064 million bales as compared to total production of 9.148 million bales last year (PES, 2020-21).Drastic downward trend in cultivated area of cotton crop has been attributed to its declining economic competitiveness relative to other more profitable crops particularly sugarcane, accompanied with radicle climatic impacts due to water scarcity further worsened the situation during the last decade (OECD-FAO 2019).
Droughts referring as shortage of precipitation over a prolonged period of days, increasingly becoming foremost perilous meteorological consequence of climate change globally (Powell and Reinhard, 2016).Which have been adversely affecting the agriculture for the last few years (Wilhite et al., 2014).Cotton is one of the major crops significantly disturbed by droughts and drastic decline in its production has been observed all over the world including Pakistan (Anonymous, 2020) that observed about 30% decrease in cotton production during last 05 years solely due to water shortage (Ullah et al., 2017).Drought stress directly deteriorates quality as much as quantity of cotton lint by suppressing cellular and molecular mechanisms (Chaves et al., 2003).Water shortages further upsurge the risk of other stresses by upsetting the regular mechanism of plant to deal with the disease incidences and insect attack resulting in a vertical decline in yield.
Cotton plant has been evolving itself with the process of natural selection in consistent with the environmental fluctuations that has gradually been occurring in the past. In order to increase yield, artificial selection and domestication of a few cotton cultivars with a major share of cultivated area over past few decades has resulted in loss of natural and innate mechanisms to manage the abrupt changing climatic conditions such as droughts and water shortage. In recent times, the scientists are exploring means to regain the genetic potential of cotton cultivars to withstand stresses. One of the cheapest strategies to cope with drought and water shortage is to screen out water efficient and drought tolerant cotton cultivars. Many plant physiologists categorize drought tolerance mechanism in plants into four classes: drought avoidance, tolerance, recovery, and escape (Zahid et al., 2021; Fang and Xiong, 2015). Depending on drought stress duration, intensity and time of occurrence, different strategies can be applied to develop cotton varieties that are more water efficient and drought tolerant. For the purpose, the initial phase is to comprehend responses and behavior of cotton plant towards water shortage and droughts (Abdel Raheem, 2019).
In cotton plant, different parameters including morphological traits (leaf, stem and root growth) and physiological traits (molecular, histological and anatomical) have been investigated by different scientists as important selection criteria linked with drought tolerance (Loka et al., 2011). Nevertheless, none of these traits has been found consistently associated positive with drought tolerance in cotton (Volkan et al., 2015; Loka et al., 2011). A reliable indicator trait for yield under drought stress has suggested the use of recurrent study for more than one season or over a range of environments is more reliable and consistent (Voltas et al., 2005).In most of the preceding drought screening studies, controlled conditions were used to screen cotton cultivars using pots that have few statistic weaknesses (Passioura, 2006) including less area of experimentation than optimum, higher error variance due to the pot size, restrained root growth in pots, artificial soil mixture (soil media) and plant nutrients. Moreover, the tolerance response of cultivars in pots significantly changes under natural field condition. Therefore, in this experiment, different physiological, morphological and quality traits were studied for two years under normal and drought stress environments in order to screen cotton varieties and their comparison was ascertained to investigate the trait which is most affected under drought stress.
Materials and Methods
The screening experiments were conducted at the Cotton Research Station, Sahiwal, Punjab; Pakistan during the two consecutive growing cotton growing seasons of 2018 and 2019. The latitude and longitude of the experiment site are 30° 39’ N and 73° 9’ E, respectively. Climate in this region is semiarid with total annual precipitation of 349 mm. The soil type of the experimental area is loam and sandy loam in texture. For the cotton experiment area, water content at field capacity varied from 20.3 to 27.6 %, and wilting point varied from 7.2 to 9.7 % on dry weight basis. The dry soil bulk densities ranged from 1.42 to 1.50 g cm-3 throughout the 1.2 m deep profile.
The experiment was divided into two regimes; one was conducted with normal irrigation schedule while the other one was passed through extended stress of water deficit. Both the experimental regimes were arranged in the Randomized Complete Block Design (RCBD) with three replications. Eight cotton genotypes including one check for yield were used as experimental material to be screened for drought during consecutive two years. Total eight (8) cotton genotypes were planted on 19 May 2018 and on 03 May 2019 respectively. Cotton plants were planted at 0.76 m (row width) 0.25 m (between plants). Each cotton genotype was planted one row with 12 m long and only 10m length was harvested. A compound fertilizer (15 %, 15% and 15 % composite) was applied at a rate of 80 kg ha-1 pure N, P and K before planting. The required remaining portion of nitrogen was followed by 100 kg ha-1as calcium ammonium nitrate 26% before first irrigation.
The two experimental irrigation regimes, with normal standard irrigation schedule (with 100 % water available for normal crop growth) named as control and water deficit irrigation schedule (with ~50 % of total water required for normal crop growth). Tensiometers were installed in each experiment to record the soil water potential before and after the experiment. In the control treatment, genotypes were managed to receive full irrigation (100 % of required water). For the stress treatments, irrigation was scheduled as normal in order to grow the genotypes normally and water was held for four weeks unless the check showed symptoms of water stress physiologically.
Yield related traits i.e. seed cotton yield (kg/ha), number of bolls per plant (n), boll weight (g) and lint percentage (%) were recorded for each replication separately in both the irrigation regimes during all the three years in order to test the performance differences in genotypes under drought stress and normal conditions, along with some drought indices I.e. drought intensity (DI), drought susceptibility index (DSI) and geometric mean productivity (GMP).
For the estimation of Drought intensity (DI) index was calculated for each cultivar, the following formula was used:

Where;
Ŷs: Means of all genotypes under full irrigation; Ŷp: Means of all genotypes under water deficit / drought stress.
To calculate drought susceptibility index (DSI)for each cultivar, the formula proposed by Fisher and Maurer (1978) was used.
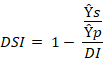
Ŷs: Means of all genotypes under full irrigation; Ŷp: Means of all genotypes under water deficit / drought stress; DI: Drought intensity index.
To calculate geometric mean productivity (GMP) for each cultivar was calculated by using the formula proposed by Fernandez (1992) as given below:
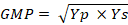
Table 1: Descriptive statistics of agro-morphological traits of cotton studied under normal irrigation.
|
Trait / Statistics |
CLCD |
Y |
NBP |
BW |
PH |
DFF |
DFB |
GOT |
FL |
FF |
FS |
|
Range |
12.1 |
468 |
18 |
1.8 |
42 |
16 |
18 |
6 |
5 |
0.7 |
8 |
|
Minimum |
14.2 |
2101 |
23 |
2.3 |
146 |
40 |
77 |
36 |
26 |
3.6 |
28 |
|
Maximum |
26.3 |
2569 |
41 |
4.1 |
188 |
56 |
95 |
42 |
31 |
4.3 |
36 |
|
Mean |
21.75 |
2366 |
33.37 |
3.092 |
163.29 |
46.4 |
86.1 |
39.63 |
28.44 |
4.015 |
32.19 |
|
Std. Error |
0.4136 |
16.566 |
0.618 |
0.0626 |
1.19 |
0.484 |
0.553 |
0.262 |
0.168 |
0.0254 |
0.288 |
|
Std. Deviation |
2.8656 |
114.772 |
4.284 |
0.4336 |
8.246 |
3.356 |
3.833 |
1.817 |
1.165 |
0.1762 |
1.996 |
|
Variance |
8.211 |
13172.56 |
18.351 |
0.188 |
67.998 |
11.266 |
14.691 |
3.303 |
1.358 |
0.031 |
3.985 |
|
Skewness |
-0.726 |
-0.374 |
-0.617 |
0.178 |
0.291 |
0.274 |
0.026 |
-0.521 |
-0.011 |
-0.499 |
0.082 |
|
Kurtosis |
0.524 |
-0.193 |
-0.249 |
-0.661 |
0.693 |
0.368 |
-0.269 |
-0.519 |
-0.535 |
-0.685 |
-0.871 |
BW: Average boll weight; NBP: Number of bolls per plant; CLCD: Cotton leaf curl disease incidence percentage; DFF: Days to first flowering; DFB: Days to first boll opening; FF: Fiber fitness; GOT: Ginning out term percentage; FL: Fiber length; FS: Fiber strength; PH: Plant height; Y: Yield.
Skewness coefficients (S) and kurtosis coefficients (K) were estimated (Snedecor and Cochran, 1967) to understand the nature of gene action and distribution of different traits.
Descriptive statistics were performed using JMP 5.0.1 statistical software (SAS Institute Inc., 2002). Correlation coefficient values among traits under study were determined by using SPSS ver. 25. The AMMI analyses were conducted using Sigm Plot version 10.0 software (SYSTAT Software Inc., 2006).
Results and Discussion
Results showed that the cotton genotypes responded differently in fully irrigated and drought stress conditions. All the studied agro-morphological traits and the disease incidence changed significantly under two different moisture regimes. In case of cotton seed yield, average yield of all genotypes was recorded higher (2366 kg/ha ranging from 2101 – 2569 kg/ha) under normal irrigation as compared to the average yield 1347 kg/ha (ranging from 934 – 1963 kg/ha) under moisture stress condition as depicted in table 1 and table 2. So was the case with all the other yield attributes which showed drastic reduction caused by water deficit. Mean values of no of bolls/plant under drought was recorded 18.77 reduced from 22.37 under normal, boll weight (g) under stress was 2.516 g reduced from 3.092 g under normal irrigation. Likewise, mean of plant height under water deficit condition was 68.706 cm, DFF was 32.73 days, DFB was 72.44 days, GOT was 37.281%, FL was 27.61 mm, FF was 3.377 µg/in and FS was recorded as 30.844 g/tex under water deficit environment; whereas under normal irrigation environment, mean values for PH was recorded as 163.29 cm, DFF was 46.4 days, DFB was 86.1 days, GOT was 39.63%, FL was 28.44 mm, FF was 4.015 µg/in and FS was 32.19 g/tex as depicted un table 1 and 2. Higher variances were recorded for all the studied traits under both regimes ranging from 0.188 – 13172 for normal and 0.202 – 63733 for water deficit condition.
Mode of gene action for each trait was also estimated from the values of coefficients of skewness (S) and kurtosis (K). in case of a normal distribution, skewness is equal to zero which emphasizes the absence of gene interaction; if greater or smaller than zero, it indicates the presence of average complementary or duplicate epistasis, respectively (Burton and De Vane 1953; Ashwini et al., 2011). Under normal irrigation, all the traits showed skewness deviated from zero, which indicates multiple gene epistasis involving more than one gene. Negative skewness shows duplicate epistasis of fewer genes as observed in case of CLCD, Y, NBP, GOT, FL and FF under normal, and positive or higher skewness indicates complementary gene epistasis as observed in case of BW, PH, DFF, DFB and FB (Table 1). Under water deficit environment, the skewness values changed showing change in gene action. All the traits showed more or less than zero values of skewness. For some traits such as CLCD, Y, BW, PH, DFB it was higher than zero and in case of NBP, DFF, GOT, FL, FF and FS, values of coefficients of skewness was less than zero (Table 2). Positive (more than zero) skewness is associated with complementary gene epistasis while negative
Table 2: Descriptive statistics of agro-morphological traits of cotton studied under water stress.
|
Trait / Statistics |
CLCD |
Y |
NBP |
BW |
PH |
DFF |
DFB |
GOT |
FL |
FF |
FS |
|
Range |
36.7 |
1028.35 |
16.5 |
1.7 |
47.8 |
16 |
16 |
13 |
5.4 |
2.3 |
11.8 |
|
Minimum |
32.2 |
934.8 |
9.7 |
1.7 |
46.2 |
25 |
65 |
29 |
24.6 |
2 |
24.8 |
|
Maximum |
68.9 |
1963.15 |
26.3 |
3.4 |
94 |
41 |
81 |
42 |
30 |
4.3 |
36.6 |
|
Mean |
48.675 |
1347.72 |
18.77 |
2.516 |
68.705 |
32.73 |
72.44 |
37.281 |
27.61 |
3.377 |
30.844 |
|
Std. Error |
1.4074 |
36.4388 |
0.5811 |
0.0649 |
1.7487 |
0.498 |
0.556 |
0.4372 |
0.1627 |
0.1021 |
0.4447 |
|
Std. Deviation |
9.7509 |
252.4554 |
4.0256 |
0.4496 |
12.1154 |
3.45 |
3.853 |
3.0293 |
1.1275 |
0.7072 |
3.0807 |
|
Variance |
95.079 |
63733.72 |
16.206 |
0.202 |
146.784 |
11.904 |
14.847 |
9.177 |
1.271 |
0.5 |
9.491 |
|
Skewness |
0.092 |
0.54 |
-0.151 |
0.026 |
0.152 |
-0.03 |
0.098 |
-0.232 |
-0.613 |
-0.369 |
-0.003 |
|
Kurtosis |
-0.878 |
-0.101 |
-0.653 |
-0.825 |
-0.802 |
-0.031 |
-0.405 |
-0.415 |
0.668 |
-1.341 |
-0.905 |
BW: Average boll weight; NBP: Number of bolls per plant; CLCD: Cotton leaf curl disease incidence percentage; DFF: Days to first flowering; DFB: Days to first boll opening; FF: Fiber fitness; GOT: Ginning out term percentage; FL: Fiber length; FS: Fiber strength; PH: Plant height; Y: Yield.
Table 3: Results of analysis of variance (ANOVA) under normal irrigation.
|
Source |
BW |
NBP |
CLCD |
DFF |
DFB |
PH |
Y |
FF |
GOT |
FL |
FS |
|
Rep (MS) |
0.099 |
24.333 |
5.044 |
27.021 |
26.896 |
380.583 |
43.9 |
0.044 |
7.750 |
5.688 |
22.938 |
|
Year (MS) |
0.521 |
111.021 |
20.541 |
3.521 |
3.521 |
352.083 |
61992.2 |
0.010 |
0.333 |
6.021 |
2.521 |
|
Rep*Year (MS) |
0.010 |
0.583 |
0.888 |
6.896 |
6.896 |
257.333 |
24.8 |
0.003 |
0.333 |
0.271 |
1.271 |
|
Variety (MS) |
0.809 |
90.378 |
46.140 |
34.330 |
56.045 |
104.464 |
78480.3 |
0.132 |
12.560 |
2.140 |
10.402 |
|
Error (MS) |
0.070 |
1.971 |
0.873 |
6.223 |
6.488 |
23.907 |
217.7 |
0.012 |
1.452 |
0.883 |
1.816 |
|
F-value |
11.63 |
45.86 |
52.85 |
5.52 |
8.64 |
4.37 |
360.53 |
10.60 |
8.65 |
2.42 |
5.73 |
|
P-value |
0.0000 |
0.0000 |
0.0000 |
0.0002 |
0.0000 |
0.0014 |
0.0000 |
0.0000 |
0.0000 |
0.0390 |
0.0002 |
|
CV (%) |
8.53 |
4.16 |
4.30 |
5.38 |
2.96 |
2.99 |
7.62 |
2.78 |
1.04 |
3.30 |
4.19 |
BW: Average boll weight; NBP: Number of bolls per plant; CLCD: Cotton leaf curl disease incidence percentage; DFF: Days to first flowering; DFB: Days to first boll opening; FF: Fiber fitness; GOT: Ginning out term percentage; FL: Fiber length; FS: Fiber strength; PH: Plant height; Y: Yield.
(less than zero) skewness is associated with duplicate (additive × additive) epistasis effect (Pooni et al.,1977; Choo and Reinbergs, 1982; Kotch et al., 1992). The traits with leptokurtic (K > 3) and platykurtic (K < 3) distribution are controlled by fewer and large number of genes, respectively. Values of K for all the traits were less than three indicating many genes involvement for the final phenotype. Under normal condition, coefficients of kurtosis (K) for all the traits is negative except CLCD, PH, DFF and under water deficit condition all the traits showed negative K values except for FL (Table 1 and 2). Further studies on the account of genetic interactions among traits are undoubtedly required in order to increase the selection efficiency in our breeding programs. Depending on the mode of gene action, selection intensity may be increased under complementary as compared to the genes under duplicate relationship. (Choo and Reinbergs, 1982).
Results of analysis of variance (ANOVA) indicate wide range of variability present in studied genotypes under both moisture regimes. Table 3 and 4 shows the results of ANOVA for each studied trait in cotton genotypes under normal irrigation and water deficit condition, respectively, in order to screen out cotton genotypes with better water deficit stress tolerance. The MS (mean sum of square), F-tabulated, p-values along with coefficient of variability (CV) estimated separately for each trait is given in table to estimate the presence of significant variability among genotypes, significant difference between years and the residual error variance. All the traits showed highly significant (p< 0.01) variability among genotypes in case of normal treatment. Under drought treatment, the genotypes also showed highly significant (p< 0.01) variation for all the traits except for FL. Values of CV also ranged from 1.04 (GOT% under N) to 11.87 (for NBP under WS) as given in Table 3 and 4.
Table 4: Results of analysis of variance (ANOVA) under water stress.
|
Source |
BW |
NBP |
CLCD |
DFF |
DFB |
PH |
Y |
FF |
GOT |
FL |
FS |
|
Rep (MS) |
0.0057 |
6.440 |
2.679 |
42.020 |
30.562 |
65.356 |
5935 |
0.097 |
3.574 |
1.544 |
107.224 |
|
Year (MS) |
0.5208 |
111.021 |
20.541 |
3.520 |
3.520 |
352.083 |
61992 |
18.625 |
245.255 |
10.735 |
59.630 |
|
Rep*Year (MS) |
0.0102 |
0.583 |
0.888 |
6.895 |
6.895 |
257.333 |
25 |
0.101 |
18.495 |
0.431 |
21.358 |
|
Variety (MS) |
0.8343 |
66.132 |
560.732 |
34.330 |
56.044 |
471.972 |
307906 |
0.333 |
12.639 |
1.910 |
9.432 |
|
Error (MS) |
0.0887 |
4.962 |
14.741 |
6.223 |
6.487 |
74.228 |
21881 |
0.061 |
1.527 |
0.905 |
1.807 |
|
F-value |
9.40 |
13.33 |
38.04 |
5.52 |
8.64 |
6.36 |
14.07 |
5.43 |
8.28 |
2.11 |
5.22 |
|
P-value |
0.0000 |
0.0000 |
0.0000 |
0.0002 |
0.0000 |
0.0001 |
0.0000 |
0.0003 |
0.0000 |
0.0684 |
0.0004 |
|
CV(%) |
11.84 |
11.87 |
7.89 |
7.62 |
3.52 |
12.54 |
10.98 |
7.34 |
3.31 |
3.45 |
4.36 |
BW: Average boll weight; NBP: Number of bolls per plant; CLCD: Cotton leaf curl disease incidence percentage; DFF: Days to first flowering; DFB: Days to first boll opening; FF: Fiber fitness; GOT: Ginning out term percentage; FL: Fiber length; FS: Fiber strength; PH: Plant height; Y: Yield.
Table 5: Average yield and drought indices for evaluation of cotton genotypes under water stress condition studied during 2018 and 2019.
|
Variety |
Y |
DI |
DSI |
GMP |
||||
|
2018 |
2019 |
2018 |
2019 |
2018 |
2019 |
2018 |
2019 |
|
|
SLH-105 |
1252 |
1177 |
-0.841 |
-0.952 |
3.19 |
3.05 |
1698 |
1589 |
|
SLH-106 |
1287 |
1233 |
-0.776 |
-0.631 |
3.33 |
3.59 |
1781 |
1822 |
|
SLH-107 |
1201 |
1114 |
-0.956 |
-1.157 |
3.06 |
2.86 |
1583 |
1430 |
|
SLH-108 |
1315 |
1238 |
-0.896 |
-0.769 |
3.23 |
3.30 |
1773 |
1756 |
|
SLH-109 |
1395 |
1328 |
-0.668 |
-0.725 |
3.50 |
3.38 |
1988 |
1908 |
|
SLH-110 |
1347 |
1267 |
-0.968 |
-0.649 |
3.17 |
3.54 |
1786 |
1862 |
|
SLH-111 |
1292 |
1233 |
-0.808 |
-1.135 |
3.32 |
2.88 |
1777 |
1592 |
|
FH-142 (std.) |
1351 |
1293 |
-0.336 |
-0.342 |
5.07 |
4.92 |
2153 |
2105 |
Y: Average yield (kg/ha); DI: Deficit irrigation; DSI: Drought susceptibility index; GMP: Geometric mean productivity.
Figures 1 (a and b) show dendrograms elaborating phenotypic linkage among cotton genotypes using average linkage between groups method under normal and water stress condition respectively. Similar performing genotypes grouped in same cluster in one environment whereas different performing genotypes grouped in different clusters. Cotton genotypes grouped differently in both dendrograms which emphasized differential in agro-morphic performance of cotton genotypes under both moisture regimes.
Under normal irrigation, entries grouped in 6 different cluster whereas under water deficit environment, genotypes grouped into 7 clusters (Figures 1 a and b).
Table 5 shows average yield and drought indices for evaluation of cotton genotypes under water stress condition studied during 2018 and 2019. The genotype SLH-109 showed highest average cotton yield (1395 and 328 kg/ha) under drought stress in both year 2018 and 2019 respectively, followed by drought tolerant check (FH-142) which exhibited second highest yield (1351 and 1293 kg/ha) in 2018 and 2019 respectively (Figure 2). Drought tolerance or water deficit stress tolerance was estimated using three different indices i.e. DI (deficit irrigation), DSI (drought susceptibility index) and GMP (geometric mean productivity) calculated for each genotype under stress environment during both the years of study. DI ranged from -0.336 (for FH-142 in 2018) to -1.157 (for SLH-107 in 2019), DSI ranged from 2.88 (for SLH-111 in 2019) to 5.07 (for FH-142 in 2018) and GMP ranged from 1430 (for SLH-107 in 2019) to 2153 (for FH-142 in 2018) as given in Table 5. These drought indices give estimation of fraction of reduction in yield owing to water deficit as compared to water required for normal growth and consequently to gain maximum expected cotton yield.
Correlation analyses
In order to understand the association among traits under normal as well as under water-deficit condition,
Table 6: Pearson correlation coefficients (r) with 2-tailed significance (p) values among studied agro-morphologic traits under normal irrigation.
|
CLCD |
Y |
NBP |
BW |
PH |
DFF |
DFB |
GOT |
FL |
FF |
||
|
Y |
r |
.047 |
|||||||||
|
p |
.751 |
||||||||||
|
NBP |
r |
-.151 |
.814** |
||||||||
|
p |
.307 |
.000 |
|||||||||
|
BW |
r |
-.148 |
.470** |
.457** |
|||||||
|
p |
.316 |
.001 |
.001 |
||||||||
|
PH |
r |
.108 |
.003 |
.136 |
-.218* |
||||||
|
p |
.463 |
.986 |
.356 |
.037 |
|||||||
|
DFF |
r |
.118 |
.284 |
.427** |
.261* |
-.044 |
|||||
|
p |
.424 |
.050 |
.002 |
.043 |
.765 |
||||||
|
DFB |
r |
.064 |
-.087 |
.114 |
-.117 |
.150 |
.673** |
||||
|
p |
.666 |
.558 |
.440 |
.427 |
.307 |
.000 |
|||||
|
GOT |
r |
.112 |
-.219* |
.164 |
-.188 |
.277* |
.241 |
.180 |
|||
|
p |
.450 |
.034 |
.266 |
.202 |
.046 |
.099 |
.221 |
||||
|
FL |
r |
.003 |
.312* |
.494** |
.235 |
.170 |
.379** |
.261 |
.330* |
||
|
p |
.985 |
.031 |
.000 |
.108 |
.247 |
.008 |
.073 |
.022 |
|||
|
FF |
r |
-.062 |
.655** |
.664** |
.584** |
-.012 |
.497** |
.310* |
-.036 |
.569** |
|
|
p |
.677 |
.000 |
.000 |
.000 |
.937 |
.000 |
.032 |
.810 |
.000 |
||
|
FS |
r |
.074 |
-.110 |
.291* |
-.047 |
.402** |
.411** |
.323* |
.765** |
.549** |
.246 |
|
p |
.618 |
.456 |
.045 |
.749 |
.005 |
.004 |
.025 |
.000 |
.000 |
.092 |
|
**: Correlation is significant at the 0.01 level (2-tailed); *: Correlation is significant at the 0.05 level (2-tailed); BW: Average boll weight; NBP: Number of bolls per plant; CLCD: Cotton leaf curl disease incidence percentage; DFF: Days to first flowering; DFB: Days to first boll opening; FF: Fiber fitness; GOT: Ginning out term percentage; FL: Fiber length; FS: Fiber strength; PH: Plant height; Y: Yield.
correlation coefficients values were estimated between traits separately for normal irrigation and water deficit environments as given in Table 6 and 7 respectively. Under normal irrigation condition, there was a strong / significant (p<0.01) positive correlation of cotton yield with NBP (r=0.814), BW (r=0.470), FF (r=0.655) and significantly (p<0.05) positive with FL (r=0.312) depicting that in case of studied traits and genotypes, Y was positively correlated with NBP, BW, FF and FL. In case of CLCD, no association was recorded under normal irrigation condition. NBP showed strongly (highly significant at p<0.01) positive association with BW (r=0.457), DFF (r=0.427), FL (r=0.494), FF (r=0.664) and significantly (p<0.05) positive association with FS (r=0.291) but negative (significant at p<0.05) with PH (r=-0.218). Likewise, PH had a strongly (highly significant at p<0.01) positive association with FS (r=0.402), but significantly (p<0.05) positive with GOT (r=-0.277) under normal irrigation condition. DFF showed a strong / significant (p<0.01) positive association with DFB (r=0.673), FL (r=0.379), FF (r=0.497) and FS (r=0.411); whereas DFB showed significantly (p<0.05) positive association with FF (r=0.310) and FL (r=0.323) under normal water requirements. GOT also showed highly significant (p<0.01) and positive association with FS (r=0.765) and significant (p<0.05) and positive association with FL (r=0.330). Similarly, FL showed highly significant (p<0.01) and positive association with FF (r=0.569) and FS (r=0.549) under normal water requirements.
Under water-deficit stress environment, the trend of associations among traits was changed depicting that the behavior of genotypes under study was different under moisture stress situation as compared to normal irrigation. Correlation coefficients along with probability (p-values) among studied traits are given in Table 7. Under drought stress condition, there was a strong / significant (p<0.01) positive association of cotton yield with NBP (r=0.853), PH (r=0.527) and significantly (p<0.05) positive with BW (r=0.288) and negative with GOT (r=-0.302), FS (r=-0.339) depicting that in case of studied traits and genotypes, Y was positively correlated with NBP, BW, PH, GOT and FS. In case of CLCD, Y (r=-0.443) and NBP
Table 7: Pearson correlation coefficients (r) with 2-tailed significance (p) values among studied agro-morphologic traits under water stress condition.
|
CLCD |
Y |
NBP |
BW |
PH |
DFF |
DFB |
GOT |
FL |
FF |
||
|
Y |
r |
-.443** |
|||||||||
|
p |
.002 |
||||||||||
|
NBP |
r |
-.370** |
.853** |
||||||||
|
p |
.010 |
.000 |
|||||||||
|
BW |
r |
.087 |
.288* |
.372** |
|||||||
|
p |
.558 |
.047 |
.009 |
||||||||
|
PH |
r |
-.140 |
.527** |
.414** |
.064 |
||||||
|
p |
.341 |
.000 |
.003 |
.665 |
|||||||
|
DFF |
r |
-.155 |
.090 |
.270 |
.148 |
-.128 |
|||||
|
p |
.292 |
.545 |
.064 |
.315 |
.385 |
||||||
|
DFB |
r |
-.061 |
-.070 |
.027 |
-.191 |
-.268 |
.681** |
||||
|
p |
.679 |
.635 |
.856 |
.194 |
.066 |
.000 |
|||||
|
GOT |
r |
.053 |
-.302* |
-.412** |
.012 |
-.174 |
.018 |
-.009 |
|||
|
p |
.721 |
.037 |
.004 |
.933 |
.236 |
.903 |
.953 |
||||
|
FL |
r |
-.014 |
.100 |
.111 |
.359* |
-.063 |
.289* |
.152 |
.463** |
||
|
p |
.925 |
.498 |
.451 |
.012 |
.672 |
.046 |
.303 |
.001 |
|||
|
FF |
r |
-.128 |
.110 |
-.098 |
.375** |
-.053 |
.107 |
-.023 |
.661** |
.535** |
|
|
p |
.385 |
.456 |
.506 |
.009 |
.720 |
.468 |
.878 |
.000 |
.000 |
||
|
FS |
r |
.252 |
-.339* |
-.233 |
.038 |
-.233 |
.242 |
.176 |
.342* |
.486** |
.288* |
|
p |
.044 |
.018 |
.111 |
.798 |
.111 |
.098 |
.231 |
.017 |
.000 |
.047 |
|
**: Correlation is significant at the 0.01 level (2-tailed); *: Correlation is significant at the 0.05 level (2-tailed); BW: Average boll weight; NBP: Number of bolls per plant; CLCD: Cotton leaf curl disease incidence percentage; DFF: Days to first flowering; DFB: Days to first boll opening; FF: Fiber fitness; GOT: Ginning out term percentage; FL: Fiber length; FS: Fiber strength; PH: Plant height; Y: Yield.
(r=-0.370) showed highly (significant at p<0.01) negative association with disease occurrence under water-deficit condition. However, FS showed significantly (p<0.01) positive association (r=0.252) with CLCD disease occurrence. These outcomes revealed that the occurrence of CLCuV disease was significantly higher under stress environment as compared to normal irrigation where crop experienced no stress. Further, disease reduced the cotton yield significantly and also caused significant reduction in number of bolls on plant and seriously injured the lint resulting in significant reduction in fiber strength of cotton genotypes. NBP showed strongly (highly significant at p<0.01) positive association with BW (r=0.372), PH (r=0.414) but strongly negative (significant at p<0.01) with GOT (r=-0.412). Likewise, BW had a strongly (highly significant at p<0.01) positive association with FL (r=0.359) and FF (r=0375) under water-deficit condition. DFF showed a strong / significant (p<0.01) positive association with DFB (r=0.681) and significantly (p<0.05) positive association with FL (r=0.289) under limited water availability. GOT also showed highly significant (p<0.01) and positive association with FL (r=0.463) and FF (r=0.661) but significant (p<0.05) and positive association with FS (r=0.342). Similarly, FL showed highly significant (p<0.01) and positive association with FF (r=0.553) and FS (r=0.486); whereas FF had significant (p<0.05) and positive association with FF (r=0.288) under water deficit stress.
AMMI analysis
Additive Main effects and Multiplicative Interaction (AMMI) analysis was used to study the adaptability and phenotypic stability of the studied cotton genotypes during two years separating the better performing genotypes under both environments on same scatter plot. This graphic on biplot was obtained by the combinations of the orthogonal axis of the calculated IPCAs. The biplot graphic interpretation was based on the variation caused by the main additive effects of genotype and environment, and the multiplicative effect of the G × E interaction (Kempton, 1984). The lower the IPCA1 values, the lower its contribution to the GEI (Genotypic × Environment Interaction), thus the more stable the genotype. The ideal genotype is one with high yield along with near-to-zero IPCA1 values (Gauch and Zobel, 1996). On the other hand, the undesirable genotypes have lower stability associated with lower yield (Ferreira et al., 2006). AMMI model divided the total variability into two components i.e. PC1 and PC2 which explained 90.45% and 9.55% of the total variability present in the GEI. The subsequent biplot successfully separated the environments and genotypes according to their performances in the respective mega-environment. The normal irrigation (denoted as controlled) fell within the upper region of the biplot whereas water-stress environment was in the right below corner of the biplot depicting that the all the genotypes showed higher yields in controlled (fully-irrigated) environment. Furthermore, water-stress environment was at longer distance from center point whereas the controlled was nearer to center point depicting that the controlled environment was more stable in terms of yield whereas the water-deficit environment was less stable (Figure 3). Genotypes nearer to the environments were best performing and the between the genotypes showed similar performances in both the environments. Check FH142 showed better performance in water-deficit condition whereas SLH109 was best among genotypes under normal condition, followed by SLH110 and SLH108 respectively. Genotypes SLH107 was worst performer in both the environments.
Conclusions and Recommendations
Results showed that the cotton genotypes responded differently in fully irrigated and drought stress conditions. All the studied agro-morphological traits and the disease incidence changed significantly under two different moisture regimes. Under water deficit environment, the skewness values changed showing change in gene action. All the traits showed more or less than zero values of skewness. For some traits such as CLCD, Y, BW, PH, DFB it was higher than zero and in case of NBP, DFF, GOT, FL, FF and FS, values of coefficients of skewness was less than zero. Under normal condition, coefficients of kurtosis (K) for all the traits is negative except CLCD, PH, DFF and under water deficit condition all the traits showed negative K values except for FL. Results of analysis of variance (ANOVA) indicated wide range of variability present in studied genotypes under both moisture regimes. Under normal irrigation, entries grouped in 6 different cluster whereas under water deficit environment, genotypes grouped into 7 clusters. Under drought stress condition, cotton yield had a strong positive association with NBP, PH and significantly positive with BW; whereas negative with GOT, FS.
These results depict that NBP, PH and BW are the major contributors towards yield under drought stress. Results also emphasized that water-deficit situation seriously impact GOT and FS in cotton. AMMI model divided the total variability into two components i.e. PC1 and PC2 which explained 90.45% and 9.55% of the total variability present. Check FH142 showed better performance in water-deficit condition whereas SLH109 was best among genotypes under normal condition, followed by SLH110 and SLH108 respectively. Genotypes SLH107 was worst performer in both the environments. The studied genotypes can be exploited as a new drought tolerant high yielding cotton variety and also as a genetic resource in various breeding programs with the aim to improve drought tolerance in cotton.
Novelty Statement
This research highlights the genetic variability of drought tolerance, which is one of the major abiotic stresses for cotton. As water scarcity is the global issue, development of drought tolerant varieties can enhance nation’s economy.
Author’s Contribution
Hafeez ur Rehman: Principal author, planned the research and collected data.
Umar Farooq: Conducted the experiments.
Muhammad Asim Bhutta: Helped in analysis, results and discussion.
Saghir Ahmad: Reviewed the literature.
Muhammad Akram: Helped in analysis
Muhammad Rafiq Shahid: Helped in data collection
Hammad Hussnain: Compilation of relevant literature
Muhammad Shahid: Helped in results findings.
Muhammad Mehmood Iqbal: Provided technical guidelines.
Ali Raza: Format setting.
Muhammad Iqbal: Helped in proofreading
Conflict of interest
The authors have declared no conflict of interest.
References
Abdelraheem, A. Esmaeili, N., O’Connell, M. and Zhang, J. 2019. Progress and perspective on drought and salt stress tolerance in cotton. Ind. Crops Prod., 130: 118–129. https://doi.org/10.1016/j.indcrop.2018.12.070
Anonymous, 2020. Economic Survey of Pakistan. Bureau of Statistics, Agriculture, chapter-2. https://www.finance.gov.pk/survey_2021.html
Burton, G.W. and E.W. de Vane. 1953. Estimating heritability in tall fescue (Festucaarundinacea) from replicates clonal material. Agron. J., 51: 515-518.
Chaves, M.M., Maroco, J.P. and Pereira, J.S. 2003. Understanding plant responses to drought from genes to the whole plant. Funct. Plant Biol., 30:239. https://doi.org/10.1071/FP02076
Choo, T.M. and E. Reinbergs. 1982. Analysis of skewness and kurtosis for detecting gene interaction in a double haploid population. Crop Sci., 22: 231-235. https://doi.org/10.2135/cropsci1982.0011183X002200020008x
Cotton Australia. 2020. Products and uses. https://cottonaustralia.com.au/uses-of-cotton
Fang, Y. and Xiong, L. 2015. General mechanisms of drought response and their application in drought resistance improvement in plants. Cell. Mol. Life Sci., 72 (4): 673–689. https://doi.org/10.1007/s00018-014-1767-0
Fashion United, 2019. Global fashion industry statistics. https://fashionunited.com/global-fashion-industrystatistics/
Fernández, G.C.J. 1992. Effective selection criteria for assessing plant stress tolerance. Proceedings of the International Symposium on “Adaptation of Vegetables and other Food Crops in Temperature and Water Stress”. Taiwan, 257-270.
Ferreira, D.F., Demétrio, C.G.B., Manly, B.F.J., Machado, A.A. and Vencovsky, R. 2006. Statistical models in agriculture: biometrical methods for evaluating phenotypic stability in plant breeding. Cerne, 12: 373-388.
Fischer, R. and Maurer, R. 1978. Drought resistance in spring wheat cultivars. I. Grain yield responses. Aust. J. Agric. Res., 29: 897–912. https://doi.org/10.1071/AR9780897
Gauch, H.G. and Zobel, R.W. 1996. AMMI analysis of yield trials. Chap. 4. p. 85-122. In: Kang, M.S.; Gauch, H.G., eds. Genotype by environment interaction. CRC Press, Boca Raton, FL, USA. https://doi.org/10.1201/9781420049374.ch4
Grishanov, S. 2011. Structure and properties of textile materials (Ch. 2). In Clark, M. (Ed.), Handbook of textile and industrial dyeing (Vol. 1) (pp. 28–63). Woodhead Publishing. http://www.sciencedirect.com/science/article/pii/B9781845696955500027
Kempton, R.A. 1984. The use of biplots in interpreting variety by environment interactions. J. Agric. Sci., 103: 123-135. https://doi.org/10.1017/S0021859600043392
Kotch, G.P., R. Ortiz and W.M. Ross. 1992. Genetic analysis by use of potato haploid populations. Genome, 35: 103-108. https://doi.org/10.1139/g92-018
Loka, D.A., D.M. Oosterhuis and G.L. Ritchie. 2011. Stress physiology in cotton: Water-deficit stress in cotton. The Cotton Foundation, Cordova, Tennessee (USA), pp: 37-72.
Lu, S. 2018. Market size of the global textile and apparel industry: 2016 to 2021/2022. FASH455 global apparel & textile trade and sourcing. https://shenglufashion.com/2018/12/18/market-size-of-the-global-textile-and-apparelindustry-2016-to-2021-2022
Mordor Intelligence. 2018. Global cotton market-Segmented by geography- Growth, trends, and forecast (2019–2024). https://www.mordorintelligence.com/industry-reports/cotton-market
Ashwini, S.N.R., S. Hittalmani, N. Shashidhar and H. Biradar. 2011. Exploratory Studies on Genetic Variability and Genetic Control for Protein and Micronutrient Content in F4 and F5 Generation of Rice (Oryza sativa L.). Asian J. Plant Sci., 10 (7): 376-379. https://doi.org/10.3923/ajps.2011.376.379
OECD-FAO. 2019. Agricultural outlook (Edition 2019). https://doi.org/10.1787/eed409b4-en
Pakistan Economic Survey. 2020-21. Agriculture, 2021. pp. 20-21. https://www.finance.gov.pk/survey_2021.html
Passioura, J.B. 2006. The perils of pot experiments. Functional Plant Biol., 33 (12): 1075–1079. https://doi.org/10.1071/FP06223
Pooni, H.S., J.L. Jinks and M.A. Cornish. 1977. The causes and consequences of non-normality in predicting the properties of recombinant inbred lines. Heredity, 38: 329-338. https://doi.org/10.1038/hdy.1977.95
Powell, J. and Reinhard, S. 2016. Measuring the effects of extreme weather events on yields. Weather Clim. Extrem., 12: 69–79. https://doi.org/10.1016/j.wace.2016.02.003
Snedecor, G.W. and W.G. Cochran. 1967. Statistical Methods. 6th Edn., Oxford and IBH Publishing Co. Pvt. Ltd., New Delhi, India, Pages: 593
Tridge. 2019. HS 52 Cotton. https://www.tridge.com/trades/HS1992/52-cotton/export
Ullah, A., Sun, H., Yang, X. and Zhang, X. 2017. Drought coping strategies in cotton: increased crop per drop. Plant Biotechnol. J., 15: 271–284. https://doi.org/10.1111/pbi.12688
Volkan, S., Huseyin, B., Ceng, P., Talih, G. and Kadir, K. 2015. Screening of cotton cultivars for drought tolerance under field conditions. Turk J. Field Crops., 20(2): 223-232. https://doi.org/10.17557/tjfc.57032
Voltas, J., H. Lopez-Corcoles and G. Borras. 2005. Use of biplot analysis and factorial regression for the investigation of superior genotypes in multi environment trials. European J. of Agron., 22 (03): 309–324. https://doi.org/10.1016/j.eja.2004.04.005
Wilhite, D.A., Sivakumar, M.V. and Pulwarty, R. 2014. Managing drought risk in a changing climate: the role of national drought policy. Weather Clim. Extrem., 3: 4–13. https://doi.org/10.1016/j.wace.2014.01.002
Zahid, Z., Khan, M.K.R., Hameed, A., Akhtar, M., Ditta, A., Hassan, H.M. and Farid, G. 2021. Dissection of drought tolerance in upland cotton through morpho-physiological and biochemical traits at seedling stage. Front. Plant Sci., https://doi.org/10.3389/fpls.2021.627107
To share on other social networks, click on any share button. What are these?


