
Figure 3:
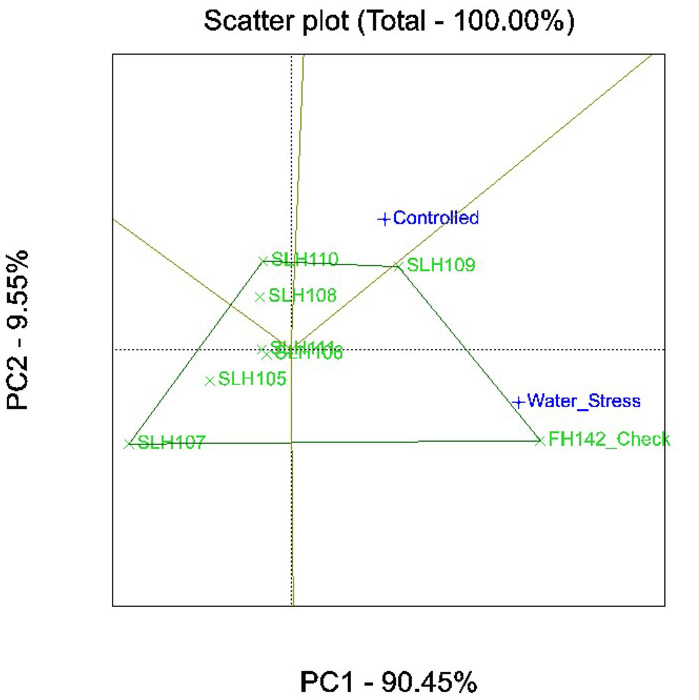
Scatter plot of AMMI model to predict the better performing genotypes in stress and non-stress environment in terms of yield (kg/ha).
Scatter plot of AMMI model to predict the better performing genotypes in stress and non-stress environment in terms of yield (kg/ha).