Genetic Study of Cotton (Gossypium hirsutum L.) Genotypes for Different Agronomic, Yield and Quality Traits


Research Article
Genetic Study of Cotton (Gossypium hirsutum L.) Genotypes for Different Agronomic, Yield and Quality Traits
Ehtisham Shakeel Khokhar1*, Amir Shakeel1, Muhammad Amir Maqbool1, Muhammad Waheed Anwar1, Zoraiz Tanveer1 and Muhammad Fahad Irfan2
1Department of Plant Breeding and Genetics, University of Agriculture, Faisalabad, Pakistan; 2Department of Economics and Agricultural Economics, PMAS Arid Agriculture University, Rawalpindi, Pakistan.
Abstract | The present investigations were carried out to study the genetic variability, coefficient of variations, heritability, genetic advance and correlation among 20 F1 hybrids and 9 parents in upland cotton. Line × tester mating design was deployed to develop crosses and 29 cotton genotypes were field planted in randomized complete block design (RCBD) in three replications to assess the genotypes for plant height (cm), number of sympodial branches, number of monopodial branches, seed cotton yield (g), number of bolls, boll weight (g), lint percentage (%), fiber strength (g/tex), fiber length (mm) and fiber fineness (µg/inch). Analysis of variance revealed significant differences at 1% level of significance for all traits except fiber fineness. The mean performance of F1 populations were better than parents. Maximum GCV was recorded for number of monopodial branches followed by number of sympodial branches and seed cotton yield. High broad sense heritability estimates were reported for seed cotton yield and all yield contributing traits except fiber quality with high response to selection. High heritability with genetic advance suggested vigorous phenotypic selection in breeding population for the improvement of crop traits. The correlation coefficient depicted that seed cotton yield is positively associated with other yield contributing traits suggesting that more than one trait can be used as indirect selection criteria in segregating populations.
Received | November 12, 2017; Accepted | December 07, 2017; Published | December 11, 2017
*Correspondence | Ehtisham Shakeel Khokhar, Department of Plant Breeding and Genetics, University of Agriculture, Faisalabad, Pakistan; Email: ehtishamshakeel@hotmail.com
Citation | Khokhar, E.S., A. Shakeel, M.A. Maqbool, M.W. Anwar, Z. Tanveer, M.F. Irfan. 2017. Genetic study of cotton (Gossypium hirsutum L.) genotypes for different agronomic, Yield and quality traits. Pakistan Journal of Agricultural Research, 30(4): 363-372.
DOI | http://dx.doi.org/10.17582/journal.pjar/2017/30.4.363.372
Keywords | Genetic variability, Coefficient of variation, Heritability, Genetic advance, Correlation
Introduction
Cotton is most important economical crop grown in more than 70 countries of the world. Cotton is primarily grown for fiber but it is also an important source of edible oil, protein and cottonseed meal for animals. Cotton fiber in Old World and its by-products in New World have dominated the economy of developing and developed countries. In Pakistan, history of cotton ink back to civilization of the Mohen Jo Daro as depicted by excavations (Khan, 2003). Cotton is most important commercial crop mainly grown for fiber in Punjab and Sindh provinces. Pakistan is fourth largest producer and third largest consumer of cotton. Cotton contribute a pivotal role in continuous growth of our economy. Pakistan earns major of its foreign reserves directly or indirectly from cotton through textile industry. It contributes 7.0 percent value added to agriculture and 1.5 percent to GDP. According to an estimate (ICAC, world cotton statistics bulletin, September, 2009) one million bales increase in cotton production means 0.5% increase in the GDP of Pakistan. During 2012-13, area under cotton cultivation was increased by 1.6% as compared to previous year (2835 thousand hectares) but the production was restricted to 13.0 million bales as compared to the set target of 14.4 million bales. (ESP, 2012-13). There is fluctuation in country’s cotton yield and it is very low as compared to other cotton growing countries. Factors responsible for low cotton production includes, high temperature, erratic pattern of temperature and rainfall at flowering stage, cotton leaf curl disease (CLCuD), high input cost, sucking insect pest and lack of resistant and tolerant varieties in major cotton growing areas.
Cotton breeders have continued their efforts to exploit the cotton germplasm to develop high yielding cotton varieties with acceptable fiber quality. Peohlman and Selper (1995) clarified that yield contributing and fiber quality traits are heritable in nature. Thus, quantitative and qualitative traits can be improved by utilizing appropriate breeding program by developing new cross combinations. For this very purpose, breeders were interested to have sufficient knowledge of genetic components such as genetic variability, coefficient of variation, heritability and genetic advance to devise the breeding plan in accordance to their breeding objectives (Dhamayanathi et al., 2010; Ali and Khan, 2007). Plant breeders always encouraged the genetic variability in breeding populations and considered it as the initial requirement to screen the genetic material for different biotic and abiotic stresses. This genetic variability is further exploited by utilizing different statistical tools. Heritability is an effective statistical tool that helps the plant breeder to estimate the environmental influence for various traits in breeding nursery. It is also effective index to determine the extent of trait that is transferred from parents to off springs. Thus, heritability when coupled with genetics advance and genetic variability could be powerful tool for plant researcher to select proper breeding program (Chandio et al., 2003; Baloch et al., 2004).
Earlier researchers have reported moderate to high heritability estimates for yield and yield contributing traits. Abbas et al. (2008) reported high heritability coupled with higher genetic advance for yield and yield contributing traits. (Aziz et al., 2014; Srinivas et al., 2014; Ashan et al., 2015; Waqar et al., 2016; Nizami et al., 2017) reported moderate to high heritability for boll weight, number of boll, lint percentage, seed cotton yield, fiber length and fiber strength. Genotypic, phenotypic and environmental coefficient of variation for qualitative and quantitative traits were studied by Dhivya et al. (2014), Dahiphale et al. (2015), Shao et al. (2016), Adsare et al. (2017). Keeping in view the importance of genetic studies of different qualitative and quantitative traits, the present investigations was carried out to study heritability, genetic advance, genetic variability and coefficient of variation for seed cotton yield and yield contributing traits among parents and different single cross F1 combinations.
Materials and Methods
Genetic material
During spring 2011-12, 20 single cross F1 hybrids were developed in glass house by utilizing the nine parent’s viz. VH-259, IUB-222, CRS-456, AA-703, KZ-191, PB-39, CIM-608, BH-163 and PB-900 following the line × tester mating design. Five genotypes i.e. VH-259, IUB-222, CRS-456, AA-703 and KZ-191 were used as seed parents (lines) and four were used as pollen parents i.e. PB-39, CIM-608, BH-163 and PB-900 (testers).
Field evaluation of parents and hybrids
Twenty hybrids along with their 9 parents were field planted at research area of Department of Plant Breeding and Genetics (PBG), University of Agriculture, Faisalabad (UAF) in randomized complete block design (RCBD) in two rows of 5 meter for each genotype with 75 cm row to row and 30 cm plant to plant distance during Kharif 2013. Standard agronomic and plant protection practices were followed throughout the cropping season.
Data Collection
At maturity, data were recorded for following traits; plant height (cm), number of monopodial branches , number of sympodial branches, number of bolls, boll weight (g), lint percentage (%), seed cotton yield (g), fiber fineness (µg/inch), fiber strength (g/tex) and fiber length (mm). The fiber length is the distance between the ends of fiber. Likewise the fiber fineness is the diameter of fiber while fiber strength is the strength of fiber divided by its density. Lint samples were subjected to the Fiber Testing Laboratory, Department of Fiber and Textile Technology, University of Agriculture, Faisalabad for analysis of fiber traits such as; fiber strength (g/tex), fiber length (mm) and fiber fineness (µg/inch).
*: Significant at 5% level of significance; **: Highly significant at 1% level of significance.
Data analysis
The data were subjected to analysis of variance (Steel et al., 1997). Genotypic and phenotypic correlation coefficient were calculated by using the formulae given by Kown and Torrie (1964). Genotypic (GCV) and phenotypic coefficients of variance (PCV) were estimated by Burton and Devane (1953). Broad sense Heritability was calculated according to Honson et al. (1956) and genetic advance as per Johnson et al. (1955).
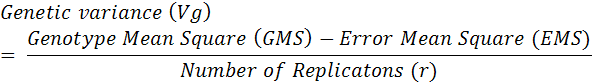


Genotypic coefficient variation (GCV), phenotypic coefficient variation (PCV) and Environmental coefficient of variation (ECV) were calculated as following;
Where;
GCV%: genotypic coefficient of variation; Vg: genotypic variance; PCV%: phenotypic coefficient of variation; Vp: genotypic variance; ECV%: environmental coefficient of variation; Ve: environmental variance.
Heritability (H2) on Entry Mean Basis was calculated as following;

The expected Genetics advance was calculated as;
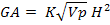
Where;
K: 1.40 at 20% selection intensity for trait; Vp: phenotypic variance for trait; H2: broad sense heritability of the trait; Genetic Advance (GA) as percentage of mean is calculated as following;
Where;
GA: expected genetic advance; x̅: grand mean
Results and Discussion
The mean square from analysis of variance showed highly significant (P<0.01) differences among cotton genotype for plant height (cm), number of monopodial branches, number of sympodial branches, number of bolls, boll weight (g), lint percentage (%), seed cotton yield (g), fiber strength (g/tex) and fiber length (mm) except indicating the presence of considerable genetic variability except fiber fineness (µg/inch) (Table 1). Mean performance of parents and F1 hybrids for all traits under study were depicted through graphs (Figures 1, 2, 3, 4, 5, 6, 7, 8, 9 and 10). Data is further subjected for the estimation of heritability (H2), genetic advance (GA%), genotypic coefficient of variation (GCV%), phenotypic coefficient variation (PCV%) and environmental coefficient of variation (ECV%) and were presented in Table 2. Genotypic correlation coefficient (rg) and phenotypic correlation coefficient (rp) among seed cotton yield and other characters were presented in Table 3.
Mean performance of genotypes
Mean performance of the parental lines and single cross combination for plant height ranged from 99.67-120.37cm and 87.80-140.57cm respectively (Figure 1). The parents, PB-900 (120.37cm) displayed maximum plant height followed by PB-39 (119.30cm) and IUB-222 (112.37cm) while BH-163 (97.13cm) recorded the shortest plant height followed
Table 2: Genotypic, phenotypic and environmental variance and coefficient of variation, broad sense heritability and genetic advance.
| Traits | GV | GCV % | PV | PCV % | EV | ECV % |
(H2) |
Exp. GA | GA (%) |
| Plant height | 208.85 | 13.19 | 222.17 | 13.60 | 13.32 | 3.33 | 0.94 | 28.02 | 25.57 |
| No. of monopods | 0.196 | 24.23 | 0.22 | 25.50 | 0.019 | 7.05 | 0.91 | 0.84 | 46.45 |
| No. of sympods | 16.56 | 23.38 | 19.57 | 25.42 | 3.01 | 9.36 | 0.84 | 7.48 | 43.01 |
| Boll weight (g) | 0.13 | 10.70 | 0.17 | 12.17 | 0.040 | 5.80 | 0.77 | 0.65 | 18.81 |
| No. of bolls | 19.48 | 13.82 | 2.85 | 14.80 | 2.85 | 11.64 | 0.87 | 8.24 | 25.81 |
| Seed cotton yield (g) | 459.87 | 19.36 | 587.44 | 21.88 | 127.5 | 10.20 | 0.78 | 37.94 | 34.25 |
|
Lint percentage (%) |
15.45 | 11.68 | 17.17 | 12.31 | 1.71 | 3.89 | 0.90 | 7.45 | 22.16 |
| Fiber length (µg/Inch) | 0.20 | 1.60 | 0.30 | 1.99 | 0.10 | 1.18 | 0.64 | 0.72 | 2.57 |
| Fiber strength (g/tex) | 0.81 | 3.97 | 1.33 | 5.07 | 0.51 | 3.16 | 0.61 | 1.41 | 6.25 |
| Fiber Fineness (µg/Inch) | 0.0010 | 0.62 | 0.0086 | 1.81 | 0.00764 | 1.70 | 0.12 | 0.022 |
0.42 |
GV: Genotypic variance; GCV%: Genotypic coefficient of variance; PV: Phenotypic variance; PCV%: Phenotypic coefficient of variance; GV: Environmental variance; ECV%: Environmental coefficient of variance; H2: Heritability; GA: Genetic advance.
Table 3: Genotypic and Phenotypic correlation in cotton for different traits.
| Traits | PH | NMB | NSB | BW | NOB | SCY | LP | FL | |
| NOS |
rg |
0.241 | |||||||
|
rp |
0.274 | ||||||||
| NOB |
rg |
-0.031 | -0.539 | ||||||
|
rp |
-0.035 | -0.543 | |||||||
| BW |
rg |
-0.196 | -0.528 | 0.656 | |||||
|
rp |
-0.192 | -0.543 | 0.612 | ||||||
| SCY |
rg |
-0.274 | -0.221 | 0.192 | 0.531 | ||||
|
rp |
-0.246 | -0.327 | 0.192 | 0.523 | |||||
| LP |
rg |
-0.246 | -0.544 | 0.540 | 0.932 | 0.729 | |||
|
rp |
-0.238 | -0.548 | 0.503 | 0.887 | 0.720 | ||||
| FL |
rg |
-0.166 | -0.365 | 0.352 | 0.768 | 0.319 | 0.708 | ||
|
rp |
-0.162 | -0.378 | 0.330 | 0.749 | 0.293 | 0.671 | |||
| FS |
rg |
0.190 | -0.229 | 0.341 | 0.261 | 0.238 | 0.284 | 0.228 | |
|
rp |
0.188 | -0.273 | 0.303 | 0.255 | 0.185 | 0.236 | 0.196 | ||
| FF |
rg |
0.152 | -0.047 | -0.231 | 0.004 | -0.168 | 0.109 | 0.206 | 0.160 |
|
rp |
0.119 | 0.031 | -0.204 | 0.016 | -0.060 | 0.115 | 0.206 |
0.154 |
|
PH: Plant height; NMB: Number of monopodial branches; NSB: Number of sympodial branches; BW: Boll weight; NOB: Number of bolls; SCY: seed cotton yield; LP: Lint percentage; FL: Fiber length; FS: Fiber Strength; FF: Fiber Fineness.
by VH-259 (99.67cm). Among F1 hybrids it was observed that, VH-259 × CIM-608 (140.57cm) and IUB-222 × PB-900 (140.53cm) showed maximum plant height. However, lowest plant height was recorded for CRS-456 × PB-900 (92.20cm) and AA-703 × BH-163 (92.40cm).
The monopodial branches follow the growth pattern of main stem and bear indirect fruit. More number of monopodial branches increase the vegetative growth of cotton plant delaying its reproductive phase. For short duration and early maturing cotton cultivar breeders prefer less or no monopodial branches. The mean for monopodial branches ranged from 1.97-2.37 and 1.3-2.3 for parental lines and F1 hybrids (Figure 2). Among parents, KZ-191 (1.17) produced minimum numbers of monopodial branches followed by PB-39 (1.70) while maximum number of monopodial branches were recorded by AA-703 (2.50) followed by VH-259 (2.37). The F1 cross combinations, VH-259 × PB-900 (1.3), AA-703 × CIM-608 (1.3) and AA-703 × PB-900 (1.3) had displayed minimum number of monopodial branches (Figure 2). In case of sympodial branches mean value ranged from 9.63-22.43 for parents and 12.40-24.43 for F1 combinations (Figure 3). It was observed that among parents, KZ-191 (22.43) displayed maximum number of sympodial branches followed by IUB-222 (21.00) however, PB-900 (9.63) and BH-163 (11.20) produced minimum number of sympodial branches. The new cross combinations, AA-703 × PB-900 (24.43) and VH-259 × BH-163 (23.30) exhibited maximum number of sympodial branches while VH-259 × PB-39 (12.40) displayed minimum number of sympodial branches (Islam et al., 2013).
Mean of seed cotton yield ranged from 68.67-122.17g for parental lines and 82.97-145.10g for F1 hybrids (Figure 4). Among parents, the genotypes, IUB-222 (122.17g) gave the maximum seed cotton yield followed by AA-703 (118.39g) while lowest seed cotton yield was recorded by PB-900 (68.67g). The F1 hybrid, AA-703 × PB-900 (151.13g) displayed max-
imum seed cotton yield followed by VH-259 × BH-163 (145.10g) and IUB-222 × PB-900 (136.90g). The biggest boll weight among parents was recorded for AA-703 (4.12g) followed by CRS-456 (4.04g) while the lowest bolls weight was observed for CIM-608 (3.06g) and PB-900 (3.08g). However among F1 cross combinations, AA-703 × PB-900 (4.17g) and IUB-222 × BH-163 (4.12g) showed maximum boll weight followed by AA-703 × CIM-608 × BH-163 (3.95g). The mean for parental lines and new cross combinations for boll weight were depicted in Figure 5.
Maximum number of bolls among parents were displayed by CRS-456 (36.13) followed by IUB-222 (34.16) however PB-900 (22.03) and BH-163 (22.76) had displayed minimum number of bolls. The new cross combinations, AA-703 × CIM-608 (37.80), AA-703 × PB-39 (37.60), KZ-191 × BH-163 (37.66) and VH-259 × CIM-608 (37.40) had exhibited maximum number of bolls. The mean for boll weight of parental lines and cross combinations were ranged from 3.08-4.12 and 2.72-4.17 respectively. Mean performance of parents for lint percentage revealed that IUB-222 (36.40%) displayed maximum lint percentage followed by AA-703 (34.37%) while lowest lint percentage was recorded for BH-163 (25.09%). Similarly, among crosses, it was observed that cross combinations, VH-259 × PB-39 (41.55%) and AA-703 × CIM-608 (41.17%) displayed maximum lint percentage.
Fiber quality parameters such as fiber length and fiber strength are of great importance in textile industry. The advancement of textile industry remarkably enhances the importance of fiber quality traits. Cotton breeders put their emphasis to improve the fiber quality without compromising the yield. The Genotypes among parents, CIM-608 (25.43g/tex) declared as best with maximum value for fiber strength while AA-703 (21.36g/tex) displayed minimum fiber strength. However, the highest fiber length among parents were measured for KZ-191 (28.55mm) and AA-703 (28.35mm) while CIM-608 (27.28mm) was ranked as lowest with minimum fiber length. The F1 hybrid, AA-703 × CIM-608 (25.15 g/tex) displayed maximum fiber strength followed by AA-703 × BH-163 (24.37 g/tex) while VH-259 × CIM-608 (28.99mm) displayed maximum fiber length followed by CRS-456 × PB-39 (28.80mm).
The overall mean performance of genetic material for different economical traits of present study revealed prominent amount of variability. But, it was observed that none of the genotype was superior for all traits simultaneously. Previously, Islam et al. (2013), Srinivas et al. (2014), Dahiphale et al. (2015), Raza et al. (2016) and Nizamani et al. (2017) assessed the cotton germplasm and reported significant amount of genetic variability for yield and yield contributing traits.
Genotypic, phenotypic and environmental coefficient of variation
The range of genotypic, phenotypic and environmental variance for different developmental and economical traits were presented in Table 2. Saleem et al. (2016) clarified that presence and magnitude of genetic variability determined the breeding value of economically important traits in segregating populations and declared it as prerequisite for the success of breeding program. Cotton breeders were more interested to have adequate amount of information regarding genotypic variance to made effective selection in breeding populations as the plant traits were also influenced by environmental effects (Mahaingam et al., 2013). The estimates of GCV and PCV ranged from 1.60% to 24.23% and 1.99% to 25.50% respectively. The highest GCV and PCV effects were found for number of monopodial branches (24.23%, 25.50% respectively) followed by number of sympodial branches (23.38%, 25.42% respectively), seed cotton yield (19.36%, 21.88% respectively), number of bolls (13.82%, 14.80% respectively), plant height (13.19%, 13.60% respectively), lint percentage (11.68%, 12.31% respectively), boll weight (10.70%, 12.17% respectively). However, the smallest GCV and PCV were found for fiber strength (3.97%, 5.07%) and fiber length (1.60%, 1.99%). Fiber length and fiber strength showed low GCV and PCV values suggested that there is less span for the improvement of these traits and cotton breeders must exploit germplasm from diverse sources to identify the genetic variability in breeding populations. The environmental coefficient of variation (ECV) was highest for number of bolls (11.64%) followed by seed cotton yield (10.20%) and number of sympodial branches (9.36%) which suggested that these traits were considerable influenced by environmental factors. Moderate to high GCV and PCV values ranged from 10-15 percent suggested vigorous selection in early generation for the improvement of traits under study except fiber quality. Selection in early generations with moderate to high GCV and PCV were also recommended by Ahsan et al. (2015), Shao et al. (2016) and Adsare et al. (2017) for seed cotton yield and yield contributing traits.
Broad sense heritability
Heritability (h2) estimates, genetic variance (σ2g), phenotypic variance (σ2p) and environmental variance (σ2e) were presented in Table 2. The genetic variance (208.85) was almost equal to phenotypic variance (222.17) for plant height resulted in high broad sense heritability (0.94%) while genetic advance was 28.02. Thus, high heritability estimates were associated with higher genetic variance and low environmental variance (13.32). For number of monopodial branches, the genotypic (0.19) and phenotypic (0.22) variance were equal suggesting considerable amount of variability with high heritability (0.91%) coupled with adequate amount of response to selection (0.84). Present finding revealed that inheritance of monopodial branches were less affected by environmental variance (0.019). Thus, genetic variance played important role in the inheritance of monopodial branches and intensive selection in early generation will reduce the vegetative branches. Genetic variability with higher heritability estimates for number of monopodial branches were reported by Ahmed et al. (2008). Higher heritability (0.84) and genetic advance (7.84) were reported for fruiting branches. Environmental variance (3.01) was low as compared to genotypic (16.56) and phenotypic variance (19.57). Higher heritability and response to selection clarified that fruiting branches were under the influence of genetic variance and early selection can made reasonable improvement. In case of seed cotton yield the genotypic variance (459.87) was lowered as compared to phenotypic variance (587.44) suggesting that this plant character is under considerable influence of environmental factors. Moderate to high heritability (.78%) and response to selection (37.94) was recorded for sympodial branches. Boll weight manifested higher genetic variance (19.48) which is very close to phenotypic variance (22.33) as a results higher heritability (0.77) and response to selection (0.65) was achieved. Low environmental variance (0.040) depicted the importance of genetic variances and suggested that the boll weight is least effected by environmental factors. For number of bolls, the genetic variance (19.48) is almost equal to phenotypic variance (22.33). High heritability (0.87) and response to selection (8.24) was reported for number of bolls. Low environmental variance (2.85) may lead to high heritability estimates. The genotypic variance (15.45) was lower to phenotypic variance (17.17) for lint percentage. Hence, high heritability (0.90) estimates and response to selection (7.45) was achieved. The environmental variance (1.71) was much lower than genetic variance suggesting that lint percentage is considerably control by genotypic factors. For fiber length and fiber strength the genetic variances (0.20, 0.81) were lower as compared to phenotypic variances (0.30, 1.33). Low heritability (0.64, 0.61) estimates were recorded for fiber length and fiber strength suggested that these traits were greatly influenced by environmental factors.
Present investigation revealed that high heritability estimates were reported for plant height, number of sympodial branches, number of monopodial branches, boll weight, number of bolls, seed cotton yield and lint percentage. However, low heritability was reported for fiber strength and fiber length. High heritability estimates highlighted the importance of genetic variance and depicted that variation among most of the traits were under the influence of genetic factors except fiber quality. Khan et al. (2010), Batool et al. (2010), Ahmed et al. (2011), Aziz et al. (2014), Raza at al. (2016) and Nizamani et al. (2017) reported high heritability estimated for seed cotton yield and yield contributing traits. More genetic influence with lower environmental factors predicted that most of the traits were controlled by additive type of gene action. Thus, phenotypic selection is recommended for the improvement of these traits under investigation except fiber quality. Present findings were in accordance with Abbas et al. (2013) and Dhivya et al. (2014).
Correlation coefficient (r)
Genotypic and phenotypic correlation among various plant traits for 29 cotton genotypes were presented in Table 3. It was observed that genotypic correlation coefficient (rg) displayed higher magnitude when compared to phenotypic correlation coefficient (rp) for seed cotton yield, yield contributing characters and fiber quality. Thus, most of the trait in current investigations were greatly under the influence of genetic factors. The seed cotton yield was positively correlated with number of bolls, boll weight and number of sympodial branches at genotypic and phenotypic level while it was negatively correlated with fiber length and fiber strength. Lint percentage displayed positive correlation with number of sympodial branches, number of bolls and boll weight at both levels whereas, lint percentage was negatively correlated with plant height and number of monopodial branches. Genotypic and phenotypic coefficient correlation for boll weight showed positive correlation with number of sympodial branches, lint percentage and fiber quality traits such as fiber length and fiber strength, however boll weight was negatively correlated with number of monopodial branches. Number of sympodial branches were positively correlation at genotypic and phenotypic level with all traits under investigation except number of monopodial branches. Plant height is positively correlated with number of sympodial and monopodial branches while plant height had negative correlation with rest of the traits under investigation at both levels. Fiber strength had positive correlation with all traits under study at genotypic and phenotypic level whereas, fiber strength is negatively correlated with number of monopodial branches. Like present findings, positive correlation for yield and yield contributing traits were reported by Dahipale et al. (2005), Zheng et al. (2007), Alkuddasi et al. (2013), Ahsan et al. (2015) and Shao et al. (2016).
Conclusions
Present study revealed that there is considerable genetic diversity among various cotton genotypes for seed cotton yield and yield contributing traits except fiber quality. Coefficient correlation at genotypic and phenotypic level displayed positive association among major economical and fiber traits. High heritability estimate for most of the traits confirmed the predominance of genetic factors and vigorous selection in early generation is recommended for the improvement of crop traits.
Author’s Contributions
Ehtisham Shakeel Khokhar: Planned and executed the research experiment. Also acquired the data from field and prepared the manuscript, Amir Shakeel: Supervised the research experiment by helping in the planning, execution, analyzing, writing and proofreading, Muhammad Amir Maqbool: Contributed in data analysis, results explanations and manuscript preparation, Muhammad Waheed Anwar: Assisted in data acquisition from the field and performing the lab quality analysis, Zoraiz Tanveer: Prepared the excel sheets of data for data analysis and also assisted in manuscript write up and Muhammad Fahad Irfan: Prepared the graphs and tables for presentation in manuscript and also assisted in formatting of manuscript.
References
Adsare, A.N. and Abhay, N.S. 2017. Study on genetic variability for the quantitative traits in some genotypes of upland cotton (Gossypium hirsutum L.). Biosci. Discovery. 8(3): 365-368.
Ahmad, M., Khan, N.U., Mohammad, F., Khan, S.A., Munir, I., Bibi, Z. and Shaheen, S. 2011. Genetic potential and heritability studies for some polygenic traits in cotton (G. hirsutum L.). Pak. J. Bot. 43(3): 1713-1718.
Ahsan, M.Z., Majidano, M.S., Bhutto, H., Soomro, A.W. Panhwar, F.H., Channa, A.R., Sial, K.B. 2015. Genetic Variability, coefficient of variance, heritability and genetic advance of some Gossypium hirsutum L. accessions.
Ali, M. A. and I.A. Khan. 2007. Assessment of genetic variation and inheritance mode of some metric traits in cotton (Gossypium hirsutum L.). J. Agric. Soc. Sci. 3: 112-116.
Alkuddsi, Y., Rao, M.R., Patil, S.S., Joshi, M., Gowda, T.H. 2013. Correlation and path coefficient analysis between seed cotton yield and its attributing characters in intra hirsutum cotton hybrids. Mol.plant Breed. 4: 214-219. https://doi.org/10.5376/mpb.2013.04.0026
Baloch, M.J. 2004. Genetic variability and heritability estimates of some polygenic traits in upland cotton. Pak. J. Sci. Ind. Res. 42(6): 451-454.
Batool, S., Khan, N.U., Makhdoom, K., Bibi, Z., Hassan, G., Marwat, K.B., Farhatullah, F., Raziuddin M. and Khan, I.A. Heritability and genetic potential of upland cotton genotypes for morpho-yield traits. 2010. Pak. J. Bot. 42(6): 1057-1064.
Burton, G.W. and Devane, E.M. 1953. Estimating heritability in fall fescue (Festecd cirunclindcede) from replicated clonal material. 1953. Agron. J. 45: 478-481. https://doi.org/10.2134/agronj1953.00021962004500100005x
Dahiphale, K.D., Deshmukh, J.D., Jadhav, A.B. and Bagade, A.B. 2015. Genetic variability and correlation for yield and its attributing traits in cotton (Gossypium hirsutum L). Int. J. Trop. Agric. 33(1): 15-22.
Dhamayanathi, K.P.M., Manickam, S. and Rathinaval, K. 2010. Genetic variability studies in Gossypium barbadense L. genotypes for seed cotton yield and its components. Elec. J. Plant. Breed. 1(4): 961-965.
Dhivya, R., Amalabalu, P., Pushpa, R. and Kavithamani, D. 2014. Variability, heritability and genetic advance in upland cotton (Gossypium hirsutum L.). 2014. Afr. J. Plant Sci. 8(1): 1-5. https://doi.org/10.5897/AJPS2013.1099
Hanson, C.H. Robinson, H.F. and Comstock, R.E. 1965. Biometrical studies of yield in segregating populations of Korean Lespedeze. Agron. J. 48:314-318.
Islam, M.K., M. Akhteruzzaman and D. Sharmin. 2013. Multivariate and genetic component analysis of new cotton (Gossypium hirsutum L.) genotypes. Bangladesh J. Prog. Sci. Techno. 11(2): 185-190.
Johnson, H.W., Robinson, H.E. and Comstock, R.E. 1955. Estimate of genetic and environmental variability in soybean. Agron. J. 47: 314-318. https://doi.org/10.2134/agronj1955.00021962004700070009x
Khan, N.U., Marwat, K.B., Hassan, G., Farhatullah, Batool, S., Makhdoom, K., Ahmad, W. and Khan, H.U. 2010. Genetic variation and heritability for cottonseed, fiber and oil traits in G. hirsutum L. Pak. J. Bot. 42(1): 615-625.
Khan, S.A., Khan, N.U., Mohammad, F., Ahmad, M., Khan, I.A., Bibi, Z. and Khan, I.U. 2011. Combining ability analysis in intraspecific F1 diallel cross of upland cotton. Pak. J. Bot. 43(3): 1719-1723.
Kwon, S.H. and Torrie, J.H. 1964. Heritability and interrelationship among traits of two soybean population. Crop Sci. 4: 194–8. https://doi.org/10.2135/cropsci1964.0011183X000400020023x
Nizamani, F., Baloch, M.J., Baloch, A.W., Buriro, M., Nizamani, G.H., Nizamani M.R. and Baloch, I.A. 2017. Genetic distance, heritability and correlation analysis for yield and fibre quality traits in upland cotton genotypes. 2017. Pak. J. Biotechnol. 14 (1): 29-36.
Poehlman, J.M. and Sleper, D.A. 1995. Breeding field crops. 4th Edn. Panima Publishing Corporation. New Dehli. India.
Raza, H., Khan, N.U., Khan, S.A., Gul, S., Latif, A., Hussain, I., Khan, J., Raza, S., Baloch, M. 2016. Genetic variability and correlation studies in F4 populations of upland cotton. J. Anim. Plant Sci. 26(4): 1048-1055.
Saleem, S., Kashif, M., Hussain, M., Khan, A. and Saleem, F.A. 2016. Genetic behavior of morpho-physiological traits and their role for breeding drought tolerant wheat. Pak. J. Bot. 48(3): 925-93.
Shao, D., Wang, T., Zhang, H., Zhu, J. and Tang, F. 2016. Variation, heritability and association of yield, fiber and morphological traits in a near long staple upland cotton population. Pak. J. Bot. 48(5): 1945-1949.
Srinivas, B., Bhadru, D., Rao, M.V.B. and Gopinath, M. 2014. Genetic studies in yield and fiber quality traits in American cotton (Gossypium hirsutum L.). 2014. Agric. Sci. Digest. 34 (4): 285-288. https://doi.org/10.5958/0976-0547.2014.01021.0
Tabasum, A., I. Aziz, M.J. Asghar and Iqbal M.Z. 2012. Inheritance of seed cotton yield and related traits in cotton (G. hirsutum L.). Pak. J. Bot. 44(6): 2027-2031.
Waqar, Ali, S., Malik, M.F. and Akram, Z. 2016. Genetic variability among quality traits in cotton varieties. Merit Res. J. Agric. Sci. Soil Sci. 4(6): 086-089.
Zeng, L., Meredith, W.R., Boykin D.L. and Taliercio, E. 2007. Evaluation of an exotic germplasm population derived from multiple crosses among Gossypium tetraploid species. J. Cotton Sci. 11: 118-127.