
Figure 3
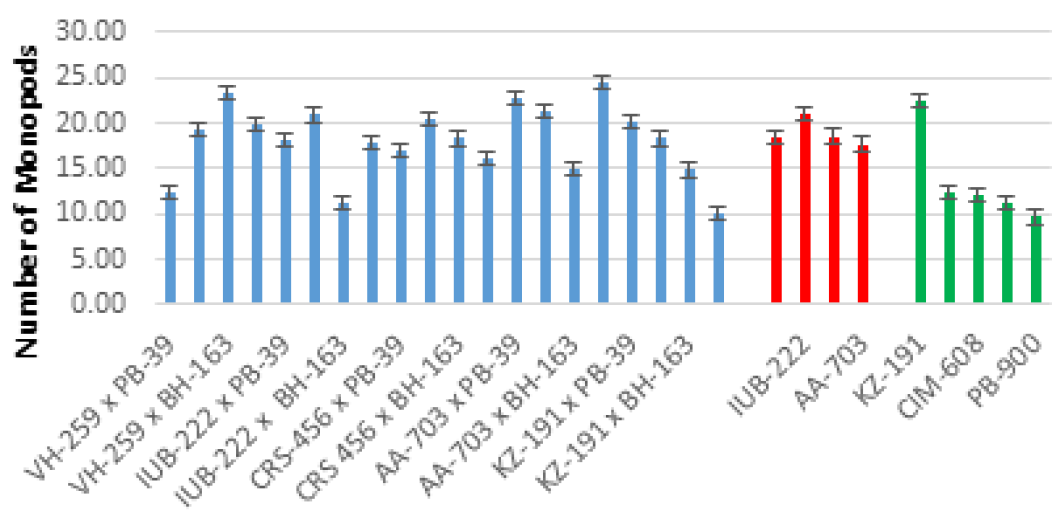
Bar graphs representing the mean values of Number of sympodial branches for crosses and parents (red bars are representing the female parents and green bars are representing male parents).
Bar graphs representing the mean values of Number of sympodial branches for crosses and parents (red bars are representing the female parents and green bars are representing male parents).