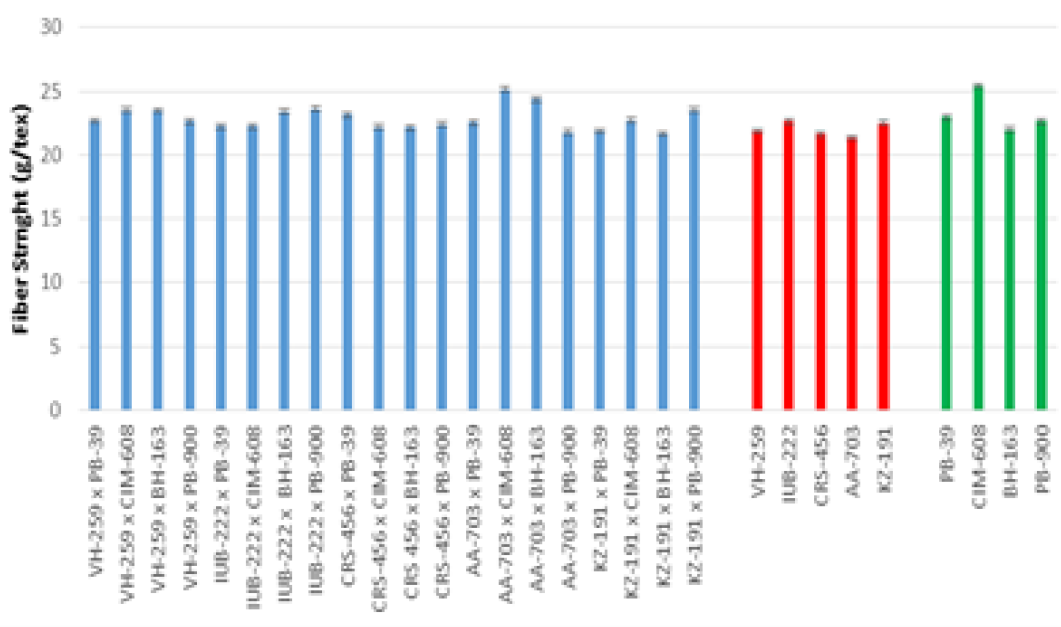
Figure 8
Bar graphs representing the mean values of Fibre Strength (g/tex) for crosses and parents (red bars are representing the female parents and green bars are representing male parents).
Bar graphs representing the mean values of Fibre Strength (g/tex) for crosses and parents (red bars are representing the female parents and green bars are representing male parents).