Effect of Different Fallow Tillage Systems Integrated with Glyphosate Herbicide on Soil Moisture Dynamics and Wheat Grain Yield


Research Article
Effect of Different Fallow Tillage Systems Integrated with Glyphosate Herbicide on Soil Moisture Dynamics and Wheat Grain Yield
Safdar Ali1*, Ghulam Abbas Shah1, Muhammad Naveed Tahir1, Shahid Mehmood2, Asim Gulzar3 , Ijaz Ahmad4 and Bashir Ahmad Khan5
1Department of Agronomy,Pir Mehr Ali Shah, Arid Agriculture University, Rawalpindi, Pakistan; 2Department of Environmental Sciences, Pir Mehr Ali Shah, Arid Agriculture University, Rawalpindi, Pakistan; 3Department of Entomology, Pir Mehr Ali Shah, Arid Agriculture University, Rawalpindi, Pakistan; 4Ecotoxicology Research Institute, National Agricultural Research Centre Islamabad, Pakistan; 5Department of Agricultural Economics, Pir Mehr Ali Shah Arid Agriculture University Rawalpindi.
Abstract | Sustainability of the soil productivity and soil moisture conservation are two major problems of rainfed agriculture. Thus, to address these issues, a two year field study was carried out at Agronomic Research Area of University Research Farm of PMAS-Arid Agriculture University Rawalpindi during 2012-14.The effects of different tillage systemscombined with glyphosate herbicide on soil moisture content,bulk density and porosity associated with wheat grain yield were evaluated. Seven tillage treatments were applied in the fallow periods (summer seasons) of both years before sowing of wheat crop. These tillage treatments were (i) Once Mould board plowing followed by 8 cultivations with planker (1 MBP + 8 CS) as a check, (ii) No-till followed by twice application of glyphosate herbicide (NT + GH), (iii) Once Mould board plowing followed by twice application of glyphosate herbicide (1 MBP + GH), (iv) Once Mould board plowing followed by 4 cultivations with planker (1 MBP + 4 CS), (v) Once disc harrowing followed by twice application of glyphosate herbicide (1 DH + GH), (vi) Once disc harrowing followed by 4 cultivations with planker (1 DH + 4 CS)and (vii) Once chisel plowing followed by twice application of glyphosate herbicide (1 CP + GH). Results of two year study showed integrated use of glyphosate and tillage systems in general did not affect soil moisture content (P > 0.05). However, soil moisture content was 9% higher in NT + GH as compared to check (1 MBP + 8 CS; P ≤ 0.05). Soil moisture content was significantly higher at 30-45 cm soil depth as compared to top soil (0-30 cm; P ≤ 0.05). Besides, higher soil moisture content was measured at wheat developmental stage relative to other stages (P ≤ 0.05). Soil porosity was significantly higher and bulk density was significantly lower under two statistically similar treatments, i.e. 1 MBP + 8 CS as well as 1 MBP + 4 CS.The wheat production was significantly affected by deep tillage systems having highest and statistically similar yield under the treatments,i.e. 1 MBP + 8 CS as well as 1 MBP + 4 CS. The regression analysis proved that soil moisture content and bulk density have a great association with tillage systems, whereas, the correlation analysis proved that soil porosity and tillage intensity have a strong and positive correlation with wheat grain yield. In conclusion soil moisture dynamics can be improved by combine use of no-till and glyphosate herbicide (NT + GH)while soil porosity, its productivity and wheat economical yield in rainfedagriculture can be enhance by once mould board plowing following 4 cultivations with planker (1 MBP + 4 CS). However, further long term investigations are recommended tostudy the dynamics of conserved soil moisture under conservation tillage system.
Received | August 28, 2017; Accepted | December 10, 2017; Published | December 12, 2017
*Correspondence | Safdar Ali, Department of Agronomy,Pir Mehr Ali Shah, Arid Agriculture University, Rawalpindi, Pakistan; Email: safdaraliarid@yahoo.com
Citation | Ali, S., G.A. Shah, M.N. Tahir, S. Mehmood, A. Gulzar, I. Ahmad and B.A. Khan 2017. Effect of different fallow tillage systems integrated with glyphosate herbicide on soil moisture dynamics and wheat grain yield. Pakistan Journal of Agricultural Research, 30(4): 386-398.
DOI | http://dx.doi.org/10.17582/journal.pjar/2017/30.4.386.398
Keywords | Tillage, Glyphosate, Bulk density, Porosity, Moisture dynamic, Rainfed, Wheat yield
Introduction
Soil moisture content is the only resource of water for crop production in rainfed agriculture (Mweso, 2003). Moisture is generally the restraining parameter of crop yields (Lindwall, 1984). Soil particles arrangement and moisture dynamics are reliant on soil properties, tillage types and prevailing climatic conditions (Celik et al., 2011; A’lvaro-Fuentes et al., 2012). The soil moisture fluctuations are of most significance for semi-arid zones (Lindwall, 1984). Soil moisture is extraordinarily imperative to make sure good and uniform seed germination and sprout emergence (Arsyid et al., 2009). Organic matter percentage and soil pore spaces play a critical role in the efficiency and hydrology of cultivated soils. Soil pore spaces may be having different sizes, shapes and continuity which influence the infiltration, storage and drainage of soil-water, the translocation and circulation of gases and the penetration of growing roots into the soil (Kay and Bygaart, 2002). According to Holland (2004), conventional tillage damages soil makeup by nonstop soil disturbance, compression that results in soil degradation through wind and water erosion. Frequent tillage ultimately adds to the cost of production of crops by boosting fuel expenses. Soil disturbance through intensive tillage operations also amends its features that are connected with growth of plants such as moisture, temperature, nutrients and aeration (El-Titi, 2003).In contrast, conservation tillage systems are the source of continuous enhancement in soil nutritional status, but may or may not have slight effect on crop yield (Małecka et al., 2012). The basic fundamentals of conservation agriculture include very little or no soil disturbance, direct drilling of seed into previously untilled soil, crop rotation, and enduring soil cover (Derpsch, 2007). Unimpressive response of soil to reduced and no tillage results into a little uptake of nitrogen by the crop plants due to its halt in the soil profile, greater soil bulk density, cooler temperatures in the winter seasons and resistance of the soil to penetration of crop roots that impede the growth of the plant root system (Angas et al., 2006). The biological, chemical and physical properties of soil which are interrelated can be modified by reduced or minimum tillage (Thomas et al., 2007). The No-till system augment the deposition of diverse plant biomass like weeds on undisturbed soil surface especially in fallow season due to increases its moisture content after rainfall. However, it can accelerate soil microbial activity, improve aggregate structure and soil physic-chemical properties predominantly nitrogen content, organic matter percentage, organic carbon content and cation exchange capacity of soil; whereas, it decreases carbon nitrogen ratio (Madejon et al., 2009; Naudin et al., 2010; Derpsch et al., 2010; Moussa-Machraoui et al., 2010; Benitio, 2010; Celik et al., 2011; A’lvaro-Fuentes et al., 2012). Conservation agriculture is spreading rapidly worldwide, but a little work has been done in Pakistan’srainfed cropping system especially in Pothwar Region. As all agro-ecosystems are different; therefore, this study could be very much helpful for better planning of moisture conservation, soil improvement and yield enhancement of different crops for this region (Derpsch, 2007).
Conventionally bred herbicide tolerant (CHT) and genetically modified herbicide-tolerant (GMHT) crops have changed weed management practices and made an important contribution to the global production of some commodity crops (Lamichhane et al., 2017). Herbicides are currently the backbone of weed management in intensive crop production systems (Heap, 2014). In such systems, effective weed management without herbicides is inconceivable in the short-term. However, improvements and/or adoption of the knowledge and technologies of integrated weed management (IWM) can achieve large gains in herbicide reduction with consequential lower risks of herbicide resistance evolution. For example, weeds are more likely to evolve resistance to some herbicide sites of action (e.g. ALS inhibitors) than others (Heap, 2014). Glyphosate (N- (phosphonomethyl) glycine) is a broad-spectrum systemic herbicide and crop desiccant. It is an organophosphorus compound, specifically a phosphonate. It is used to kill weeds, especially annual broadleaf weeds and grasses that compete with crops. It was discovered to be an herbicide by Monsanto chemist John E. Franz in 1970 (Franz, 1974). Glyphosate is absorbed through foliage, and minimally through roots (Sprankle et al., 1975; Jump 2015; Jump, 2013) and transported to growing points. It inhibits a plant enzyme involved in the synthesis of three aromatic amino acids: tyrosine, tryptophan, and phenylalanine. Therefore, it is effective only on actively growing plants and is not effective as a pre-emergence herbicide. So this herbicide can easily destroy the fallow period weeds to make a dead weeds mulch on the soil for summer moisture conservation up to winter season.Water/moisture that is an important factor for the crop growth and development is becoming limited day by day in Pakistan. Therefore, it is the need of time to conserve water during its excessive availability to cope the water deficit conditions and the evaluation of this technology in our agro-ecology is necessary before its adaptation. A number of studies have been conducted on crop productivity in this rainfed area (Ali et al., 2014; Ali et al., 2016a; 2016b; 2016c; Sadaf et al., 2017), yet there is lack of systematic study of soil physico-chemical properties dynamics under conservation tillage systems in wheat. In the light of the above mentioned facts, it was hypothesized that integration of conservation tillage and non-selective systemic herbicide Glyphosate (Round up) applied at fallow period in summer before seed drilling may prove an effective way of creating dead weeds mulch for soil moisture conservation that will ultimately sustain soil productivity in this area. To test this hypothesis, a two-year comprehensive field study was carried out to investigate the effect of different tillage practices along with glyphosate application on bulk density, porosity and moisture contents of soil and wheat yield.
Materials and Methods
Experimental details
Site description: A field experiment was conducted at Agronomic Research Area of University Research Farm of PMAS-Arid Agriculture University Rawalpindi on a sandy loam soil during 2012-14 having co-ordinates (latitude 33°N, longitude 73° E and altitude 500 masl) in Rawalpindi District of Pakistan.
Experimental design: The experiment was laid down in Randomized Complete Block Design (RCBD) with factorial arrangement having four replications. The net plot size was 13.5 m × 13.5 m.
Treatments: Seven tillage treatments integrated with glyphosate herbicide @ 2.5 L ha-1 viz. T1: Once Mould board plowing followed by 8 cultivations with planker (1MBP + 8CS) as check, T2: No-till followed by twice application of glyphosate herbicide (NT + GH) where first application of glyphosate was done at first flush of weeds and second application of glyphosate was done at second flush of weeds,, T3: Once Mould board plowing followed by twice application of glyphosate herbicide (1MBP + GH), T4: Once Mould board plowing followed by 4 cultivations with planker (1MBP + 4CS), T5: Once disc harrowing followed by twice application of glyphosate herbicide (1DH + GH), T6: Once disc harrowing followed by 4 cultivations with planker (1DH + 4CS) and T7: Once chisel plowing followed by twice application of glyphosate herbicide (1CP + GH) were used before sowing of wheat crop.
This study was carried out for two years i.e. 2012-13 and 2013-14. The tillage treatments integrated with glyphosate were applied in summer seasons while; crops were grown in winter seasons of both years as per the requirements of the treatments. A wheat cultivar Chakwal-50 was used as test cultivar. Its seed was taken from Barani Agricultural Research Institute Chakwal. The crop sowing was done on October 23, in 2012 and on October 28, in 2013 having 22.5 cm row to row distance. The fertilizers were incorporated at the rate of 90-60-60 kg ha-1 N-P-K respectively in the form of urea (46% N), di-ammonium phosphate (DAP) (18%N, 46% P2O5) and sulfate of potash (50% K2O). Nitrogen fertilizer was applied in two splits i.e. first split was applied at the time of sowing; whereas, second split was given at tillering stage of wheat. Phosphorus and potash fertilizers were incorporated fully at the time of preparation of seed bed.
Soil Sampling: Soil samples were collected through king tubes of 2.5 cm diameter for the study of soil moisture contents from a depth of 0-15, 15-30 and 30-45 cm in W shape from each plot and then a composite sample was made to take a working sample at pre-sowing stage, developmental stage (90 DAS) and post-harvesting stage of wheat, whereas, samples were taken from three places in each plot with the help of soil core sampler of 5 cm diameter and 5 cm length from only 0-15 cm soil depth at pre-sowing and post-harvesting stage of wheat for the determination of soil bulk density and porosity and then average was taken.
Data collection
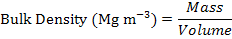
Bulk density of soil (Mg m-3): To determine the bulk density of soil, a core sampler having 0.05 m length and 0.05 m diameter was used at sowing and harvesting stage of wheat for each treatment. For this purpose the soil core sampler was penetrated into the soil up to the depth of 0-15 cm for filling the inner vacuum of metal cylinder. Later on the soil out of the box was scratched with the knife. This soil was then poured in metal tins and put into the oven at 105 ̊C up to the constant weight and it was weighed before and after oven drying. The bulk density of soil was calculated using following formula;
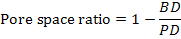
Porosity of soil (%): The soil porosity was calculated from predetermined particle density and bulk density of soil as follows:


Soil water contents (%): Soil water contents were determined from 0-15 cm, 15-30 cm and 30-45 cm soil depths through gravimetric method before sowing of wheat, at tillering stage of wheat and at post-harvesting stage of wheat. Fresh soil samples were taken through king tubes having 2.5 cm diameter in the metallic cans and weights were recorded through electric balance. Afterwards, the samples were dried in the oven at 105 C˚ till the constant weight. Then samples were removed from the oven and dry weights were recorded. Water content at each depth was averaged and converted to a percent basis for respective treatment, stage and depth using following formula given by (SAA, 1977).

Yield of wheat (t ha-1): For having wheat yield, crop was harvested from three places of one square meter area and tied in to bundles. The bundles were sundried for one week and the crop was threshed with mini wheat thresher located at URF to separate the grains from straw. The grain yield of each plot was weighed through electronic balance and it was converted into tonns per hectare.
Statistical tools used
A computer software MSTAT-C (Crop and Soil Sciences Department of Michigan State University of the United States) was used to analyze the data collected for all parameters. Factorial ANOVA was applied to analyze the data. Least significance difference test was applied at 5% level of probability to compare the treatments means (Steel et al., 1997). Statistix 8.1 version software was used to draw regressions and correlations between different study parameters. A computer software PAST version 2.17c was used for performing Cluster analysis (Hammer et al., 2001).
Results and Discussion
Meteorological observations
There was a significant variation in weather data of two years. In 1st year of study (month 1 to 12) the moon soon rains in fallow period were lower than normal but rainfall was highest during crop growth period (month 4) that attributed to good establishment of wheat crop during this year (Figure 1), whereas, rainfall was received maximum in summer season (during fallow period) of 2nd year of study and there was a long drought spell initiating from the time of sowing to developmental stage of wheat that attributed to poor germination and development of wheat in 2nd year of study. Although there was an abnormal spell of rains at maturity stage of wheat, that also negatively affected the crop in 2nd year (month 13 to 24).
Soil bulk density (Mg m-3)
The data regarding bulk density are presented in (Table 2). In both years, the bulk density was recorded from 0-15 cm soil depth at pre-sowing and post-harvesting stage of wheat. The mean bulk density of soil was affected significantly by different tillage systems, sowing years and sampling stages. In case of tillage systems, maximum bulk density was recorded in no-till system followed by the treatment where once disc harrowing followed by glyphosate was applied. Minimum bulk density was recorded in the treatments of deep tillage with mould board plough followed by 8 and 4 shallow cultivations with cultivator, but they were statistically at par with each other. The bulk density was significantly higher in 2013-14 as compared with 2012-13 (Table 2). Moreover, it was also significantly higher at pre-sowing stage than post-harvesting stage. The interaction between sowing years and sampling stages was found significant and it was found that bulk density was significantly lower at post-harvesting stage of 2012-13 as compared with all other treatments (Table 2). The regression line was drawn between bulk density and wheat grain yield and that showed a negative effect of bulk density on grain yield (Figure 2) i.e the grain yield was decreased with increase of bulk density.
Table 1: Soil physico-chemical properties of experimental site (Pooled for two years).
| Characteristics | Soil Depth (cm) | |
| 0-15 | 15-30 | |
| Textural class | Loam | Loam |
| Ph | 7.35 | 7.36 |
| Electrical conductivity | 0.79 | 0.82 |
| Saturation percentage | 36 | 36 |
| Organic matter (%) | 0.68 | 0.60 |
|
Total nitrogen (mg kg-1) |
340 | 298 |
|
Available phosphorus (mg kg-1) |
5.1 | 4.4 |
|
Extractable potassium (mg kg-1) |
100 |
100 |
Soil porosity (%)
The data regarding total porosity (%) of soil are presented in (Table 2). The mean porosity was affected significantly under different tillage systems, sowing years and sampling stages. Highest soil porosity was recorded under the treatment where once mould board ploughing was run followed by 8 cultivations that was followed by other deep tillage treatment with mould board plow following 4 shallow cultivations. These both treatments were statistically at par with each other. Minimum porosity was noted under the treatment where no-till system was applied. In case of sowing seasons, porosity was significantly higher in 2012-13 as compared with 2013-14. Similarly soil porosity was recorded significantly higher at post-harvesting stage in comparison with pre-sowing stage of wheat (Table 2). The interaction between sowing years and sampling stages was found significant and it was found that soil porosity was significantly higher at post-harvesting stage of 2012-13 as compared with all other treatments. A regression line was drawn between soil porosity and wheat grain yield and it was found that there was a positive and strong relationship between grain yield and soil porosity (Figure 3).
Soil moisture contents (%)
Soil moisture contents were measured in both years under each tillage treatment from three soil depths i.e. 0-15 cm, 15-30 cm and 30-45 cm at three times i.e. at pre-sowing stage of wheat, at developmental stage of wheat and at post-harvesting stage of wheat. In the mean data of two years it was found that tillage systems and sowing years did not affect the soil moisture contents significantly (Figure 4). However, soil moisture content was 9% higher in NT + GH as compared to check (1 MBP + 8 CS; P ≤ 0.05).
Table 2: Soil bulk density and porosity (Mean ± SE) as influenced by tillage system, sowing year and sample stage.
| Tillage System (T) | Soil Bulk Density (Mgm-3) | Soil Porosity (%) |
| 1 MBP + 8 CS | 1.53 ± 0.05*c | 42 ± 2.0a |
| NT + GH | 1.68 ± 0.05 a | 37 ± 1.7 c |
| 1 MBP + GH | 1.60 ± 0.05 abc | 40 ± 1.9abc |
| 1 MBP + 4 CS | 1.54 ± 0.05 c | 42 ± 1.8 a |
| 1 DH + GH | 1.64 ± 0.04ab | 38 ± 1.3bc |
| 1 DH + 4 CS | 1.58 ± 0.04bc | 40 ±1.7 ab |
| 1 CP + GH | 1.59 ± 0.06bc | 40 ± 2.1ab |
| LSD Values | 0.09 | 3.40 |
| Sowing Year (Y) | ||
| 2012-13 (Y1) | 1.52 ± 0.03b |
43± 1.1 a |
| 2013-14 (Y2) | 1.67 ± 0.02a | 37± 0.7 b |
| LSD Values | 0.05 | 1.8 |
| Sampling Stage (S) | ||
| Pre-sowing (S1) | 1.68 ± 0.02a | 37± 0.7 b |
| Post-harvesting (S2) | 1.52 ± 0.03b | 43± 1.1 a |
| LSD Values | 0.05 | 1.8 |
| Interaction | ||
| T × Y | NS | NS |
| T × S | NS | NS |
| T × Y × S | NS | NS |
| S × Y | ** (P<0.01) |
** (P<0.01) |
| S1 × Y1 | 1.69 ± 0.03a | 37±1b |
| S1 × Y2 | 1.67 ±0.03a | 37 ± 1 b |
| S2 × Y1 | 1.36 ± 0.03b | 49± 0.9 a |
| S2 × Y2 | 1.68 ± 0.02a | 37 ± 0.9 b |
| LSD Values | 0.07 |
2.5 |
*: Any two means in a column within tillage system or sowing year or sampling stage not sharing a common letter differ significantly at 5% level of probability; **: Highly Significant; NS: Non-significant; MBP: Mouldboard ploughing; NT: No tillage; GH: Glyphosate herbicide; CS: Cultivations; DH: Disc harrowing; CP: Chisel ploughing (Ali et al., 2016c).
Minimum moisture was recorded under the conventional tillage system where one deep plowing was conducted following 8 shallow cultivations with cultivator that was statistically at par with all other treatments. In 2013-14 the mean moisture contents were higher than 2012-13 that were statistically at par with each other (Figure 5). However soil moisture contents were significantly different under three soil depths and at three sampling stages (Figure 6). Maximum moisture was recorded at 30-45 cm soil depth and minimum moisture was found at 0-15 cm soil depth that was statistically at par with medium soil depth i.e. 15-30 cm. Similarly significantly high-
er moisture was recorded at developmental stage of wheat followed by post harvesting stage, whereas, minimum moisture was recorded at pre-sowing stage of wheat (Figure 7). The interaction between sowing years and sampling stages was found significant. Maximum moisture was recorded from developmental stage of wheat in 2012-13 and it was minimum at pre-sowing stage of wheat in same year (Figure 8). The interaction was highly significant between sampling stages and soil depths. Maximum moisture was recorded from 30-45 soil depth at developmental and post-harvesting stage that were statistically at par with each other and minimum moisture was recorded from 15-30 cm soil depth at pre-sowing stage of wheat (Figure 9).
Table 3: Wheat grain yield as influenced by tillage system and sowing year.
| Tillage system | Wheat Grain Yield (t ha-1) | ||
| Sowing year | |||
| 2012-13 | 2013-14 | Means | |
| 1 MBP + 8 CS | 4.01 a* | 3.80 ab* | 3.90 a* |
| NT + GH | 3.01 bc | 2.87 bc | 2.94 bc |
| 1 MBP + GH | 2.91 bc | 3.59 ab | 3.25 abc |
| 1 MBP + 4 CS | 3.39 ab | 3.55 ab | 3.47 ab |
| 1 DH + GH | 3.04 abc | 2.10cd | 2.57 c |
| 1 DH + 4 CS | 3.11 ab | 3.18 ab | 3.15 bc |
| 1 CP + GH | 3.36 ab | 1.77 d | 2.56 c |
| Means | 3.26 NS | 2.98 |
3.12 |
*: Any two means within a column or row not sharing a common letter differ significantly at 5% level of probability; NS: Non-significant; MBP: Mouldboard ploughing; NT: No tillage; GH: Glyphosate herbicide; CS: Cultivations; DH: Disc harrowing; CP: Chisel ploughing.
Wheat grain yield (t ha-1)
The grain yield is the ultimate product of all yield components of wheat. The overall data regarding grain yield are given in (Table 3). The data revealed that the tillage systems significantly affected the grain yield; whereas, sowing years did not affect the grain yield significantly. The interaction of tillage systems and sowing years was also found significant. Maximum grain yield (3.90 t ha-1) was obtained in 1 Mould board plowing + 8 cultivations that was statistically at par with 1 Mould board plowing + glyphosate and 1 Mould board plowing + 4 cultivations; whereas, minimum grain yield (2.56 t ha-1) was recovered in 1 Chisel plowing + glyphosate followed by 1 Disc harrowing + glyphosate and No-till + glyphosate (Table 3 and Figure 11). In 2012-13, the grain yield was slightly better as compared to 2013-14, but statistically non-significant (Table 3). In case of interaction of tillage systems and sowing years, maximum grain yield was achieved in 1 Mould board plowing + 8 cultivations during 2012-13, followed by 1 Mould board plowing + 8 cultivations in 2013-14, 1 Mould board plowing + glyphosate during 2013-14 and 1 Mould board plowing + 4 cultivations during 2013-14; while minimum grain yield was attained in case of 1 Chisel plowing + glyphosate followed by 1 Disc harrowing + glyphosate and No-till + glyphosate during 2013-14 (Table 3).
Bulk density is an important physical property of soil that is directly or indirectly responsible for the root penetration of crops, infiltration rate of water and aeration of soil. It also has a great influence on soil aeration and movement and uptake of nutrients and water. The bulk density of a soil gives an indication of the soil’s strength and thus resistance to tillage implements or plants as they penetrate the soil. Bulk densities in excess of 1.6 Mg m-3 can restrict root growth and result in low levels of water movement into and within the soil. The higher bulk density under (NT + GH) may be due to non-disturbance of soil which may have ultimately reduced the porosity and infiltration rate of water and consequently the moisture content may have increased in (NT + GH) at all soil depths if properly crop residues are retained (Table 2). The mean bulk density of 2013-14 was significantly higher than 2012-13 this higher bulk density in 2013-14 may be due to very low rainfall in 2013-14 as compared with 2012-13 and it may also be due to the effect of minimum disturbance of soil under conservation tillage treatments which may have ultimately reduced the porosity and infiltration rate of water. The mean bulk density of two years at pre-sowing stage was significantly higher than post-harvesting stage of wheat that may be due to no or minimum disturbance of soil under conservation tillage treatments. The results are in line with Hossain et al. (2004), who recorded that the bulk density of soil was increased significantly by no-tillage. According to Aikins and Afuakwa (2012), the bulk density was increased in no-till over disc harrowing and disc ploughing. Similarly, Małecka et al. (2012) reported an increase in the soil bulk density value of 0.15 Mg m-3 in the surface soil layer at 0-5 cm soil depth in reduced tillage, while no-tillage caused an increase bulk density (0.30 Mg m-3) over conventional tillage. He also found non-significant differences in bulk density between tillage systems at 10-20 cm soil depth. Higher penetration resistance and soil bulk density under tillage with rotavator (minimum tillage) over tillage with cultivator (conventional tillage) was recorded by (Ahmad et al., 2010).
Porosity is also another important soil physical property that has great influence on soil water recharge. Porosity is the opponent of bulk density, if bulk density increases then porosity decreases unquestionably. The higher total porosity under (1MBP + 8CS) may be due to maximum disturbance of soil through frequent and intensive tillage, which may have ultimately increased the porosity and consequently the moisture use efficiency, whereas, the significantly lower porosity in no-till treatment may be due to continuously non disturbance of soil in both years (Table 2). The overall mean total porosity in 2012-13 was significantly higher than 2013-14 that may be due to previous cultural practices adopted at experimental soil that was decreased with the passage of time under conservation tillage practices. The mean total porosity at post-harvesting time was significantly higher than pre-sowing stage of wheat that may be due to crop residues retained on the soil surface in conservation tillage treatments. Similar results were reported by Aikins and Afuakwa (2012), who stated that tillage practices significantly affected soil porosity for both the 0–10 cm and 10–20 cm soil layers where the disc ploughing followed by disc harrowing treatment produced the highest total porosity while the No-tillage treatment gave the lowest total porosity. Higher total porosity in the tilled plots compared with the No-tillage plots for organic soils of North Central Ohio was also reported by (Elder and Lal, 2008). According to Auskalnis, (2005), in comparison of conventional and conservation soil tillage methods there was significant effect on soil bulk density, structure and total porosity.
It is obvious from the data shown (Figures 4, 5, 6, 7, 8 and 9) that tillage systems and sowing years had not significant effect on soil moisture content, but the mean moisture content of three sampling stages differed significantly from each other in all the three soil depths. The reason behind non-significant results for tillage systems may be that the higher moisture contents of deepest soil layer, i.e. 30-45 cm may have been used efficiently by the crop under no-till and minimum tillage treatments as the moisture of upper soil layer may have been evaporated easily due to unavailability of soil mulch at no-till surface soil, whereas, the moderate moisture content of upper soil layer, i.e. 0-15 cm may have been consumed efficiently by the treatments with maximum or reduced tillage that attributed to the non-significant results. Minimum moisture recorded under the conventional tillage system may be due to more soil aeration, maximum crop water use efficiency under this treatment and maximum evaporation of soil moisture through higher soil porosity. The total moisture contents recorded in 2013-14 was slightly higher as compared to 2012-13. The higher moisture content in 2013-14 may be due to the reason that the conservation tillage treatments conserved more moisture under the deeper layer of soil during excellent monsoon rainfall that could not be absorbed by the crop due to less soil porosity and movement of water through the soil profile in no-till and other reduced tillage systems. In conclusion, no appreciable moisture content differences were observed from sowing to harvesting of wheat under different tillage systems in both years individually and in pooled data; this may be due to short duration of experiment and loamy texture soil of experimental area that did not held the moisture for longer period after each rainfall. The higher moisture in 2012-13 at developmental stage may be due to enough rainfall in the month of February at this stage and the minimum moisture at pre-sowing stage in this year may be due to the reason that there was very low rain fall in the monsoon season before this stage. The higher moisture under 30-45 cm soil depth at developmental and post-harvesting stage may be due to enough rainfall at developmental stage of 2012-13 and enough rainfall at maturity stage of 2013-14. The minimum moisture under 15-30 cm soil depth at pre-sowing stage of wheat may be due to lower rainfall in monsoon of 2012-13. The linear regression line was drawn between soil moisture contents and wheat grain yield and it was found that grain yield was decreased by increasing moisture that may be due to higher moisture contents under deeper layer of soil i.e 30-45 cm (Figure 10). The correlations between the moisture contents of soil at all growth stages and soil depths to all other parameters are presented in (Table 4). Similar results about soil water content were obtained by several researchers such as Ahmad (2002), Fuentes et al. (2003) and Latta and O’ Leary (2003), who found non-significant results about moisture contents under different tillage systems. On the other hand Moret et al. (2006) and Su et al. (2006) recorded less moisture content under reduced tillage systems. According to Małecka et al. (2012), water content values were significantly increased by 3.1% under reduced tillage and 5.4% under no-tillage relative to conventional tillage in the 0-5 cm soil layer; whereas, water content values were increased by only 1.6% under reduced tillage and 2.5% under no-tillage over conventional tillage in the 10-20 cm soil layer, but Strudley et al, (2008) claimed that No-tilled soils contained more moisture in spring time as compared to where intensive primary tillage was adopted.
Table 4: Correlation among wheat grain yield and measured soil attributes across all tillage systems, sowing years and sampling stages.
| Soil Moisture Content | Soil Porosity | Soil Bulk Density | ||
| Wheat Grain Yield | r-value | -0.21 | 0.68 | -0.69 |
| P-value | 0.65 | 0.09 | 0.09 | |
| Soil Moisture Content | r-value | -0.54 | 0.54 | |
| P-value | 0.21 | 0.21 | ||
| Soil Porosity | r-value | -1.00 | ||
| P-value | 0.00 |
The maximum grain yield in 1 Mould board plowing + 8 cultivations, 1 Mould board plowing + glyphosate and 1 Mould board plowing + 4 cultivations may be because of heavier seed weight and larger seed size during 2013-14 that was probably attributed to deep tillage with mould board plough, low bulk density of soil, higher moisture content at stem elongation stage, more porosity of soil, ultimately greater aeration and movement of soil water and nutrients in these treatments; whereas, the minimum grains yield in 1 Chisel plowing + glyphosate followed by 1 Disc harrowing + glyphosate and No-till + glyphosate may be attributed to least number of fertile tillers (m-2), comparatively low number of grains per spike and least 1000 grain weight during 2013-14. The effect of tillage intensity on grain yield was identified by arranging tillage systems in increasing order of tillage intensity along with grain yield data and then the regression line was drawn between these two factors which showed that the grain yield was significantly improved under intensive cultivation (Figure 12). The tillage systems were also grouped on the base of all studied parameters through cluster analysis (Figure 13) and it was observed that 1 Mould board plowing + glyphosate and 1 Mould board plowing + 8 cultivations fell in same group as they performed similarly for producing higher yield of wheat. These results are in line with those of Usman et al. (2009; 2010), Malecka et al. (2012) and Ali et al. (2016a; b; c), who reported higher grains yield under conventional and innovative sowing techniques, but the results are contradictory to the findings of Ahmad (2002), who found the highest grains yield under zero-tillage system. This variation in results may be due to climatic data variation or any other agro-ecological factor.
Conclusion
This study concluded that soil moisture dynamics can be improved by combine use of no-till and glyphosate herbicide (NT + GH) while once deep tillage with mould board plough at the onset of monsoon in fallow period and then a shallow tillage by cultivator with planker after each effective rainfall (1 MBP + 4 CS) can increase soil porosity, its productivity and wheat economical yield in rainfedagriculture. Conservation tillage followed by application of glyphosate herbicideis necessary to conserve the monsoon soil moisture, control weeds and reduce soil weed seed bank.However, conservation tillage needs a long term study to give a strong conclusion for its recommendation in rainfed agriculture of Pakistan.
Acknowledgments
The corresponding author is thankful to the HEC for funding through Indigenous PhD Fellowship Program.
Authors’ Contribution
Dr. Safdar Ali conducted the field experiment, whereas, Dr. Ghulam Abbas Shah, Dr. Muhammad Naveed Tahir, Dr. Shahid Mehmood, Dr. Asim Gulzar and Dr. Ijaz Ahmed provided technical inputs at every step of experiment and Mr. Bashir Ahmad Khan helped in writing the manuscript
References
Ahmad, I. 2008. Impact of management practices on soil water dynamics, soil physical properties and yield of rapeseed (Brassica compestris). MSc. (Hons.) Thesis, Dept. Soil Science and Soil and Water Conservation, Pir Mehr Ali Shah Arid Agriculture University Pakistan.
Aikins, S.H.M., J.J. Afuakwa and O.O. Akuoko. 2012. Effect of four different tillage practices on maize performance under rainfed conditions. Agric. Biol. J. North Am. 3(1): 25 – 30. https://doi.org/10.5251/abjna.2012.3.1.17.24
Aikins, S.H.M and J.J. Afuakwa. 2012. Effect of four different tillage practices on soil physical properties under cowpea. Agric. Biol. J. N. 3(1): 17-24. https://doi.org/10.5251/abjna.2012.3.1.17.24
Ali, S., M.A. Malik, M. Ansar and R. Qureshi. 2016a. Economic evaluation for integrated use of glyphosate herbicide and tillage combinations applied before sowing of rainfed wheat (Triticum aestivum L.). Pak. J. Bot. 48(1): 331-337.
Ali, S., M.A. Malik, M. Ansar, G. Qadir and R. Qureshi. 2016b. Seed bank density and weed flora dynamics of bindweed (Convolvulus arvensis) as affected by different tillage systems in rainfed wheat (Triticum aestivum). Int. J. Agric. Biol. 18(2): 231-237. https://doi.org/10.17957/IJAB/15.0031
Angas, P., J. Lampurlanes and C. Cantero-Martinez. 2006. Tillage and N fertilization effect on N dynamics and barley yield undersemiarid Mediterranean conditions. Soil Till. Res. 87: 59-71.
Arsyid, M.A, F.T. Camacho and P. Guo. 2009. Corn Basics: Corn Crop Management, Available Online: http://www.dekalb-asia.com/pdf/CB2_CornCropManagement.pdf
Auskalnis, A. 2005. Different soil tillage regimes on sandy loam cambisols. In Romaneckas, K. (ed): Recent results and future challenges in soil tillage research. International scientific seminar. Lithuanian University of Agriculture, Akademija, Lithuania, Pp. 6–9.
Benitio, A. 2010. Carbon accumulation in soil. Ten year study of conservation tillage and crop rotation in a semiarid areas of Castile-Leon, Spain Aurora Sombrero. Soil Til. Res. 107: 64–70.
Celik, I., Z.B. Barut, I. Ortas, M. Gok, A. Demirbas, Y. Tulun and C. Akpinar. 2011. Impacts of different tillage practices on some soil microbiological properties and crop yield under semi-arid Mediterranean conditions. Int. J. Pl. Prod. 5 (3): 237–254.
Derpsch, R., T. Friedrich, A. Kassam and H.W. Li. 2010. Current status of adoption of no-till farming in the world and some of its main benefits. Int. J. Agric. Biol. Eng. 3(1).
Elder, J.W. and Lal, R. 2008. Tillage effects on physical properties of agricultural organic soils of north central Ohio, Soil & Tillage Research, 98 (2): 208–210.
El-Titi, A. 2003. Soil Tillage in Agroecosystems. CRC Press, Boca Raton. Erenstein, O., Laxmi, V., 2008. Zero tillage impacts in India’s rice–wheat system: A review. Soil Till. Res. 100, 1–14.
Fernandez, R.O., P.G. Fernandez, J.V.G. Cervera and F.P. Torres. 2006. Soil properties and crop yields after 21 years of direct drilling trials in southern Spain. Soil Till. Res. 94(1): 47-54. https://doi.org/10.1016/j.still.2006.07.003
Fernández-Ugalde, O., I. Virto, P. Bescansa, M.J. Imaz, A. Enrique and D.L. Karlen. 2009. No-tillage improvement of soil physical quality in calcareous, degradation-prone, semiarid soils. Soil Till. Res. (In press). https://doi.org/10.1016/j.still.2009.09.012
Fuentes, J. P., M. Flury, D. R. Huggins and D. F. Bezdicek. 2003. Soil water and nitrogen dynamics in dry-land cropping systems of Washington State. Soil and Tillage Research, 71: 33-47.
Hammer, O., Harper, D.A.T. and Ryan, P.D. 2001. PAST: Paleantological Statistics software package for education and data analysis. Palaeontologia Electronica. pp. 4(1):9.
Heap, I.Global perspective of herbicide-resistant weeds. 13061315. https://doi.org/10.1002/ps.3696
Holland, J.M. 2004. The environmental consequences of adopting conservation tillage in Europe: reviewing the evidence. Agric. Eco. Environ. 103: 1–25. https://doi.org/10.1016/j.agee.2003.12.018
Jump up to: a b c d. 2013. The agronomic benefits of glyphosate in Europe (PDF). Monsanto Europe S A. February 2010. Retrieved 2013-06-02.
Jump up to: a b c d e f g h. 2015. Glyphosate technical fact sheet (revised June 2015). National Pesticide Information Center. 2010. Retrieved September 1, 2015.
Kay, B.D. and A. J. V. Bygaart. 2002. Conservation tillage and depth stratification of porosity and soil organic matter, Soil & Tillage Research, 66 (2): 107–118.
Lamichhane J.R., Y. Devos, H.J. Beckie, M.D.K. Owen, P. Tillie, A. and P. Kudsh. 2017. Integrated weed management systems with herbicide-tolerant crops in the European Union: lessons learnt from home and abroad. Criti. Rev. Biotech. 37(4).
Latta, J. and G.J. O’Leary. 2003. Long-term comparison of rotation and fallow tillage systems of wheat in Australia. Field Crop. Res. 83: 173-190. https://doi.org/10.1016/S0378-4290(03)00073-X
Madejon, E., J.M. Murillo, F. Moreno, M.V. Lopez, J. Alvaro-Fuentes and Cantero. 2009. Effect of long-term conservation tillage on soil biochemical properties in Mediterranean Spanish areas. Soil Till. Res. 105: 55–62. https://doi.org/10.1016/j.still.2009.05.007
Moret D., J.L. Arrúe, M.V. López, and R. Gracia, 2006. Influence of fallowing practices on soil water and precipitation storage efficiency in semiarid Aragon (NE Spain). Agric. Water Manage. 82:161-176. http://dx.doi.org/10.1016/j.agwat.2005.07.019
Moussa-Machraoui, S., F. Errouissi, M. Ben-Hammouda and S. Nouira. 2010. Comparative effects of conventional and no-tillage management on some soil properties under Mediterranean semi-arid conditions in northwestern Tunisia. Soil Till. Res. 106: 247–253. https://doi.org/10.1016/j.still.2009.10.009
Mweso, E. 2003. Evaluating the importance of soil water availability (As a land Quality) on selected rainfed crops in Serowe area, Botswana. Available Online: http://www.itc.nl/library/Papers_2003/msc/nrm/mweso.pdf
Naudin, C., Corre-Hellou, G., Pineau, S., Crozat, Y. and Jeuffroy. M.-H. (2010) The effect of various dynamics of N availability on winter pea-wheat intercrops: Crop growth, N partitioning and symbiotic N(2) fixation. Field Crops Research 119:2-11. http://doi.org/10.1016/j.fcr.2010.06.002.
Romaneckas, K., R. Romaneckien, E. Šarauskis, V. Pilipaviius and A. Sakalauskas. 2009. The effect of conservation primary and zero tillage on soil bulk density, water content, sugar beet growth and weed Infestation. Agron. Res. 7(1): 73-86.
Saavedra, C., J. Velasco, P. Pajuelo, F. Perea and A. Delgado. 2007. Effects of tillage on phosphorous release potential in a spanich vertisol. Soil Sci. Soc. Am. J. 71:56-63. https://doi.org/10.2136/sssaj2006.0162
Sadaf, J., G.A. Shah, K., Shahzad, N., Ali, M., Shahid, S., Ali, R.A., Hussain, Z.I., Ahmed, B. Traore, and M.I. Rashid. 2017. Improvements in wheat productivity and soil quality can accomplish by co-application of biochars and chemical fertilizers. Sci. Tot. Environ. 607-608: 715-724. https://doi.org/10.1016/j.scitotenv.2017.06.178
Sprankle P.W., F. Meggitt and D. Penner. 1975. Rapid inactivation of glyphosate in the soil. Weed Sci.: 224–228.
Standards Association of Australia. AS 1289 B1.1-1977. Determination of the Moisture Content of a Soil: Oven Drying Method (standard method).
Steel, R.G.D. and J.H. Torrie. 1980. Principles and procedures of statistics. McGraw Hill Book Co. Inc., New York.
Strudley WM, Green TR, Ascough II JC (2008) Tillage effects on soil hydraulic properties in space and time: State of the science. Soil and Tillage Research. 99: 4-48.
Su, Z., J.S. Wu. W. Chi, D. Lv. J. Jiang, G. Huang, J. Gao, R. Hartman and D. Gabriels. 2006. Effect of conservation tillage practices on winter wheat water use efficiency and crop yield on the loess plateau, China. Agric. Water manage. 87:307-314. https://doi.org/10.1016/j.agwat.2006.08.005
Tarkalson, G.A., R.W. Hergert and K.G. Cassmn. 2006. Long-term effect of tillage on soil chemical properties and grain yields of a dryland winter wheat-sorghum/corn-fallow rotation in the great planes. Agron. J. 98: 26-33. https://doi.org/10.2134/agronj2004.0240
Thomas, G.A., R.C. Dalal, J. Standley. 2007. No-till effects on organic matter, pH, cation exchange capacity and nutrient distribution in a Luvisol in the semi-arid subtropics. Soil Till. Res. 94: 295–304. https://doi.org/10.1016/j.still.2006.08.005
Usman, K. S. K. Khalil, F. Mohammad, M. A. Khan A. Z. Khan.2009.Weed management in wheat as affected by tillage and herbicides. Pak. J. Weed Sci. Res., 15: 155-169
Usman, K., S. K. Khalil and M. A. Khan. 2010. Impact of tillage and herbicides on weed density and some physiological traits of wheat under rice-wheat cropping system. Sarhad J. Agric., 26(4).