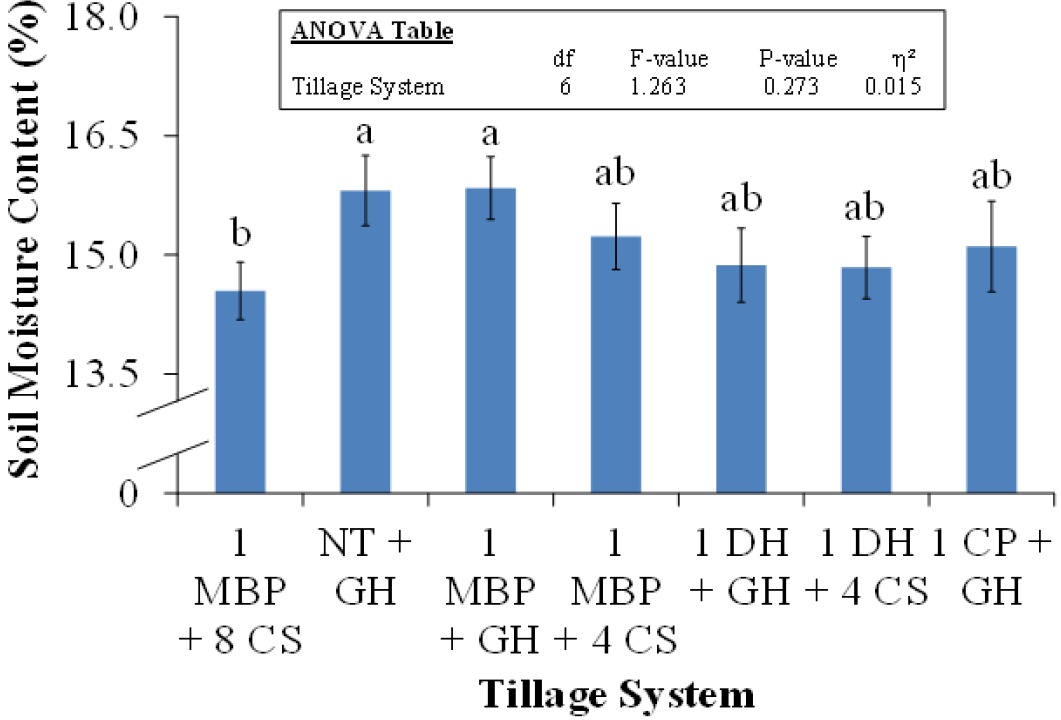
Figure 4
Effect of tillage system on soil moisture contents (Overall means of two years, three soil depths and three sampling stages). Small letters on bars indicate the difference among treatments at 5% probability level. Error bars shows standard error of the mean. Insets in figure represent outcomes of the analysis of variance (ANOVA).