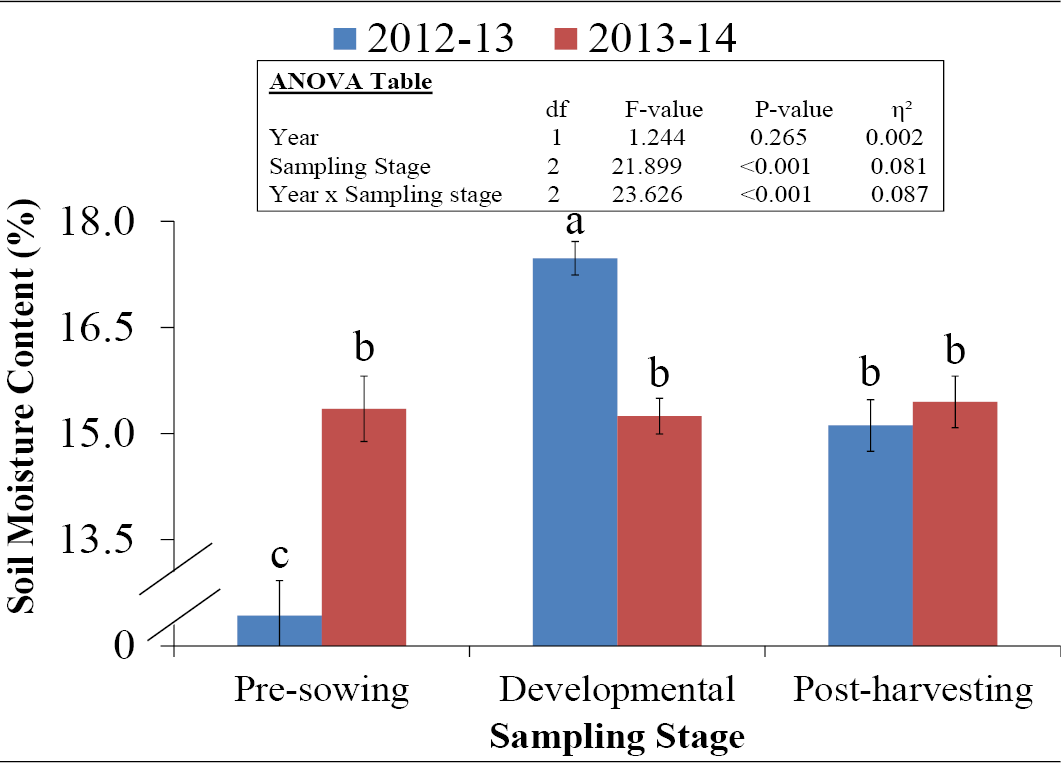
Figure 8
Effect of sampling stage on soil moisture content of all treatments together during 2012-13 and 2013-14.
Small letters on bars indicate the difference among treatments at 5% probability level. Error bars shows standard error of the mean. Insets in figure represent outcomes of the analysis of variance (ANOVA).