

Division of Pig Growth Stages According to Body Component Variation using Computer Vision


Division of Pig Growth Stages According to Body Component Variation using Computer Vision
Chen Shi, Jianlong Zhang and Guanghui Teng*
China Agricultural University, Beijing 100083, P.R. China
ABSTRACT
The body measurements of pigs are the important part of precision livestock farming that closely related to the growth characteristics and traits. It is significant for monitoring and understanding the pig growth at different stages effectively. In this study, the experiment adopted a management and data acquisition system based on LabVIEW, which automatically acquired and recorded the body measurements and body weights of 30 pigs during 90-day grower-finisher stage. Three body ratios between two each body measurements showed that the body length and width were the major parts of growth and development of pigs during 70 to 110 days old. The growth stages of grower and finisher were divided by three normalized body ratios. The exact agreement with two experienced observers reached 80% and 85% on body ratio between height at hip and hip width, 75% and 80% on body ratio between body length and height at hip, 50% and 45% on body ratio between body length and hip width, respectively. The statistical analysis of the body ratios could be used for dividing the different growth stages that replaces the body weight or growth day method. It also can provide a scientific foundation for precision feeding and automatic management of individual pig that could be applied in the real farm.
Article Information
Received 13 September 2019
Revised 28 November 2019
Accepted 21 December 2019
Available online 06 March 2020
Authors’ Contribution
CS and JZ did acquisition of data. CS and GT presented the concept and designed the study. CS analyed and interpreted the data and drafted the manuscript. GT revised the article.
Key words
Body measurements, Body ratio, Growth stages, Automatic management system, Pig.
DOI: https://dx.doi.org/10.17582/journal.pjz/20191108061105
* Corresponding author: futong@cau.edu.cn
0030-9923/2020/0003-1071 $ 9.00/0
Copyright 2020 Zoological Society of Pakistan
Introduction
Many factors such as genetic origin, feed intake, and competence (Oliveira et al., 2009; D’Souza and Mullan, 2002) affect animal growth in modern livestock farm. The body size and weight of animals are essential references in feed conversion and livestock profit (Menesatti et al., 2014) for dividing pig growth process into several stages which could help managers optimize the feeding scheme according to reliable statistics (Banhazi et al., 2012). Many researchers, such as Alexander et al. (2006), Boland et al. (1999) and Glen (1983) suggested that production potential can be fully reached by dividing grower–finisher pigs into several phases to adjust feed composition and management mode (Niemi and Sevón, 2010). Pigs at different growth stages have different nutrient requirements and growth traits for which recognizing the variation of pigs at different growth stages is important.
The pig’s live weight and body dimensions are the key indicators of economic implications and production performance that closely related to the health of pigs (Wu et al., 2004) which provide referential criteria for breeding programs and carcass quality (Nieto et al., 2013). Although individual difference is natural and inevitable, it can likely result in pigs with different sizes and growth processes when it was not managed properly (Apichottanakul et al., 2012). Thus, the producers will spend more time and effort than it needs to on production, or face with evident pork cuts (Khamjan et al., 2013). Therefore, the management matching with suitable growth stage for individual animals can improve production performance. Several researchers (e.g., Quiniou et al., 1999; Affentranger et al., 1996; Ramaekers et al., 1996) studied the effect of feeding regimen during the grower and finisher stages. They were able to increase meat production by approximately 2%–3%, which exceeded those of production that used arbitrary feeding. The ability to accurately estimate the growth stage, as well as the growth traits and development process, is a key influence factor for the maximization of profit.
The wean during productive process was conventionally divided into two or three stages so that the movement of pigs were needed by farmers in many places (Dedecker et al., 2005). Methods for grouping pigs are important on several aspects (Brandl and Jorgensen, 1996). However, traditional method to group pigs is usually by directly manual driving by plastic boards which is physically stressful to both the pigs and breeders (Doyle and Leeson, 1989) and may result in stress reaction and negatively affect pig feeding for days. Indirect methods by using intelligent analysis system should be developed to improve this circumstance (Stajnko et al., 2008). The non-contact systems can effectively reduce the stress behavior of animals and other negative effects, which also avoid causing serious problems in animal welfare and performance (Schmolke et al., 2004).
The entire growth cycle of pig can be divided into three stages by body weight that reflected the different physical characteristics at different stages (Hou et al., 2006). Some research considered that the body weight of pigs during grower and finisher stages ranged from 20 to 50 kg and 50 kg to market weight (The Pig Site, 2006), or 60 to 94 kg and 95 kg to final weight (Dionissopoulos et al., 2001), or 35 to 60 kg and 60 kg to market weight in some Chinese pig farms. However, some other research divided the entire growth cycle of pigs into different stages by growth days. Liu et al. (2017a, b) divided growth cycle into 9 phases of 3 stages, which ranged from 1 to 44 days (4 phases of nursery stage), 45 to 107 days (3 phases of grower stage) and 108 days to final days (2 phases of finisher stage). In Finland and many other pork producing countries, pigs are fed one to four different diets from approximately 25 to 108 kg during 91-day grower-finisher period (Niemi and Sevón, 2010). All these previous research shows the different dividing methods and criteria. The slow-growing pigs with their pen-mates may step into the next phase or stage together if the phase or stage is simply divided by growth days. The other option is to sort pigs based on body weight by using electronic scales or cameras, but several errors are generated by the fluctuation in the normal physiological data (Li et al., 2015), such as the diurnal weight fluctuations. In addition, the body weight estimated by body dimensions of pig is complicated and not accurate enough yet (Shi et al., 2019). Therefore, a uniform criterion for division or a reasonable division method basis for the above different methods is needed to propose to help managers formulate correct feeding and management decisions.
The current study attempts to investigate a method that can realize automated management and improve animal welfare for grower and finisher pigs through intelligent equipment. Data, such as body weight (BW), body length (BL), body width (BD), hip width (HW), height at withers (HAW), and hip (HAH) were obtained and recorded automatically. Studies on the principal component of body measurements and growth characteristics and traits at different growth stages are extensively applied in dietary nutrition and breeding works (Nieto et al., 2013).
The objectives of this study were to (i) investigate a method that analyzes the different growth characteristics and traits of grower-finisher pigs at different growth stages, (ii) divide growth process into different stages for individual pig with body ratios method, (iii) verify the accuracy of body ratios method which compares with body weight method in pig farm.
Materials and methods
Animals and housing
This study was conducted in the swine building at the Shang Zhuang Experimental Station of China Agricultural University, which is about 26 km from China Agricultural University’s east campus in Haidian District of Beijing. The swine building was rebuilt according to automatic control technology as shown in Figure 1, a and b were the feeding areas, while c and d were the resting and drinking areas. All experiments were performed in accordance with the guidelines for animal research established by the Local Ethics Committee of Animal Experiments at Tsinghua University (Certificate number: 002218).
A total of 30 grower-finisher pigs aged 71 days and weighed approximately 35 kg, were selected from the Hui Kang pig farm in China. The experiment lasted for 90 days, the pigs weight ranged from 120 to 150 kg at the end of the experiment. All of them were housed in the experimental station for measuring the daily growth data that were pig’s body measurements and body weight.
Equipment and data collection
A ground scale (Fig. 2h) with pressure sensors under the slatted floor of the drinking area was used to measure the body weight (BW) of pigs. Radio frequency identification (RFID) ear-tags were also used for the identification of pigs and recording their growth data (Fig. 2g). The ID and BW data were transfered to USR-410S (serial port server) through RS 232 and 485 (Fig. 2e), then recorded and saved in database automatically.
The BL, BD, HW, HAW, and HAH of the pigs were measured using a binocular stereo vision acquisition system equipped with two “Basler acA-1300-30gc” digital cameras with 1,294 × 964-pixel resolution (Fig. 2a). The results of this non-contact method have been proven to be as precise as those measured manually (Li et al., 2015). Pigs stood and rarely moved while feeding and drinking, so the best installation area for the ground scale and binocular cameras was the drinking area. The pigs were automatically managed by equipment according to the combination of hardware and software. The input signals for detecting pig at the moment it entered the drinking area were emitted from the photoelectric sensors (Fig. 2i) to the digital input module (ART DAM-E3013) (Fig. 2d). The Embedded Vision System (EVS-1463) sent commands (Fig. 2b) to the ART DAM-3018 (relay output module) according to the location of the photoelectric sensor. Then the output module sent signals to the pneumatic door device (Fig. 2f), which controlled the opening and closing of the door of pen to guide the pigs. The modules were connected to the EVS by ethernet switch (Fig. 2c). The software was developed based on Laboratory Virtual Instrumentation Engineering Workbench Environment (LabVIEW V2015, National Instruments Corporation, USA).
Data analysis
The backside images of 30 pigs were obtained and analyzed by the image acquisition system that using LabVIEW and vision development module. Pigs contour was segmented using block matching method from the depth images (Fig. 3A) that computed from the left and right images obtained by the binocular cameras (Shi et al., 2016). The BL, BD and HW, and HAW and HAH were calculated by eight key points that were marked on the backside image of the pig after segmentation processing, as shown in Figure 3B and Equation 1.
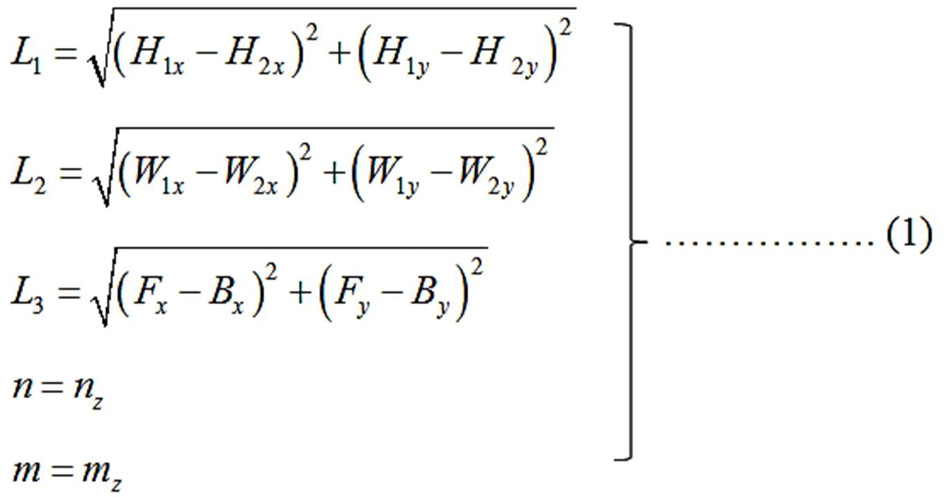
Where, L1, L2, L3 are the pig’s hip width, body width, and body length, respectively, cm; m and n are the pig’s height at the hip and withers, cm; and x, y, z are the abscissa, ordinate, and depth in a three-dimensional coordinate, respectively (Fig. 3C).
The daily growth data of ten pigs in the experimental station were used to confirm the correlation between the body measurements and BW. The BW, BL, BD, HAW, HW, and HAH were fitted into a linear model and regressed
by a linear equation. The regressed results of pig’s body measurements and weight in Figure 4 showed the perfect linear relationship, while the high linear correlation coefficients of ten pigs were all above 0.90. The close correlation between body measurements and BW indicate that the evaluation of growth performance by body measurements instead of BW is feasible.
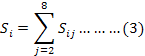
The daily body measurements of ten pigs throughout the entire experimental cycle were taken the ratio that between BL and HW (LW), BL and HAH (LH), and HAH and HW (HH). To express the ratio data in a uniform standard conveniently, and compare the data of different ratios simply, a simplified method for normalization is applied to compute them. The ratio between the ordinate value and area that was formed by the curve and coordinate axis was calculated. The detailed computed process is presented as follows:

Where, Sij is the area of every two adjacent values of BL, HW, or HAW (i is the three groups of BL, HW, or HAW, where BL is 1, HW is 2, and HAW is 3); j represents the eight stages (i.e., 1, 2, 3, … 8) and in equation 1 ( j – 1 ≥ 1); and rij is the ratio at stage j in group i. Thus,
Where, Si is the sum of all the areas in each group. Therefore, the area of each group of BL, HW, or HAW can be expressed by equation 4.
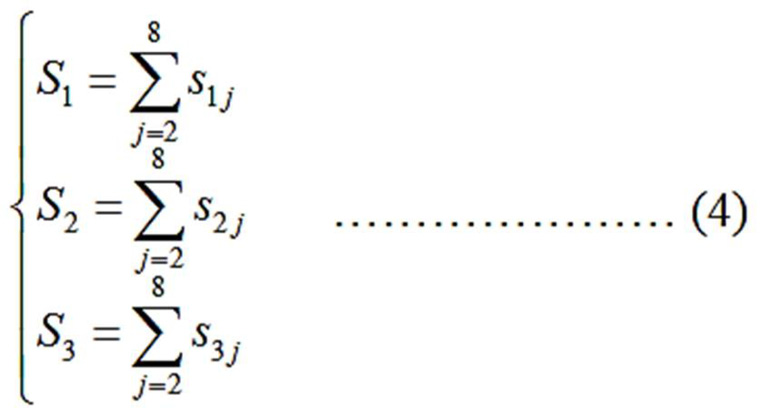
Where, S1, S2 and S3, are the areas of BL, HW, and HAW, respectively.
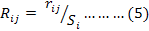
Where, Rij is the normalized body ratios.
RESULTS
All the body ratios data of pigs (i.e., LW, LH, and HH) have been normalized. The variation tendencies of 10 pigs were consistent with the 4 pigs in Figure 5. The HH decreased sharply and the LH rose rapidly from the beginning of experiment to the middle of experiment. It indicated that the hip width and body length increased faster than the height at withers during this growth phase. The LW changed relatively slow and varied according to the differences of pigs. Relative to the beginning of experiment (1 to 30 days), all the normalized body ratios of individual pig were stable and closed to each other from the middle to the end of experiment (30 to 90 days). The mean and normalized body ratios for every ten kilograms of mean body weight of pigs were listed in Table I.
Table I.- The relationships between pig’s body weight and body ratios.
|
Body weight (kg) |
Body ratios (mean ± standard deviation) |
Normalized (×10-2) |
||||
|
LW |
LH |
HH |
LW |
LH |
HH |
|
|
40 |
3.471 ± 0.094 |
1.792 ± 0.031 |
1.940 ± 0.066 |
1.06 |
0.98 |
1.11 |
|
50 |
3.386 ± 0.081 |
1.847 ± 0.027 |
1.836 ± 0.040 |
1.03 |
1.01 |
1.05 |
|
60 |
3.376 ± 0.052 |
1.885 ± 0.026 |
1.791 ± 0.022 |
1.03 |
1.03 |
1.03 |
|
70 |
3.366 ± 0.068 |
1.898 ± 0.031 |
1.774 ± 0.018 |
1.03 |
1.04 |
1.02 |
|
80 |
3.379 ± 0.047 |
1.913 ± 0.017 |
1.766 ± 0.019 |
1.03 |
1.05 |
1.01 |
|
90 |
3.344 ± 0.079 |
1.909 ± 0.013 |
1.748 ± 0.025 |
1.02 |
1.04 |
1.01 |
|
100 |
3.352 ± 0.076 |
1.905 ± 0.027 |
1.760 ± 0.022 |
1.02 |
1.04 |
1.01 |
|
110 |
3.372 ± 0.070 |
1.906 ± 0.022 |
1.768 ± 0.016 |
1.03 |
1.04 |
1.02 |
There was little variation in mean and normalized body ratios with the increasing mean body weight. The maximum values of LW and HH, which were 3.471 ± 0.094 and 1.940 ± 0.066 (mean ± standard deviation), were obtained at 40 kg of mean body weight of pigs. The normalized LW and HH could also indicate that they decreased from the maximum values to the plateau region from 50 to 110 kg and from 70 to 110 kg of mean body weight, respectively. The result of LH and normalized LH showed an opposite trend that the ratio increased from the minimum value (1.792 ± 0.031) to the plateau region (70 kg to 110 kg) along with the increasing mean body weight. It is interesting that all the body ratios reached the plateau before mean body weight of 70 kg of pigs.
Two experienced observers who have worked for more than 10 years at the Hui Kang pig farm evaluated the results of the stage dividing of body ratios method that divided 20 pigs in pig farm into finisher stage. Observers 1 and 2 had exact agreements as high as 80% and 85% on the result of HH (Table II). The percentages of exact agreements on LH and LW were lower than HH (45%–75%). The root mean square error (RMSE) represented the dispersion of the body ratios and standard methods (60 kg to 70 kg of body weight). The discrete degree was rather low and ranged from 2.39 kg to 6.54 kg, indicating high representation. Furthermore, the minimum value of the mean absolute error (MAE) was 2.83%, whereas its maximum value was 9.77%. This result suggests that the HH have higher reliability than the others.
Table II.- Evaluation of the stage dividing of body ratios method.
|
Body ratios |
Exact agreement, % (No.) |
RMSE (Kg) |
MAE (%) |
|
|
Observer1 |
Observer2 |
|||
|
HH |
80 (16) |
85 (17) |
2.39 |
2.83 |
|
LH |
75 (15) |
80 (16) |
3.12 |
4.66 |
|
LW |
50 (10) |
45 (9) |
6.54 |
9.77 |
DISCUSSION
The BL, HW, and HAH were the parameters of body ratios in this study that highly correlated with the body weight of pigs (Fig. 4). The LH and HH showed an opposite trend in Figure 5, which indicated that the body length and hip width growing faster than the height at hip during the entire experiment. This result was consistent with the study of Hou et al. (2006) who showed the principal components of physical characteristic of Landrace were width and length from 70 days old to 150 days old, respectively.
Table III.- The results of statistical analysis between body measurements.
|
Para-meters |
Body measurements |
BL |
BD |
HAW |
HW |
HAH |
|
R2 |
BL |
1.000 |
||||
|
BD |
0.969 |
1.000 |
||||
|
HAW |
0.933 |
0.811 |
1.000 |
|||
|
HW |
0.969 |
0.978 |
0.931 |
1.000 |
||
|
HAH |
0.883 |
0.790 |
0.964 |
0.717 |
1.000 |
|
|
m |
BL |
1.000 |
||||
|
BD |
0.301 |
1.000 |
||||
|
HAW |
0.531 |
1.762 |
1.000 |
|||
|
HW |
0.297 |
0.985 |
0.558 |
1.000 |
||
|
HAH |
0.610 |
2.023 |
1.148 |
2.054 |
1.000 |
|
|
r |
BL |
1.000 |
||||
|
BD |
3.341 |
1.000 |
||||
|
HAW |
1.871 |
0.561 |
1.000 |
|||
|
HW |
3.378 |
1.012 |
1.807 |
1.000 |
||
|
HAH |
1.629 |
0.488 |
0.891 |
0.483 |
1.000 |
R2, coefficient of determination; m, slope of linear fitting between body measurements; r, mean body ratio between body measurements.
The results of linear regression and ratios analysis between five body measurements of pigs were shown in Table III. The lowest coefficient of determination (R2) value was found between HW and HAH (0.717) showed the lowest correlation between five body measurements. The lowest R2 between BL and other body measurements also occurred at HAH (0.883), which indicate that the body ratio between BL and HAH makes more sense than the others. Meanwhile, the slope of linear fitting between body measurements showed the maximum values were 2.023 (BD and HAH) and 2.054 (HW and HAH), and the minimum value was 0.297 (BL and HW). In summary, the BL, HW and HAH have the low interaction and correlation with each other so that the ratios between them could better reflect the growth performance trait than others during the experiment.
The mean body ratio values between five body measurements of pigs (Table III) that from 70 to 160 days old were within the same range as the finding of Li (2016) (Table IV), who showed a standard body ratios range in pig’s growth that used to eliminate the low quality back images of the unsatisfactory posture pigs. Therefore, the body ratio values are the stable and meaningful reference for pig growth. The maximum and minimum values of mean body ratio were 3.378 (BL and HW) and 0.483 (HW and HAH) indicate that the largest difference between five body measurements were the body length, hip width and height at hip.
Table IV.- The range of body ratios (Li, 2016).
|
Body ratios |
BL and HW |
BL and HAH |
BD and HW |
HAW and HAH |
|
Range |
3.1 - 3.6 |
1.4 - 1.8 |
0.9 - 1.1 |
0.84 - 0.94 |
All the mean normalized body ratios reached a plateau, did not increase or decrease any further from 30 to 90 days in Figure 5 and from 70 to 110 kg of mean body weight in Table I. This result implied that the main stage of bone growth was almost complete and then transition to the main stage of fat deposition during this period, the grower stage moved to the finisher stage. The result of growth stages division by mean normalized body ratios was consistent with the body weight and growth day methods. However, there were some results showed that the grower stage ended at different kilogram from 50 to 70, or different growth day from 90 to 110 due to the individual differences between pigs (O’Doherty and Forde, 1999; Turner et al., 2003; The Pig Site, 2006; Niemi and Sevón, 2010; Liu et al., 2017a, b). Therefore, the body ratios method divides the different growth stages according to the different growth characteristics and traits of pigs is more reasonable than the uniform dividing method by using body weight or growth day.
Conclusion
The body ratios between body measurements have a good reference value that reflect the laws and traits of growth performance of pigs. The LH and HH showed that the body length and width are the major parts of growth and development of pigs during 70 to 110 days old. The growth stages of grower and finisher were divided by three normalized body ratios. The exact agreement with two experienced observers reached 80% and 85% (HH), 75% and 80% (LH), 50% and 45% (LW). The root mean square error between the normalized body ratios and standard method was 2.39 kg (HH), 3.12 kg (LH) and 6.54 kg (LW), whereas the mean absolute error of normalized body ratios was 2.83% (HH), 4.66% (LH) and 9.77% (LW), respectively. The system for monitoring and managing individual pig collected and recorded the data accurately. It also could realize the automatic grouping based on the result of the data analysis. Furthermore, this system is a simple structure, low manufacturing cost, and easy reconstruction so that could be combined with precision feeding system for future research and experiments.
Acknowledgement
This work was financially supported by the Ministry of Science and Technology of the People’s Republic of China (No. 2016YFD0700204), and also supported by the China Scholarship Council (Scholarship No. 201706350231).
Statement of conflict of interest
The authors declare no conflict of interest.
References
Affentranger, P., Gerwig, C., Seewer, G.J.F., Schwörer, D. and Künzi, N., 1996. Growth and carcass characteristics as well as meat and fat quality of three types of pigs under different feeding regimens. Livest. Prod. Sci., 45: 187-196. https://doi.org/10.1016/0301-6226(96)00011-5
Alexander, D.L.J., Morel, P.C.H. and Wood, G.R., 2006. Feeding strategies for maximising gross margin in pig production. Global Optimization: Scientific and Engineering Case Studies. Springer, USA. https://doi.org/10.1007/0-387-30927-6_2
Apichottanakul, A., Pathumnakul, S. and Piewthongngam, K., 2012. The role of pig size prediction in supply chain planning. Biosyst. Eng., 113: 298-307. https://doi.org/10.1016/j.biosystemseng.2012.07.008
Banhazi, T.M., Lehr, H., Black, J.L., Crabtree, H., Schofield, P., Tscharke, M. and Berckmans, D., 2012. Precision livestock farming: An international review of scientific and commercial aspects. Int. J. Agric. Biol. Eng., 5: 1-9.
Boland, M.A., Foster, K.A. and Preckel, P.V., 1999. Nutrition and the economics of swine management. J. Agric. appl. Econ., 31: 83-96. https://doi.org/10.1017/S008130520002879X
Brandl, N. and Jorgensen, E., 1996. Determination of live weight of pigs from dimensions measured using image analysis. Comput. Electron. Agric., 15: 57-72. https://doi.org/10.1016/0168-1699(96)00003-8
Dedecker, J.M., Woiter, M.E.F., Corrigan, B.P., Curtis, S.E. and Mollis, G.R., 2005. Effect of stocking rate on pig performance in a wean-to-finish production system. Can. J. Anim. Sci., 85: 1-5. https://doi.org/10.4141/A04-042
Dionissopoulos, L., Cfm, D.L., Dewey, C.E., Macinnes, J.I. and Friendship, R.M., 2001. Effect of health management strategy during rearing on grower-finisher pigperformance and selected indicators of immune system stimulation. Can. J. Anim. Sci., 81: 179-187. https://doi.org/10.4141/A00-020
Doyle, I. and Leeson, S., 1989. Automatic weighing of poultry reared on a litter floor. Can. J. Anim. Sci., 69: 1075-1081. https://doi.org/10.4141/cjas89-122
D’Souza, D.N. and Mullan, B.P., 2002. The effect of genotype, sex and management strategy on the eating quality of pork. Meat Sci., 60: 95-101. https://doi.org/10.1016/S0309-1740(01)00112-7
Glen, J.J., 1983. A dynamic programming model for pig production. J. Oper. Res. Soc., 34: 511-519. https://doi.org/10.1057/jors.1983.118
Hou, J., Shi, Z. and Li, B., 2006. Principal component analysis of Landrace’s physical characteristics. J. China Agric. Univ., 11: 56-60.
Khamjan, S., Piewthongngam, K. and Pathumnakul, S., 2013. Pig procurement plan considering pig growth and size distribution. Comput. Ind. Eng., 64: 886-894. https://doi.org/10.1016/j.cie.2012.12.022
Li, Z., 2016. Research of pig weight estimation based on stereo vision technology. Ph.D. thesis, China Agricultural University, Beijing, China.
Li, Z., Mao, T., Liu, T. and Teng, G., 2015. Comparison and optimization of pig mass estimation models based on machine vision. Trans. Chinese Soc. agric. Engin., 31: 155-161.
Liu, S., Ni, J.Q., Radcliffe, J.S. and Vonderohe, C.E, 2017a. Hydrogen sulfide emissions from a swine building affected by dietary crude protein. J. environ. Manage., 204: 136-143. https://doi.org/10.1016/j.jenvman.2017.08.031
Liu, S., Ni, J.Q., Radcliffe, J.S. and Vonderohe, C.E., 2017b. Mitigation of ammonia emissions from pig production using reduced dietary crude protein with amino acid supplementation. Bioresour. Technol., 233: 200-208. https://doi.org/10.1016/j.biortech.2017.02.082
Menesatti, P., Costa, C., Antonucci, F., Steri, R., Pallottino, F. and Catillo, G., 2014. A low-cost stereovision system to estimate size and weight of live sheep. Comput. Electron. Agric., 103: 33-38. https://doi.org/10.1016/j.compag.2014.01.018
Niemi, J.K. and Sevón, M.L., 2010. The value of precision feeding technologies for grow–finish swine. Livest. Sci., 129: 13-23. https://doi.org/10.1016/j.livsci.2009.12.006
Nieto, R., Lara, L., Barea, R., García-Valverde, R., Conde-Aguilera, J.A. and Aguilera, J.F., 2013. Growth of body components and carcass composition of Iberian pigs of 10 to 150 kg body weight as affected by the level of feeding and dietary protein concentration. J. Anim. Sci., 91: 4197-4207. https://doi.org/10.2527/jas.2013-6332
O’Doherty, J.V. and Forde, S., 1999. The effect of protease and α-galactosidase supplementation on the nutritive value of peas for growing and finishing pigs. Irish J. Agric. Fd. Res., 38: 217-226.
Oliveira, J., Yus, E. and Guitián, F.J., 2009. Effects of management, environmental and temporal factors on mortality and feed consumption in integrated swine fattening farms. Livest. Sci., 123: 221-229. https://doi.org/10.1016/j.livsci.2008.11.016
Quiniou, N., Noblet, J., Dourmad, J.Y. and Jvan, M., 1999. Influence of energy supply on growth characteristics in pigs and consequences for growth modelling. Livest. Prod. Sci., 60: 317-328. https://doi.org/10.1016/S0301-6226(99)00103-7
Ramaekers, P.J.L., Swinkels, J.W.G.M., Huiskes, J.H., Verstegen, M.W.A., Hartog, L.A.D. and Peet-Schwering, C.M.C.V., 1996. Performance and carcass traits of individual pigs housed in groups as affected by ad libitum and restricted feeding. Livest. Prod. Sci., 47: 43-50. https://doi.org/10.1016/S0301-6226(96)00035-8
Schmolke, S.A., Li, Y.Z. and Gonyou, H.W., 2004. Effects of group size on social behavior following regrouping of growing–finishing pigs. Appl. Anim. Behav. Sci., 88: 27-38. https://doi.org/10.1016/j.applanim.2004.02.017
Shi, C., Teng, G. and Li, Z., 2016. An approach of pig weight estimation using binocular stereo system based on LabVIEW. Comput. Electron. Agric., 129: 37-43. https://doi.org/10.1016/j.compag.2016.08.012
Shi, C., Zhang, J. and Teng, G., 2019. Mobile measuring system based on LabVIEW for pig body components estimation in a large-scale farm. Comput. Electron. Agr., 156: 399-405. https://doi.org/10.1016/j.compag.2018.11.042
Stajnko, D., Brus, M. and Hočevar, M., 2008. Estimation of bull live weight through thermographically measured body dimensions. Comput. Electron. Agric., 61: 233-240. https://doi.org/10.1016/j.compag.2007.12.002
The Pig Site, 2006. Basic pig husbandry-The grower herd. Available at: http://www.thepigsite.com/articles/1605/basic-pig-husbandry-the-grower-herd
Turner, S.P., Allcroft, D.J. and Edwards, S.A., 2003. Housing pigs in large social groups: A review of implications for performance and other economic traits. Livest. Prod. Sci., 82: 39-51. https://doi.org/10.1016/S0301-6226(03)00008-3
Wu, J., Tillett, R., Mcfarlane, N., Ju, X., Siebert, J.P. and Schofield, P., 2004. Extracting the three-dimensional shape of live pigs using stereo photogrammetry. Comput. Electron. Agric., 44: 203-222. https://doi.org/10.1016/j.compag.2004.05.003
To share on other social networks, click on any share button. What are these?


