

Comparing the Predictive Ability of Machine Learning Methods in Predicting the Live Body Weight of Beetal Goats of Pakistan


Comparing the Predictive Ability of Machine Learning Methods in Predicting the Live Body Weight of Beetal Goats of Pakistan
Farhat Iqbal1, Abdul Waheed2*, Zil-e-Huma3 and Asim Faraz2
1Department of Statistics, University of Balochistan, Quetta, Pakistan
2Departmentof Livestock and Poultry Production, Faculty of Veterinary Sciences, Bahauddin Zakariya University, Multan, Pakistan
3Department of Zoology, Sardar Bahadur Khan Women’s University, Quetta, Pakistan
ABSTRACT
This study aimed to compare four popular machine learning algorithms to model and predict the body weight through various body measurements of small ruminants. The regression tree, random forests, support vector machine and gradient boosting machine methods have been used to predict the live body weight (target variable) of the animal. The predictors (independent variables) included in the current study were sex of the animal, neck length, diagonal body length, head girth above eyes,shank circumference, belly sprung, and rump height measurements of beetal goats (1 – 7 years in age) of Pakistan. In order to test the performance of candidate methods, various evaluation measures such as the mean absolute error, root mean squared error, mean absolute percentage error, coefficient of determination and the correlation between the actual and predicted body weights were calculated. A 10-fold cross validation was used on the training dataset for tuning the hyperparameters of the models whereas a separate testing dataset was used for evaluation of the predictive performance of machine learning methods. The predictive performance of random forests and gradient boosting methods were found to provide better results than other competing methods in accurately predicting the live body weight of the beetal goats.
Article Information
Received 03 October 2019
Revised 13 January 2020
Accepted 24 January 2020
Available online 28 January 2021
(early access)
Published 03 December 2021
Authors’ Contribution
AW designed the research, conducted the experiments and collected the data. ZH, FI and AF interpreted the results. FI analyzed the data and wrote the manuscript. ZH and AF
revised the manuscript.
Key words
Small ruminants, Machine learning, Body measurements, Body weight prediction, Training and testing, Beetal goats
DOI: https://dx.doi.org/10.17582/journal.pjz/20191003081007
* Corresponding author: [email protected]
0030-9923/2022/0001-0231 $ 9.00/0
Copyright 2022 Zoological Society of Pakistan
INTRODUCTION
In Pakistan, nearly 72.2 million goats are reared for different purposes such as sociocultural reasons, meat and milk production and cash generation (Economic Survey of Pakistan, 2017). Due to their small body size, adaptability to harsh climate conditions, broad feeding habits, and short reproductive cycle goats as small ruminants arepreferred by farmers.
In meat animals, live body weight plays an important role due to its direct relation with income (Cam et al., 2010) however shortage of weighing scale equipment in the distant rural areas often results in inaccurate measurement of this very important trait. In practice, external measurements of the body have been used to estimate the development of the skeleton (all height and length measurements) and/or soft tissues (measurements include chest depth, punch girth, heart girth and width of hips) of the body.The accurate prediction of live body weight in farm animals is required for providing data on appropriate medication dose, adjusting feed amount, monitoring growth and marketing price of animal (Khan et al., 2014).
Body measurements of small ruminants are imperative within the scope of reflecting the breed standards (Riva et al., 2002; Verma et al., 2016) and are also vital in providing evidence about the morphological structure and developmental capacity of animals. Moreover, these measurements may serve as an indirect way to estimate the live body weight of animals.
Various studies on farm animals have found a significant relationship between animal’s live body weight and their linear body measurements for determining breed standards and indirect selection criteria (Eyduran et al., 2017). Subsequently, prediction models have been developed for body weight through various body measurements. Moaeen-ud-Din et al. (2006) studied the relationship between the body weight of beetal, teddi and beetal × teddi crossbreed goats of Pakistan with body length, chest girth, and height at withers. Khan et al. (2006) studied the association between live body weight and various body measurements such as heart girth, body length, and height at withers of beetal goats. Iqbal et al. (2013) fitted multiple regression to study the effect of heartgirth and height at withers on live body weight of beetal goats. Eyduran et al. (2013) adopted a different approach by using factor and principal component scores in multiple regression to predict the body weight of commercial goat of Pakistan through various body measurements.
Multiple linear regression model (MLR) is a popular method amongst researchers to study the causal relationship between body weight and various body measurements of animals. However, MLR only looks at the linear relationship between the dependent and set of independent variables. Sometimes, this relationship may be nonlinear or complex in nature and as a consequence, the estimates of MLR may be biased. Besides, MLR may suffer from the problem of multicollinearity (strong correlation among independent variables) which often exists between independent variables.
Recently, data mining and machine learning algorithms are becoming popular modeling and prediction tools among practitioners due to their ability to model complex relationships and high predictive accuracy. Few studies have successfully applied these methods in animal sciences. For example, Chi-square Automatic Interaction Detector (CHAID), Exhaustive CHAID (ECHAID), Classification and Regression Tree (CART) and Artificial Neural Networks (ANN) methods were implemented by Ali et al. (2015) in order to predict the body weight Harnai sheep of Balochistan. Eyduran et al. (2017) used the CART, CHAID, radial basis function (RBF) and multilayer perceptron (MLP) methods to model the body weight by means of beetal goats by means of various body measurements. Aytekin et al.(2018) employed multivariate adaptive regression splines (MARS) algorithms to predict the weights of bulls from various body measurements. MARS algorithm was also applied by Celik et al. (2018) to describe the growth of a goat breed of Pakistan. Celik (2019) compared the predictive performances MARS, CHAID, ECHAID and CART algorithms in predicting the live body weight by means of several body traits of goats of Pakistan. The results of these studies have found the potential of data mining methods to better model and predict the nonlinear relationship between live body weight and body measurements.
To the best of our knowledge, no previous study had used these machine learning methods for predicting the body weight of beetal goats of Pakistan. Besides, previous literature on the prediction of body weight of small ruminants through data mining and machine learning methods are rare. Therefore, we aim to fill this gap by using five different machine learning models, namely, linear regression model, regression trees, support vector machine, random forests and gradient boosting machine for modelling and predicting the body weight of beetal goats from several body measurements such sex of the animal, neck length, diagonal body length, head girth above eyes,shank circumference, belly sprung, and rump height measurements.
The aim of this study was to develop machine learning models for accurate prediction of the body weight through body measurements of small ruminants. We also aim to provide a systematic approach in machine learning framework by randomly partitioning the data into training and testing parts. A 10-fold cross-validation approach on the training dataset was used to identify the relationship between the target and predictors, to avoid overfitting and to find the best fitted model. The predictive performances of best fitted models were then assessed using various evaluation measures on a separate testing dataset.
MATERIAL AND METHODS
Data set and variables
For statistically evaluating performances of various statistical approaches here data of the present study, were obtained from Eyduran et al. (2017) published previously. The data consists of different body measurements of 205 indigenous beetal (189 female and 16 male) goats reared at four different livestock farms in Punjab, Pakistan. The dependent variable body weight (BW) was measured in kilogram (kg) using a weight balance whereas independent variables such as neck length (NL), diagonal body length (BL), head girth above eyes (HG), shank circumference (SC), belly sprung (BS) and rump height (RH) were measured in centimeter (cm) for each goats using a tailor tape. The sex of the goat is also taken as a categorical independent variable. Table I presents some basic descriptive statistics of all variables for both sexes used in the study. Statistically significant differences were observed between the mean body measurements of male and female.
Table I. Mean and standard deviation (S.D.) of each variable for both sexes.
|
Variables |
Male |
Female |
p-value* |
|
Body weight (kg) |
65.94±3.51 |
42.14±4.63 |
0.000 |
|
Neck length(cm) |
36.97±5.45 |
30.34±3.02 |
0.000 |
|
Body length (cm) |
81.76±4.13 |
72.67±3.95 |
0.000 |
|
Head girth above eyes (cm) |
56.72±2.95 |
46.34±3.27 |
0.000 |
|
Shank circumference (cm) |
11.66±1.03 |
9.99±0.75 |
0.000 |
|
Belly sprung (cm) |
24.50±3.65 |
21.71±2.85 |
0.009 |
|
Rump height (cm) |
96.13±5.69 |
82.42±3.64 |
0.000 |
*p-value of t-test for difference in mean.
Machine learning models
In the present study, the following four different machine learning methods have been used:
Regression trees
Classification and Regression Trees (CART) of Breiman et al. (1984) also known as decision trees is a recursive partitioning method that can predict both the categorical target variable (classification problem) and continuous target variable (regression problem) by building trees. Regression Trees (RT) is a variant of decision trees designed to predict the values of a continuous dependent variable from one or more continuous and/or categorical predictor variables. The RT procedure breaks down a datasetinto smaller and smaller subsets and then fit a simple model (constant) for each subset. This is achieved by binary partitioning based on values of different predictors. The mean response values of all observations falling in a subset help to predict the constant. The process is recursively continued until a stopping criterion is reached. Although the method is simple and useful for interpretation, it tends to over-fit on the training data.
Random forests
Another popular and flexible machine learning algorithm often applied to develop predictive models is the Random forests (RF). The RF can be used for classification as well as regression type of problems. It is an ensemble method (combination ofsimple multiple algorithms into a single powerful predictive model) consisting of multiple ransom decision trees. In order to reach the best decision, the RF method of Breiman (2001) makes a complete forest of random and uncorrelated decision trees. This method avoids the problem of over-fitting by forming multiple shallow trees instead of a single deep tree. A single predictor from a series of predictions is obtained by aggregating these trees’ predictions. It generally has much better predictive accuracy than a single decision tree.
Support vector machine
Support vector machine (SVM) is an important machine learning algorithm used for classification and regression problems and for detection of outlier in high dimensional spaces. As an alternative to a regression method and popular neural network models such as multi-layer perception and radial basis function classifiers, the SVM regression is generally used to estimate a nonlinear relationship between a target and a set of predictors. SVM of Vapnik et al. (1977) is implemented in practice using a kernel (linear, polynomial, radial) and hence considered as a nonparametric technique. In SVM, the problem is transformed into a quadratic optimization problem which can get the globally optimal solution. The SVM can take care of the practical problems such as nonlinearity, small sample size, local minimum and high dimensionality of the data (Vapnik, 1998).
Gradient boosting machine
Gradient boosting machine (GBM) is another popular forward learning ensemble machine learning algorithm among practitioners for classification, regression and ranking problems (Friedman, 2001). The intuition behind GBM is to train many models in a gradual, additive and sequential manner. The accuracy of trees is achieved by a flexible nonlinear regression procedure called boosting. This is achieved by creating a series of decision trees that produce an ensemble of weak prediction models. It tries to create a strong learner with good predictive performance from an ensemble of weak learners. GBM is highly customizable to any particular data and can handle highly correlated and missing data.
Model evaluation
In this study, we employed different criteria to assess the performance of the machine learning methods developed in this study modeling and predicting the body weight of beetal goats by means of various body measurements.
Pearson’s correlation (r)
The correlation coefficient between the fitted and observed body weight was calculated as:
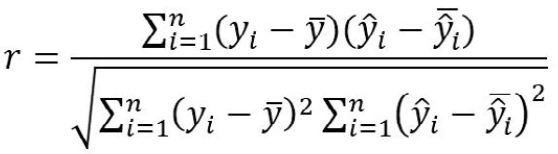
Where yi and ŷi are the observed and fitted weights, respectively, of the ith animal, ȳ and ŷ̅ are the average of all observed and predicted weights, respectively, and n represents the total number of samples. The correlation coefficient ranges between ̶ 1 and +1. A high positive value of r indicates a strong association between the observed and fitted values and hence a better fit.
Coefficient of determination (R2)
The proportion of variation of the dependent variable explained by independent variables are measured by the coefficient of determination. The range of R2 is from 0 to 1 with values close to 1 indicates a better fit. The R2 can be computed by taking the square of correlation coefficient and defined as:
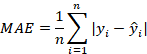
Mean absolute error (MAE)
Mean absolute error is a measure of the error where error is defined as the difference between the fitted values of the model and the actual (observed) values. Since the absolute errors are used, the MAE avoids the problem of negative and positive errors canceling each other out. Smaller MAE value from a model is an indication of a better fit.
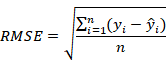
Root mean squared error (RMSE)
The root mean squared error is defined as the square root of the mean squared error and also known as the standard deviation of the residuals (prediction errors). Smaller values of RMSE are desired. The formula for calculating the RMSE is given as
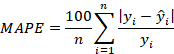
Mean absolute percentage error (MAPE)
Another popular measure of prediction error is the mean absolute percentage error. The MAPE measures the size of error in percentage terms and hence easy to interpret and understand. The smaller the MAPE the better the prediction. The MAPE is defined as
k-fold cross-validation
One of the commonly used statistical methods for assessing the effectiveness of a machine learning model is cross-validation. This method utilizes a resampling procedure and ideally suited for limited datasets. The cross validation starts with randomly dividing the dataset into k groups (subsamples) also known as folds of approximately equal size. The first fold (subsample) is used as a validation set, and the method is fitted on the remaining k˗1 folds. This procedure not only helps mitigate overfitting but also useful in determining the hyperparameters of the model. The cross-validationmethod has only one parameter k that denotes the number of groups that a given data sample is to be split into. Hence, the procedure is called k-fold crossvalidation. Generally, the value of 10 is selected for k. The 10-fold cross-validation is a popular choice among practitioners due to its simplicity, easy to implement procedure and less biased estimate. Instead of performing a single cross-validation and relying on its score, the repeated cross-validation that provides a more robust assessment score is suggested. In repeated cross validation, the cross-validation is repeated multiple times and the folds are split in a different wayin each repetition. A final assessment score is calculated by averaging the scores from all repetitions. We choose 10 repeated 10-fold cross-validation in this study.
In this study, we adopted the following approach to fit and assess the performance of competing machine learning methods. The data were initially partitioned randomly into two parts, the training (80%) and testing (20%) datasets. The 10-fold cross validation was applied on training dataset for tuning the parameters of the four machine learning methods and the best fitted models were obtained. The testing dataset was then used for the prediction of the target variable and evaluation of models. This approach of training, validating and testing models on separate datasets avoids the problem of overfitting commonly encountered when the competing models are fitted and evaluated on the whole data.
Figure 1 shows the layout of the methodology used in this study. Use of an independent testing dataset for validation purpose may help to better evaluate the predictive ability of fitted models. The R program (R Core Team, 2019) was used for all statistical analysis.
RESULTS
The results of different model evaluation measures employed to evaluate the performance of machine learning methods on both training and testing datasets are presented in Table II. The results of multiple linear regression analysis, excluded from this study on the suggestion of the anonymous referee, are available upon request. For the training sample, the values of coefficient of determination varied from 0.769 (for SVM) to 0.953 (for RF) whereas the values of coefficient of correlation ranged from 0.878 (for SVM) to 0.976 (for RF). The mean absolute error was found the lowest (1.159) for RF and the highest (2.459) for GBM. Similarly, the lowest values of RMSE (1.761) and MAPE (2.868) were observed for RF method and
Table II. Evaluating models based on different performance measures.
|
Model |
Training dataset (165 sample) |
Testing dataset (40 samples) |
||||||||
|
r |
R2 |
MAE |
RMSE |
MAPE |
r |
R2 |
MAE |
RMSE |
MAPE |
|
|
Regression trees |
0.904 |
0.816 |
2.292 |
3.382 |
5.657 |
0.878 |
0.770 |
2.909 |
3.721 |
7.059 |
|
Random forests |
0.976 |
0.953 |
1.159 |
1.761 |
2.868 |
0.886 |
0.785 |
2.784 |
3.583 |
6.839 |
|
Support vector machine |
0.878 |
0.769 |
2.492 |
3.804 |
6.281 |
0.882 |
0.778 |
2.787 |
3.695 |
6.957 |
|
Gradient boosting machine |
0.902 |
0.813 |
2.459 |
3.399 |
6.032 |
0.891 |
0.794 |
2.866 |
3.536 |
6.928 |
the highest values of these evaluation measures, 3.804 and 6.821, respectively, were obtained from SVM model. These findings from the results showed that the RF method provided the best results on all evaluation measures for the training dataset followed by RT method. The results of GBM methods were found similar to that of the RT method whereas the SVM methods was ranked the lowest.
Next, we compared the predictive performance of these machine learning methods on a testing dataset. Note that the best model for training dataset need not be the best model for prediction. One possible reason could be the overfitting of the model on the training dataset yet failing to predict the target variable accurately on the testing dataset. The results of evaluation measures used to assess the predictive performance of machine learning methods considered in this study on the testing dataset were also presented in Table II. Though the RF method that provided the best results on the training dataset showed good predictive ability on the testing dataset, as well, the GBM method may also be considered as one of the best models for predicting the body weight of goats. The values of r (0.891) and R2 (0.794) were the highest whereas the value of RMSE (3.536) was the lowest for the GBM method. Thevalues of r (0.886), R2 (0.785) and RMSE (3.583) for RF methods were found close to those of GBM. The MAE (2.784) and MAPE (6.839) of RF method were the lowest among all competing methods. Nevertheless, the RF method showed better results overall. SVM method, though could not provide the best fit for training data, showed reasonably better predictive performance than both RT method. To summarize the results of Table II we could say that RF is the best method among other machine learning methods used in this study for predicting the body weight of beetal goats. This method outperformed all other methods on training dataset and testing dataset (except GBM) on various evaluation measures. Thus, RF along with GBM could be used to develop the predictive models with greater accuracy for the body weight prediction of small ruminants.
The observed body weight of goats against the predicted body weights on the training dataset using four machine learning methods are shown in Figure 1. Though all methods provided reasonable fits, the R2 values of 0.794 for GBM followed by 0.785 for RF method were found the highest among all. This reinforced our findings of Table II where these two methods provided the best predictive performance among competing methods.
Figure 2 shows the importance of various body measures (predictors) identified by the gradient boosting method for describing the live body weight of beetal goats. The random forests method was found to choose the same variables with almost the same percentage of variation (results not shown). The sex of goats was found to be the most important variable describing around 25% of the variation in body weight. Rump height and head girth above eyes were also found to be important predictors describing 22% and 19% variations, respectively, in thebody weight. Other predictors such as body length (14%), shank circumference (13%) and neck length (7%), each contributed a little whereas belly sprung had no contribution in predicting the body weight of beetal goats.
Figure 3 shows 10-fold cross validation results of evaluation measures used in this study for the random forests method on the training dataset. The stability of the RF method can be seen asthe values of all evaluation measures in 10 iterations did not show large variations. Finally, we applied an independent two-sample t-test to test the significant difference between the observed and predicted body weightsof goats. The predicted body weights were obtained on the testing dataset from the best performing (random forests) method. The results of the t-test presented in Table III showed no statistical difference between the observed and predict body weights of RF method (p-value). Hence, these concluded your results and confirmed thatthe RF method provided an accurate fit to the body weight data of beetal goats.
Table III. Result of t-test for difference between the observed and predicted body weights for random forests.
|
Test variable |
Result of t-test |
|
|
t-stat |
p-value |
|
|
Body weight (kg) |
0.253 |
0.801 |
|
Number of observations |
40 |
DISCUSSION
The approach of finding the best model on 10-fold cross validation usinga training dataset and then predicting using the best model using testing dataset is different from similar studies in the literature. Besides, studies on machine learning methods used in this study for predicting the body weight of small ruminants are scarce. Therefore, the results obtained from the present research on machine learning methods for body weight prediction may not be directly compared with earlier results of classical regression and data mining methods reported in the literature. Nevertheless, we made an attempt to compare the results of our approach based on various evaluation measures.
The coefficient of correlation (r) values of 0.904 and 0.878 for RT method on training and testing dataset, respectively, are found higher than 0.821 reported by Eyduran et al. (2017) using RT method for the same data. The coefficient of correlation values of 0.848, 0864, and 0.834, for CHAID, RBF, and MLP method, respectively, reported by Eyduran et al. (2017) are smaller than those obtained from machine learning methods used in this study. Ali et al. (2015) used CHAID, ECHAID, RT and ANN models for predicting the live weight of Harnai sheep and found the ECHAID as the best model with r value of 0.918. Celik (2019) reported correlation coefficient values of 0.95, 0.80, and 0.77 for MARS, CHAID, and ECHAID data mining algorithms, respectively using data of Pakistan goats. Our r value of 0.976 for the RF method on the training dataset was much higher than the reported values in previous studies using classical and data mining methods.
The coefficient of determination R2 value of 0.953for RF on training dataset is found higher than those of Zergaw et al. (2017) who reported R2 value of 0.84for Woyoto-Guji goats of Ethiopia using MLR. Similarly, the R2 value of 0.91 reported by Celik (2019) for MARS algorithm was also found smaller than the R2 value of 0.953 for RF method in this study. The R2 values of 0.911 obtained by Jahan et al. (2013) using factor scores with multiple linear regressionfor the body weight of Balochi male sheep was also smaller than our R2 value for RF. Similarly, the reported values R2 = 0.72 by Mohammad et al. (2012) for predicting the body weight of indigenous sheep breeds of Balochistan using RT method and R2= 0.920 by Khan et al. (2014) for predicting the body weight in Harnai sheep werealso lower than those found in the present research. The highest value of R2=0.803 reported by Sam et al. (2016) for West African male dwarf goat using multiple linear regression was smaller than the estimates of our work. However, the R2 value of 0.950 ofmultiple linear regression by Tsegay et al. (2013) for Hararghe highland male goats of Ethiopia was similar to our R2 value for RF method.
The RMSE value of 1.761 of RF method for training dataset was found lower than the values of 1.488 for ECHAID (Ali et al., 2015), 1.590 for MLR (Zergaw et al., 2017), 3.94 for RBF (Eyduran et al., 2017) and 3.32 for MARS (Celik, 2019). The smallest values of MAE (2.786) and MAPE (6.878) for MLR obtained by Eyduran et al. (2017) were larger than MAE (1.159) and MAPE (2.868) values for RF method obtained in this study. Similarly, the values of MAD (2.67) and MAPE (8.49) for the MARS algorithm reported by Celik (2019) were also higher than those reported in the presented study for RF method. These findings clearly revealed that the predictive performance of the RF method is not only better than CHAID, MLP, MARS,and SVM.
CONCLUSION
This study employed four machine learning methods (regression trees, random forests, support vector machine, and gradient boosting) for modeling and predicting the body weight of beetal goats of Pakistan by means of various body measurements. The results of this study revealed that the random forests and gradient boosting method achieved greater accuracy as compared to other models used in the study and other data mining methods employed in earlier researches. For researchers and practitioners, the RF method can be used as an attractive alternative to the traditional method for modeling and predicting the body weight of small ruminants especially when there exists a complex nonlinear relationship between the target and predictors. Furthermore, the approach of using separate datasets for training and testing the models may avoid overfitting of data and achieve better prediction.
Statement of conflict of interest
The authors have declared no conflict of interest.
REFERENCES
Ali, M., Eyduran, E., Tariq, M.M., Tirink, C., Abbas, F., Bajwa, M.A., Baloch, M.H., Nizamani, A.H., Waheed, A., Awan, M.A., Shah, S.H., Ahmad, Z. and Jan, S., 2015. Comparison of artificial neural network and decision tree algorithms used for predicting live weight at post weaning period from some biometrical characteristics in Harnai Sheep. Pakistan J. Zool., 47: 1579-1585.
Aytekin, I., Eyduran, E., Karadas, K., Aksahan, R. and Keskin, I., 2018. Prediction of fattening final live weight from some body measurements and fattening period in young bulls of crossbred and exotic breeds using MARS data mining algorithm. Pakistan J. Zool., 50: 189-195. https://doi.org/10.17582/journal.pjz/2018.50.1.189.195
Breiman, L., 2001. Random forests. Mach. Learn, 45: 5-32. https://doi.org/10.1023/A:1010933404324
Breiman, L., Friedman, J.H., Olshen, R.A. and Stone, C.J., 1984. Classification and regression trees. Chapman and Hall/CRC.
Cam, M.A., Olfaz, M. and Soydan, E.,2010. Posibilities of using morphometrics characteristics as a tool for body weight production in Turkish hair goats (Kilkeci). Asian J. Anim. Vet. Adv., 5: 52-59. https://doi.org/10.3923/ajava.2010.52.59
Celik, S., 2019. Comparing predictive performances of tree-based data mining algorithms and MARS algorithm in the prediction of live body weight from body traits in Pakistan goats. Pakistan J. Zool., 51: 1447-1456. https://doi.org/10.17582/journal.pjz/2019.51.4.1447.1456
Celik, S., Eyduran, E., Tatliyer, A., Karadas, K., Kara, M.K. and Waheed, A., 2018. Comparing predictive performances of some nonlinear functions and multivariate adaptive regression splines (MARS) for describing the growth of DeraDınPanah (DDP) goat in Pakistan. Pakistan J. Zool., 50: 1187-1190. https://doi.org/10.17582/journal.pjz/2018.50.3.sc2
Economic Survey of Pakistan. 2017. Government of Pakistan, Finance Division, Economic Advisor Wing, Islamabad.
Eyduran, E., Waheed, A., Tariq, M.M., Iqbal, F. and Ahmad, S., 2013. Prediction of live weight from morphological characteristics of commercial goat in Pakistan using factor and principal component scores in multiple linear regression. J. Anim. Pl. Sci., 23: 1532-1540.
Eyduran, E., Zaborski, D., Waheed, A., Celik, S., Karadas, K. and Grzesiak, W., 2017. Comparison of the predictive capabilities of several data mining algorithms and multiple linear regression in the prediction of body weight by means of body measurements in the indigenous beetal goat of Pakistan. Pakistan J. Zool., 49: 257-265. https://doi.org/10.17582/journal.pjz/2017.49.1.257.265
Iqbal, M., Javed, K. and Ahmad, N., 2013. Prediction of body weight through body measurements in beetal goats. Pakistan J. Sci., 65: 458-461.
Jahan, M., Tariq, M.M., Kakar, M.A., Eyduran, E. and Waheed, A., 2013. Predicting body weight from body and testicular characteristics of Balochi male sheep in Pakistan using different statistical analyses. J. Anim. Pl. Sci., 23: 14-19.
Friedman, J.H., 2001. Greedy function approximation: a gradient boosting machine. Annls Stat., 29: 1189–1232. https://doi.org/10.1214/aos/1013203451
Khan, H., Muhammad, F., Ahmad, R., Nawaz, G., Rahimullah and Zubair, M., 2006. Relationship of body weight with linear body measurements in goats. J. Agric. biol. Sci., 1: 51-54.
Khan, M.A., Tariq, M.M., Eyduran, E., Tatliyer, A., Rafeeq, M., Abbas, F., Rashid, N., Awan, M.A. andJaved, K., 2014. Estimating body weight from several body measurements in Harnai sheep without multicollinearity problem. J. Anim. Pl. Sci., 24: 120-126.
Moaeen-ud-Din, M., Ahmad, N., Iqbal, A. and Abdullah, M., 2006. Evaluation of different formulas for weight estimation in Beetal, Teddi and crossbred (Beetal x Teddi) goats. J. Anim. Pl. Sci., 16: 3-4.
Mohammad, M.T., Rafeeq, M., Bajwa, M.A., Awan, A., Abbas, F., Waheed, A., Bukhari, A. and Akhtar, P., 2012. Prediction of body weights from body measurements using regression tree (RT) method for indigenous sheep breed in Balochistan, Pakistan. J. Anim. Pl. Sci., 22: 20-24.
Nelder, J.A. and Wedderburn, R.W.M., 1972. Generalized linear models. J. R. Stat. Soc. Ser. A., 135: 370-384. https://doi.org/10.2307/2344614
R Core Team., 2019. R: A language and environment for statistical computing. R Foundation for Statistical Computing, Vienna, Austria. URL https://www.R-project.org/.
Riva, J., Rizzi, R., Marelli, S. and Cavalchini, G., 2002.Body measurements in Bergamasca sheep. Small Rumin. Res., 55: 221-227. https://doi.org/10.1016/j.smallrumres.2003.12.010
Sam, I., Ekpo, J., Ukpanah, U., Eyoh, G. and Warrie, M., 2016. Relationship between linear body measurement and live body weight in west African dwarf goats in Obio Akpa. J. Biol. Agric. Hlth. Care, 6: 118–124.
Tsegaye, D., Belay, B. and Haile, A., 2013. Linear body measurements as predictor of body weight in Hararghe highland goats under farmers environment: Ethiopia. Glob. Vet., 11: 649–656.
Vapnik, V.N., 1998. Statistical learning theory.Wiley International.
Vapnik, V.N., Golowich, S. and Samola, A., 1977. Support vector method for function approximation, regression estimation, and signal processing. In:, Neural information processing systems (eds. M. Mozer, M. Jordan and T. Petsche), Vol. 9. MIT Press, Cambridge.
Verma, S.K., Dahiya, S.P., Malik, Z.S., Patil, C.S. and Patil, H.R., 2016. Biometrical characterization of Harnali sheep: A new synthetic strain. Indian J. Vet. Res., 25: 16-21.
Zergaw, N., Dessie, T. and Kebede, K., 2017. Using morphometric traits for live body weight estimation and multivariate analysis in Central Highland and Woyto-Guji goat breeds, Ethiopia. Afr. J. agric. Res., 12: 1326–1331. https://doi.org/10.5897/AJAR2016.11628
To share on other social networks, click on any share button. What are these?


