
Characterization of the Lactation Curve in Shami Cows


Research Article
Characterization of the Lactation Curve in Shami Cows
Mohamed Attia Ahmed Awad1*, Obaida Abdel Kareem Almasri2, Mohamed Abd El-Aziz Mohamed Ibrahim1, Rabie Ragab Sadek1, Samy Abou-Bakr1
1Department of Animal Production, Faculty of Agriculture, Cairo University, Giza 12613, Egypt; 2General Commission for Scientific Agricultural Research, Damascus, Syria.
Abstract | The objectives of this study were to estimate the lactation curve parameters, describe the shape of the lactation curve of Shami cows using Wood’s incomplete gamma function, and demonstrate the effect of environmental factors on the pattern of the lactation curve. A total number of 1533 weekly test-day records were collected on 584 Shami cows during the period from 1983 to 2012, at Deir Al-Hajar station belonging to the Ministry of Agriculture and Land Reclamation, Syria. Data were analyzed using the General Linear Model applied in XLSTATE software. The least squares means for the lactation curve parameters were 9.7 ± 0.12 kg for the initial milk yield (a), 0.40 ± 0.01 kg/week for the rate of increase to the peak (b), and 0.09 ± 0.001 kg/week for the rate of decline from the peak to dried off (c). The least squares means for the peak milk yield (PMY), peak week (PW), and persistency of lactation (P %) were 12.1 ± 0.11 kg, 4.5 ± 0.07 weeks, and 43.8 ± 1.11 %, respectively. The effect of parity on “a”, PMY, and PW was significant (P < 0.01). Season of calving affected significantly only on PMY and P % (P < 0.05). The effect of the period of calving was significant on all studied traits. It could be concluded that Wood’s incomplete gamma function was adequate to characterize the shape of the lactation curve for Shami cows and the shape of the lactation curve of Syrian Shami cows in the current study followed the ideal shape of other cattle breeds.
Keywords | Incomplete gamma function, Lactation curve parameters, Milk yield, Persistency, Shami cows
Received | December 22, 2021; Accepted | January 18, 2022; Published | March 10, 2022
*Correspondence | Mohamed Attia Ahmed Awad, Department of Animal Production, Faculty of Agriculture, Cairo University, Giza 12613, Egypt; Email: mohamed.awad@agr.cu.edu.eg
Citation | Awad MAA, Almasri OA, Ibrahim MAM, Sadek RR, Abou-Bakr S (2022). Characterization of the lactation curve in Shami cows. Adv. Anim. Vet. Sci. 10(4):786-794.
DOI | https://dx.doi.org/10.17582/journal.aavs/2022/10.4.786.794
ISSN (Online) | 2307-8316
Copyright: 2022 by the authors. Licensee ResearchersLinks Ltd, England, UK.
This article is an open access article distributed under the terms and conditions of the Creative Commons Attribution (CC BY) license (https://creativecommons.org/licenses/by/4.0/).
INTRODUCTION
Shami cows are considered the most important indigenous breed in Syria over hundreds of years ago; therefore, they have a long history of adaptation to the local environment, good resistance to several infectious diseases as well as a long productive life (Kaskous et al., 2006; Almasri et al., 2021). Shami cows play a vital role in the socio-economic life of small farmers and are considered very important elements in their daily life as these cows guarantee the milk supply in addition to providing the animal power. Under the appropriate management practices, Shami cows have the ability to produce about 1587 kg of milk in a lactation period of 165 days (Almasri et al., 2021). A lactation curve is a graphical shape that presents the alteration in milk production as a function of time throughout the lactation period (Lee et al., 2020). An ideal lactation curve includes three parts: An ascending stage between calving and peak production, a persistent stage of peak production, and a descending stage after the peak till dried up, where the lactation will be certainly finished (Capuco et al., 2003). Consequently, the pattern of the lactation curve is determined by the peak yield, the peak time, and persistency. Generally, in cattle, the peak milk yield occurs from 4 to 8 weeks after calving (Macciotta et al., 2005).
The lactation curve for dairy cows provides important information around the way of milk yield during lactation and could be used to evaluate the productive efficiency and consequently the genetic superiority of a dairy cow to determine the breeding policy. Also, the lactation curve enables tracking health situation, management conditions, reproductive efficiency, and predicting the current and future milk production from part lactation records that leads to culling or keeping cows early (Bermejo et al., 2020).
Many factors are affecting the lactation curve trajectory of cows such as year and season of calving, parity, gestation period, drying period before calving, management policy, and nutrition (Andersen et al., 2011).
Lactation persistency is normally expressed as the ability of the cow to maintain a consistent level of milk yield after peak production (Pereira et al., 2012). Cows with highly persistence rate that exhibits flatter lactation curves are more valuable and profitable than others with steep lactation curves. Persistent cows exposure to relatively lower stress during peak production and consequently lower rates for health and reproductive problems and costs (Cole et al., 2009). As well as, persistency could contribute to declining the feeding costs because the cows do not require highly energy feedstuffs at the beginning of the lactation (Sölkner and Fuchs, 1987). Also, the sudden drop in milk yield after the peak increases production cost because yield is distributed less equally over the complete lactation (Gupta et al., 2020). Therefore, persistency is considered one of the most important economic parameters and contributes to selection decisions (Pereira et al., 2012).
Numerous mathematical models have been proposed to fit the lactation curve for milk yield as well as its composition. Wood’s incomplete gamma function was the most appropriate model to describe the lactation curve for dairy cows due to its clarity; simplicity arises from the lower number of parameters and accuracy of description (Kopec et al., 2021). Wood’s model includes three parameters that characterize the shape of the lactation curve. These parameters are (a, b, and c) for initial milk production, ascending, and descending phases of the curve, respectively (Kopec et al., 2021). By using these parameters, Wood’s model could use to estimate some aspects of the lactation curve in terms of peak yield, peak time, persistency, and consequently the expected milk yield (Ben Abdelkrim et al., 2021). This model was also found as a suitable model to fit the lactation curve in other species such as buffalo (Abdel-Salam et al., 2011), goats (Bermejo et al., 2020), and sheep (Hernández et al., 2014).
Few scientific papers were found concerning to lactation curve parameters of Shami cows (Obaid et al., 2014). Therefore, this study aimed to estimate the lactation curve parameters, describe the shape of the lactation curve of Shami cows using Wood’s incomplete gamma function, and demonstrate the effect of environmental factors on the pattern of the lactation curve.
MATERIALS AND METHODS
Data
A total number of 1533 weekly test-day milk records collected on 584 Shami cows were used in the present study. The study area was Deir Al-Hajar station belonging to the Ministry of Agriculture and Land Reclamation, Syria which located between 32° 19’ and 37° 30’ N and 35° 45’ and 42° E. Data covered 30 years, from 1983 to 2012. Each record consists of cow number, birth date, calving date, dry date, parity, and the weekly test-day milk yield.
Herd management and milk recording
Cows were reared under a free housing system in shaded open yards covered with cement concrete. The feed was supplied twice daily. Ration given to the cows composed of straw, cottonseed hulls, and hay as roughages in addition to green fodder and concentrates. Water was provided constantly all over the day. Natural mating for the first time for heifers was conducted when achieved 18 months of age and 270 kg of weight. Pregnancy was checked by rectal palpation about 60 days after mating. The machine milked was applied on cows twice daily at 06.00 am. and 6.00 pm. through the lactation period. Cows were dried off two months before the expected date of the next calving. Milk production was recorded by weekly test-day milk yield to calculate the monthly milk yield and consequently the total milk production for each cow.
Studied traits
a. Lactation curve parameters
- Parameter (a): The initial milk yield (the amount of daily milk yield for each cow after calving, kg).
- Parameter (b): The rate of milk yield increase to peak during the ascending phase (kg/ week).
- Parameter (c): The rate of milk yield decrease during the descending phase (kg/ week).
b. Traits related to the shape of the lactation curve
- Peak milk yield (PMY, kg).
- Peak week (PW, weeks): The number of weeks to attain peak yield.
- Persistency of lactation (P %): Cow’s ability to maintain milk yield at a high level after the peak.
Statistical analysis
Statistical analysis to estimate the lactation curve parameters was carried out by using gamma-type function equation suggested by Wood (1967) as follows:
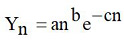
Where; Yn is the milk production (kg) in the nth week, “a” is the initial milk yield (kg) after calving, “b” is the rate of milk yield increase during the ascending phase (kg/week), “c” is the rate of milk yield decrease during the descending phase (kg/week), and “e” is base of natural logarithms. The estimates of lactation curve parameters a, b, and c were obtained by least squares method by XLSTAT software.
The traits related to the shape of lactation curve (PMY, kg= a (b/c)b e-b); (PW, weeks =b/c), and (P% = -(b+1)ln(c)) were also estimated according to the Wood (1967), where a, b and c are the estimates of the lactation curve parameters and ln is the natural logarithm.
To study the effect of parity, season, and period of calving on the lactation curve constants and traits related to lactation curve, data were analyzed by the General Linear Model of the statistical analysis program (XLSTAT 2020.1.2.56963) according to the following model:
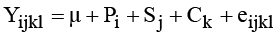
Where; Yijkl = the observation of the studied traits, µ = the overall mean, Pi= the fixed effect of ith parity, where (i=1, 2, .., ≥6), Sj= the fixed effect of jth season of calving (j= 1, 2, 3, 4), where, 1: winter (December to February), 2: spring (March to May), 3: summer (June to August); and 4: autumn (September to November), Ck = the fixed effect of kth period of calving (k= 1, 2, ….,6), where 1:1983-1987, 2: 1988-1992, 3: 1993-1997, 4: 1998-2002, 5: 2003-2007; and 6: 2008-2012; and eijkl = the random error assumed to be independently and normally distributed.
Phenotypic correlation coefficients between the different lactation curve traits were estimated using the XLSTAT 2020.1.2.56963 software.
RESULTS AND DISCUSSION
Lactation curve parameters (a, b, and c)
The overall mean of initial milk yield (parameter “a”) was 9.7 ± 0.12 kg, which is similar to that reported by Khalifa et al. (2018, 9.79 kg) in Holstein cows under North Africa conditions. Also, the current estimate is much closer to the finding of Ali et al. (2021) who found that parameter (a) was 10.8 kg in crossbred dairy cattle in India. However, higher estimates for the parameter (a) were reported by Elahi Torshizi (2016, 16.62 kg) in Iranian Holstein cows; Duque et al. (2018, 24.33 kg) in
Table 1: Least squares means and their standard errors (LSM±SE) of lactation curve parameters (a, b, and c) as affected by parity, season of calving, and period of calving.
|
Classification |
N |
Lactation curve parameters |
||
|
Parameter (a, kg) |
Parameter (b, kg/week) |
Parameter (c, kg/week) |
||
|
The overall mean |
1533 |
9.7±0.12 |
0.40±0.01 |
0.09±0.001 |
|
Parity |
** |
NS |
NS |
|
|
1 |
374 |
7.7a ±0.24 |
0.41±0.02 |
0.08±0.003 |
|
2 |
393 |
9.5b±0.23 |
0.44±0.02 |
0.09±0.003 |
|
3 |
303 |
10.5c±0.26 |
0.37±0.02 |
0.09±0.003 |
|
4 |
211 |
10.3c±0.31 |
0.39±0.03 |
0.09±0.004 |
|
5 |
152 |
10.2bc±0.37 |
0.43±0.03 |
0.004±0.09 |
|
≥6 |
99 |
10.2bc±0.46 |
0.39±0.04 |
0.005±0.09 |
|
Season of calving |
NS |
NS |
NS |
|
|
Winter |
353 |
9.7±0.25 |
0.39±0.02 |
0.09±0.003 |
|
Spring |
418 |
10.1±0.23 |
0.40±0.02 |
0.003±0.08 |
|
Summer |
359 |
9.7±0.25 |
0.41±0.02 |
0.09±0.003 |
|
Autumn |
403 |
9.5±0.24 |
0.42±0.02 |
0.003±0.09 |
|
Period of calving |
** |
** |
** |
|
|
1983-1987 |
197 |
11.0c±0.34 |
0.37a±0.03 |
0.10d±0.004 |
|
1988-1992 |
227 |
10.0b±0.31 |
0.46b±0.03 |
0.09cd±0.004 |
|
1993-1997 |
265 |
8.1a±0.28 |
0.36a±0.02 |
0.09bc±0.003 |
|
1998-2002 |
258 |
9.8b±0.29 |
0.39ab±0.02 |
0.07a±0.003 |
|
2003-2007 |
292 |
10.0b±0.28 |
0.43ab±0.02 |
0.08b±0.003 |
|
2008-2012 |
294 |
9.5b±0.27 |
0.41ab±0.02 |
0.07a±0.003 |
Means followed by different superscripts within each column are significantly different,**( P < 0.01), N: Number of observations, NS: Not significant; Parameter (a, kg): The initial milk yield, Parameter (b, kg/week): The rate of milk yield increase to peak during the ascending phase, Parameter (c, kg/week): The rate of milk yield decrease during the descending phase.
Colombian Holstein cows and Lee et al. (2020, 22.17 kg) in Holstein cows in Korea.
The overall mean of the parameter (b) was 0.40 ± 0.01 kg/week (Table 1). This estimate is almost similar to the finding of Fadlelmoula et al. (2007) who mentioned that parameter (b) was 0.45 kg/week in crossbred cows (Friesian x Ayrshire) in Sudan. However, the estimation of the parameter (b) is lower than the values reported by Elahi Torshizi (2016, 0.27 kg/day) in Iranian Holstein cows; Kshandakar et al. (2018, 0.239 kg/day) in Vrindavani cows in India and Ali et al. (2021, 0.141 kg/day) in crossbred dairy cattle in India.
The LSM of the parameter (c) was 0.09 ± 0.001 kg/week (Table 1). This estimate is higher than the values reported by Duque et al. (2018, 0.027 kg/week) in Colombian Holstein cows; Khalifa et al. (2018, 0.0037 kg/day) in Holstein cows under North Africa conditions; Ali et al. (2021, 0.003 kg/day) in crossbred dairy cattle in India and Atashi et al. (2021, 0.003 kg/day) in Iranian Holstein cows.
The existing variation in the estimation values for the lactation curve parameters between the current study and the previous studies could be attributed to the differences in management conditions, cattle breeds, and geographic and climatic variation.
Effect of parity on lactation curve parameters
The lactation curve of Shami cows according to parity is presented in Figure 1. Table 1 shows that the effect of parity on the parameter (a) was highly significant (P < 0.01). The lowest value of (a) was observed in the first parity (7.7 kg) compared to those of late parities. This could be due to the increase in the capacity of feed intake and full development of the mammary glands and body weight with parity increase, as well as cows in their first parity were still immature in body condition and apart of the metabolize energy is used for growth instead of producing milk. In addition, an increasing number of secretory cells with advancing parity led to an increase in the initial milk yield in later lactations. This result agrees with Rekik et al. (2003) in Holstein–Friesian cows in Tunisia and Duque et al. (2018) in Colombian Holstein cows. On the contrary, Soysal et al. (2005) and Ural and Koskan (2014) didn’t find any significant effect of parity on the initial milk yield of Holstein cows in Turkey.
Parameter (b) was not affected significantly by parity (P < 0.05) (Table 1), the LSM ranged between 0.37 kg/week in the third parity and 0.44 kg/week in the second parity. The same result was reported by Soysal et al. (2005); Ural and Koskan (2014) in Holstein cows in Turkey and Duque et al. (2018) in Holstein cows in Colombia. Conversely, Boujenane and Hilal (2012) mentioned a significant effect of parity on (b) in Holstein cows in Morocco. Also, the significant effect of parity on (b) was reported by Jingar et al. (2014) in crossbred cows (Karan x Friesian) in India. Furthermore, Bahashwan and Alfadli (2014) found that the estimate of (b) was significantly highest in the fourth lactation (1.420) compared with the lowest estimate in the ninth lactation (0.833) in Dhofari cows in the Sultanate of Oman.
Also, parameter (c) was not affected by parity (P < 0.05) (Table 1). The LSM ranged between 0.08 kg/week in the first parity and 0.09 kg/week in the other parities. This result is in accordance with the findings of Ural and Koskan (2014) in Holstein cows in Turkey. However, Fadlelmoula et al. (2007) found that (c) estimates were significantly lower (0.044) in the first parity compared to the fourth (0.057) and fifth (0.055) parities in crossbred dairy cows in Sudan. Likewise, Duque et al. (2018) found a significant effect of parity on (c) in Colombian Holstein cows. Furthermore, Bahashwan and Alfadli (2014) observed the significant effect of parity on (parameter “c”) in Dhofari cows in the Sultanate of Oman.
Effect of the season of calving on lactation curve parameters
The lactation curve of Shami cows according to the season of calving is presented in Figure 2. The effect of the season of calving on all the lactation curve parameters (a, b, and c) of Shami cows was not significant (P < 0.05) (Table 1). This result might be due to the lack of differences in the feed quality and management practices among seasons. This result agrees with Fadlelmoula et al. (2007) in crossbred cows in Sudan. However, Güler and Yanar (2009) and Khalifa et al. (2018) reported that the effect of the season of calving was significant on lactation curve parameters (a, b, and c) in Holstein–Friesian cows in Turkey and Tunisia, respectively. On the other hand, Elahi Torshizi (2016) found that the lowest value of parameter “a” (15.30 kg) was observed for Holstein cows calved in summer compared to those calved in winter (15.68 kg) in Iran, however they mentioned that there was a non-significant effect of the season of calving on parameters (b and c).
Effect of the period of calving on lactation curve parameters
The lactation curve of Shami cows according to the period of calving is presented in Figure 3. Table 1 shows that the period of calving had a highly significant effect (P < 0.01) on all the lactation curve parameters (a, b, and c). The effect of the period of calving reflects the difference in environmental conditions such as temperature, nutrition, and management practices over the years. This result is in accordance with the finding reported by Güler and Yanar (2009) in Holstein Friesian cows in Turkey. Furthermore, similar findings were observed by Fadlelmoula et al. (2007) who found that the period of calving had a significant effect on parameters (a and c), however, a non-significant effect was reported for the parameter (b) in crossbreds in Sudan.
Traits related to the shape of the lactation curve (PMY, PW, and P %)
The lactation curve revealed that milk production increased gradually after calving to the peak milk yield of 12.1 ± 0.11 kg that was reached during 4.5 ± 0.07 weeks then decreased gradually until the drying period with a persistency of lactation of 43.8 ± 1.11 % (Table 2).
The estimate of PMY (12.1 ± 0.11 kg) is lower than those reported by Ali et al. (2021) who found that PMY was 15.14 kg in crossbred dairy cattle in India and Khalifa et al. (2018) who found that PMY was 23.17 kg in Holstein cows under North Africa conditions.
However, the value of PMY in the present study is greater than the estimate obtained by Bahashwan and Alfadli (2014) who reported that PMY was 9.11 kg in local Dhofari cows in the Sultanate of Oman. The discrepancy among estimates may be due to variations among breeds, climate change, number of records, and management practices.
The overall mean of the PW was 4.5 ± 0.07 weeks, which is almost closed to those reported by Güler and Yanar (2009, 46.98 days) in Holstein Friesian cows in Turkey; Albarrán-Portilloa and Pollott (2011, 34 days) in dairy cows in the UK; Duque et al. (2018, 4.1 weeks) in Colombian Holstein cows and Ali et al. (2021, 45.48 days) in crossbred dairy cattle in India. However, higher estimates were reported by different studies such as Khalifa et al. (2018, 84.86 days) in Holstein cows in Tunisia and Lee et al. (2020, 68.9 days) in Holstein cows in Korea.
The overall mean of the P % was 43.8 ± 1.11 %, which is lower than those reported by Bahashwan and Alfadli (2014, 75.92 %) in local Dhofari cows in Sultanate of Oman and Duque et al. (2018, 74%) in Colombian Holstein cows. The differences in the persistency of lactation might be due to variations in breeds, nutrition, hygiene, management, and environmental conditions.
Effect of parity on PMY, PW, and P %
The PMY increased significantly (P < 0.05) with increasing parity till the fifth parity. It was 9.7 kg in the first parity compared to 13.2 kg in the fifth (Table 2). This could be due to the increase in feed intake and udder size, and full development of the mammary glands in multiparous cows compared with primiparous cows, which led to an increase of PMY in the fifth parity. However, the reduction in PMY after the fifth parity might be due to the decreasing rate of secretory cells with the progress of age. Similar findings were reported by Güler and Yanar (2009) who reported that the greatest PMY was recorded in the fourth lactation (18 kg) compared to the later parities in Holstein Friesian cows in Turkey. Furthermore, Duque et al. (2018) reported that PMY was 22.6 kg in the first lactation and 30.2 kg in the fifth lactation in Colombian Holstein cows. Also, Niozas et al. (2019) mentioned that PMY was the lowest (38.81 kg) in the first parity compared to the mean PMY in the later parities (50.38 kg) in Holstein cows in Germany.
Also, the effect of parity on PW was highly significant (P < 0.01). The values ranged from four weeks in the third parity to 4.9 weeks in the fifth (Table 2). In the current study, cows in their first and fifth parities attained peak
Table 2: Least squares means and their standard errors (LSM ± SE) of the traits related to the shape of lactation curve (PMY, PW, and P %) as affected by parity, season of calving, and period of calving.
|
Classification |
N |
Traits related to the shape of the lactation curve |
||
|
PMY (kg) |
PW (weeks) |
P % |
||
|
The overall mean |
1533 |
12.1±0.11 |
4.5±0.07 |
43.8±1.11 |
|
Parity |
* |
** |
NS |
|
|
1 |
374 |
9.7a±0.22 |
4.8b±0.14 |
46.0±2.27 |
|
2 |
393 |
12.1b±0.22 |
4.6b±0.13 |
46.7±2.20 |
|
3 |
303 |
12.6bc±0.25 |
4.0a±0.15 |
37.6±2.50 |
|
4 |
211 |
12.8bc±0.30 |
4.4ab±0.18 |
42.3±3.02 |
|
5 |
152 |
13.2c±0.35 |
4.9b±0.22 |
48.0±3.58 |
|
≥6 |
99 |
12.3bc±0.43 |
4.2ab±0.27 |
41.9±4.40 |
|
Season of calving |
* |
NS |
* |
|
|
Winter |
353 |
12.0ab±0.23 |
4.5±0.15 |
46.8b±2.38 |
|
Spring |
418 |
12.5b±0.22 |
4.4±0.14 |
44.0ab±2.24 |
|
Summer |
359 |
12.1ab±0.24 |
4.5±0.15 |
44.3ab±2.39 |
|
Autumn |
403 |
11.9a±0.23 |
4.5±0.14 |
39.9a±2.29 |
|
Period of calving |
** |
** |
** |
|
|
1983-1987 |
197 |
12.4b±0.33 |
3.4a±0.20 |
27.1a±3.30 |
|
1988-1992 |
227 |
12.9b±0.29 |
4.5b±0.18 |
39.7b±2.94 |
|
1993-1997 |
265 |
9.4a±0.27 |
3.7a±0.17 |
30.2a±2.71 |
|
1998-2002 |
258 |
12.6b±0.27 |
5.3d±0.17 |
54.9c±2.78 |
|
2003-2007 |
292 |
12.8b±0.26 |
4.8bc±0.16 |
54.2c±2.65 |
|
2008-2012 |
294 |
12.5b±0.25 |
5.2cd±0.16 |
56.4c±2.57 |
Means followed by different superscripts within each column are significantly different, *(P < 0.05), **(P < 0.01), N: Number of observations, NS: Not significant, PMY: Peak Milk Yield, PW: Peak Week, and P %: Persistency of lactation.
yield lately compared to other ones. A similar trend was reported by Boujenane and Hilal (2012) in Holstein cows in Morocco and Jiang et al. (2020) in Holstein-Friesian, Jersey, and their crossbreds in New Zealand.
The persistency of lactation (P %) didn’t show any significant differences among parities (P < 0.05) (Table 2). In contrary to our finding, Jingar et al. (2014) in crossbred cows (Karan x Friesian) in India; Duque et al. (2018) in Colombian Holstein cows and Burgers et al. (2021) in Holstein Friesian cows in Netherland reported that the persistency of lactation was high in the first parity and decreased with increasing the parity number. They attributed that cows of early parities have a high ability to maintain their number of active secretory cells in the mammary glands for a longer period compared to cows of later parities (Miller et al., 2006).
Effect of the season of calving on PMY, PW, and P %
With regard to the significant effect of the season of calving on PMY (P < 0.05), the lowest value of PMY (11.9 kg) was observed in autumn, while the highest one (12.5 kg) was recorded in spring (Table 2). This is due to the shortage of green fodder during autumn in Syria, while the favorable green fodder and convenient temperature during spring led to an increase in the PMY. This result is in agreement with Albarrán-Portilloa and Pollott (2011) who indicated that PMY was higher in winter and spring (34.1 and 33.9 kg, respectively) compared to autumn and summer (32.3 and 32.6 kg, respectively). However, this result is inconsistent with the results reported by Fadlelmoula et al. (2007) who demonstrated that the effect of the season of calving on PMY was not significant in crossbred cows in Sudan.
The effect of the season of calving on PW was not significant (P < 0.05) (Table 2), which is in accordance with Boujenane and Hilal (2012) in Holstein cows in Morocco. On the other hand, Duque et al. (2018) found a significant effect of the season of calving on PW in Colombian Holstein cows. They found that cows calved in the rainy season reached the peak yield early (4.4 weeks) compared with those calved in the dry season (5 weeks). Khalifa et al. (2018) indicated that peak time was significantly lower in spring (82.49 days) compared to summer (87.73 days) in Holstein cows in Tunisia.
Season of calving affected significantly (P < 0.05) on P %,
Table 3: Phenotypic correlation coefficients between the studied traits in Shami cows
|
Lactation curve traits |
a (kg) |
b (kg/ week) |
c (kg/ week) |
PMY (kg) |
PW (weeks) |
(P %) |
|
a (kg) |
-0.566* |
-0.423* |
0.694* |
-0.419* |
-0.164* |
|
|
b (kg/week) |
-0.566* |
0.783* |
0.078* |
0.638* |
-0.191* |
|
|
c (kg/week) |
-0.423* |
0.783* |
-0.120* |
0.129* |
-0.233* |
|
|
PMY (kg) |
0.694* |
0.078* |
-0.120* |
0.232* |
0.167* |
|
|
PW (weeks) |
-0.419* |
0.638* |
0.129* |
0.232* |
0.588* |
|
|
(P %) |
-0.164* |
-0.191* |
-0.233* |
0.167* |
0.588* |
Number of records = 1533, * (P < 0.05), Parameter (a, kg): The initial milk yield, Parameter (b, kg/week): The rate of milk yield increase to peak during the ascending phase, Parameter (c, kg/week): The rate of milk yield decrease during the descending phase, PMY: Peak Milk Yield, PW: Peak Week, and P %: Persistency of lactation.
it was the lowest (39.9 %) during autumn and the highest (46.8 %) was during winter (Table 2). This is due to the lack of green fodder and environmental conditions during autumn which resulted in reducing the persistency rate of lactation. However, the proper climate and available green fodder contributed to improving the persistency of lactation during the winter in Syria. Similar findings were observed by Albarrán-Portilloa and Pollott (2011) and Koloi et al. (2018) in dairy cows in the UK and Jersey crossbreds in India, respectively. In opposite results, Duque et al. (2018) indicated that the effect of the season of calving on persistency of lactation was not significant in Colombian Holstein cows.
Effect of the period of calving on PMY, PW, and P %
The effect of the period of calving on all traits related to the shape of the lactation curve was highly significant (P < 0.01) (Table 2). The differences among periods could be attributed to variations in management, climate conditions, and feed quality over the years. The current result is in accordance with the findings reported by Fadlelmoula et al. (2007) in crossbred cows in Sudan. Also, Duque et al. (2018) found that the period of calving had a significant effect on peak yield and peak time in Colombian Holstein cows. Conversely, Albarrán-Portilloa and Pollott (2011) didn’t find any significant effect of period of calving on peak milk yield and peak week.
Phenotypic correlation coefficients
The phenotypic correlation coefficients between the studied traits are presented in Table 3. The phenotypic correlations between (a) and both (b and c) were significantly (P < 0.05) negative (-0.566 and -0.423, respectively). This result indicates that Shami cows that started their lactation with higher initial milk yield (a) are probably having a lower rate of increase (b) to attain their peak milk yield and then exhibit a declining trajectory (c) at a slower rate, and consequently show more persistency rate (flatter lactation curve). Furthermore, a significant and highly positive phenotypic correlation (0.783) was estimated between (b and c) parameters. This means that Shami cows that reach the peak point more quickly within a shorter time, also exhibit a sharp decline after the peak point. These findings agree with results reported by Fadlelmoula et al. (2007); Güler and Yanar (2009) and Elahi Torshizi (2016).
Parameter (a) showed a significant inverse relationship with both PW and P % (-0.419 and -0.164, respectively). However, a significant positive correlation was estimated between (a) and PMY (0.694). The phenotypic correlations between parameter (b) and both PMY and PW were significant and positive (0.078 and 0.638, respectively). However, a significant negative correlation was observed between parameter (b) and P % (-0.191). These results revealed that cows with highly initial milk yield at the beginning of lactation, achieve a high peak milk yield within a shorter period, however, these cows could be least persistent. Parameter (c) showed a negative correlation with both PMY and P % (-0.120 and -0.233, respectively), but there was a positive correlation between (c) and PW (0.129). This result implies that cows with a low rate of declining after peak were associated with higher persistency. These results are in agreement with Boujenane and Hilal (2012) and Elahi Torshizi (2016).
The phenotypic correlations between the traits related to the shape of the lactation curve (PMY, PW, and P %) were significant and showed a positive relationship between them. The results demonstrated that Shami persistent cows have a lactation curve with a higher peak milk yield and late peak time than less persistent cows. Moreover, the lower time interval (PW) between (a, and PMY) was associated with lower persistency. Therefore, PMY and PW traits could be used as indicators to enhance the persistency and consequently the total milk yield throughout the lactation. These results are in accordance with the findings of Güler and Yanar (2009) and Elahi Torshizi (2016).
CONCLUSION and Recommendations
It could be concluded that Wood’s incomplete gamma function was adequate to characterize the shape of the lactation curve for Shami cows and the shape of the lactation curve of Syrian Shami cows in the current study followed the ideal shape of other cattle breeds. The current results provide a broad knowledge about the lactation curve of Shami cows which could be used as a tool to predict their productive potential and the standard lactation length; consequently, this knowledge could contribute to management and selection decisions.
ACKNOWLEDGMENTS
The authors are grateful to the Institute of International Education’s Scholar Rescue Fund (IIE-SRF) for their financial support to the second author and for providing necessary facilities for conducting this work.
Novelty Statement
This work is considered one of the first studies to characterize the lactation curve of the Shami cows breed, which could provide valuable information about their productive ability.
AUTHOR’S CONTRIBUTION
Mohamed Attia Ahmed Awad: Contributed to the analysis of the data, interpreted the results, and wrote the manuscript. Obaida Abdel Kareem Almasri: Designed the study and collected the data. Mohamed Abd El-Aziz Mohamed Ibrahim: Conducted the statistical analysis of the data. Rabie Ragab Sadek and Samy Abou-Bakr: Reviewed and revised the manuscript. All authors read and approved the final manuscript.
Availability of data and material
Data will be provided by the corresponding author on reasonable request.
Ethical approval
The study did not involve animal handling.
Conflict of interest
The authors have declared no conflict of interest.
REFERENCES
Abdel-Salam SAM, Mekkawy W, Hafez YM, Zaki AA, Abou-Bakr S (2011). Fitting lactation curve of Egyptian buffalo using three different models. Egypt. J. Anim. Prod., 48(2): 119-133. Available at: https://ejap.journals.ekb.eg/article_94054_ffaedb9f7f7a094aeda83a3d24907de5.pdf, https://doi.org/10.21608/ejap.2011.94054
Albarrán-Portilloa B, Pollott, GE (2011). Environmental factors affecting lactation curve parameters in the United Kingdom’s commercial dairy herds. Arch. Med. Vet., 43: 145-153. Available at: https://www.scielo.cl/pdf/amv/v43n2/art07.pdf, https://doi.org/10.4067/S0301-732X2011000200007
Ali TM, Narang R, Dubey PP, Kaur S (2021). Characterization of lactation curve patterns using non-linear models in crossbred dairy cattle. Indian J. Anim. Res., pp. 1-7. https://doi.org/10.18805/IJAR.B-4289
Almasri O, Abou-Bakr S, Ibrahim MAM (2021). Characterization of some productive and reproductive traits of Syrian Shami and Holstein cows under Syrian conditions. Egypt. J. Anim. Prod., 58(1): 21-28. Available at: https://ejap.journals.ekb.eg/article_155369_a90c3658efbd0653ea70affdaff0ccb2.pdf, https://doi.org/10.21608/ejap.2021.58121.1010
Andersen F, Østerås O, Reksen O, Toft N, Gröhn YT (2011). Associations between the time of conception and the shape of the lactation curve in early lactation in Norwegian dairy cattle. Acta Vet. Scand., 53: 5. http://www.actavetscand.com/content/53/1/5, https://doi.org/10.1186/1751-0147-53-5
Atashi H, Asaadi A, Hostens M (2021). Association between age at first calving and lactation performance, lactation curve, calving interval, calf birth weight, and dystocia in Holstein dairy cows. PLoS One, 16(1): e0244825. https://doi.org/10.1371/journal.pone.0244825
Bahashwan S, Alfadli S (2014). Dhofari cow’s potentiality of milk production and lactation curve. Net J. Agric. Sci., 2(2): 74-78. Available at: http://www.netjournals.org/pdf/NJAS/2014/2/14-029.pdf
Ben Abdelkrim A, Puilleta L, Gomesac P, Martina O (2021). Lactation curve model with explicit representation of perturbations as a phenotyping tool for dairy livestock precision farming. Animal, 15: 10007415. https://doi.org/10.1016/j.animal.2020.100074
Bermejo JVD, Pérez FAL, González FJN, Jurado JML, Álvarez JF, da Gama LT (2020). Conditioning factors of linearized Wood’s function lactation curve shape parameters, milk yield, fat and protein content in Murciano Granadina primiparous does. Animals, 10: 2115. https://doi.org/10.3390/ani10112115
Boujenane I, Hilal B (2012). Genetic and non genetic effects for lactation curve traits in Holstein-Friesian cows. Arch. Tierz., 55 (5): 450-457. https://doi.org/10.5194/aab-55-450-2012
Burgers EEA, Kok A, Goselink RMA, Hogeveen H, Kemp B, Van Knegse, ATM (2021). Fertility and milk production on commercial dairy farms with customized lactation lengths. J. Dairy Sci., 104: 443-458. https://doi.org/10.3168/jds.2019-17947
Capuco AV, Ellis, SE, Hale SA, Long E, Erdman RA, Zhao X, Paape MJ (2003). Lactation persistency: Insights from mammary cell proliferation studies. J. Anim. Sci., 81: 18-31. https://doi.org/10.2527/2003.81suppl_318x
Cole JB, Null DJ, De Vries A (2009). Short communication: Best prediction of 305-day lactation yields with regional and seasonal effects. J. Dairy Sci., 94: 1601–1604. https://doi.org/10.3168/jds.2010-3865
Duque NP, Casellas J, Quijano JH, Casals R, Such X (2018). Fitting lactation curves in a Colombian Holstein herd using nonlinear models. Rev. Fac. Nac. Agron. Medellín, 71(2): 8459-8468. https://doi.org/10.15446/rfna.v71n2.67424
Elahi Torshizi M (2016). Effects of season and age at first calving on genetic and phenotypic characteristics of lactation curve parameters in Holstein cows. J. Anim. Sci. Technol., 58(8): 1-14. https://doi.org/10.1186/s40781-016-0089-1
Fadlelmoula AA, Yousif IA, Abu Nikhaila AM (2007). Lactation curve and persistency of crossbred dairy cows in the Sudan. J. Appl. Sci. Res., 3(10): 1127-1133. Available at: http://api.uofk.edu:8080/api/core/bitstreams/cd4195a1-e13d-4102-973d-49f673c86899/content
Güler O, Yanar M (2009). Factors influencing the shape of lactation curve and persistency of Holstein Friesian cows in high altitude of eastern Turkey. J. Appl. Anim. Res., 35(1): 39-44. https://doi.org/10.1080/09712119.2009.9706981
Gupta R, Sahoo SK, Kaur S, Dash SK, Malhotra P (2020). Modeling lactation curve for test day milk yields in Holstein Friesian crossbred cattle. Int. J. Livest. Res., 10(9): 31-36. https://doi.org/10.5455/ijlr.20200618053135
Hernández JCA, Ortega OC, Portillo BA, Montaldo HH, Ronquillo MG (2014). Application of the wood model to analyse lactation curves of organic dairy sheep farming. Anim. Prod. Sci., 54: 1609-1614. https://doi.org/10.1071/AN14272
Jiang H, Hicksona RE, Woods OT, Morandeaub M, Burkea JL, Correa-Lunaa M, Donaghya DJ, Lopez-Villalobosa N (2020). Persistency and lactation curves modelled using nonlinear random regression in dairy cows milked once a day. N. Z. J. Anim. Sci. Prod., 80: 131-136. Available at: https://www.nzsap.org/system/files/proceedings/persistency-and-lactation-curves-modelled-using-nonlinear-random-regression-dairy-cows-milked-once.pdf
Jingar S, Mehla RK, Singh M, Roy AK (2014). Lactation curve pattern and prediction of milk production performance in crossbred cows. J. Vet. Med., Article ID 814768, 6 pages. https://doi.org/10.1155/2014/814768
Kaskous SH, Weiss D, Y. Massri, Al-Daker AB, Nouh A, Bruckmaier RM (2006). Oxytocin release and lactation performance in Syrian Shami cattle milked with and without suckling. J. Dairy Res., 73(1): 28-32. https://doi.org/10.1017/S0022029905001329
Khalifa M, Hamrouni A, Djemali M (2018). The estimation of lactation curve parameters according to season of calving in Holstein cows under North Africa environmental conditions: The case of Tunisia. J. New Sci., 50(5): 3048-3053. Available at: https://www.jnsciences.org/agri-biotech/73-volume-50/443-the-estimation-of-lactation-curve-parameters-according-to-season-of-calving-in-holstein-cows-under-north-africa-environmental-conditions-the-case-of-tunisia.html
Koloi S, Pathak K, Behera R, Mandal DK, Karunakaran M, Dutta TK, Mandal A (2018). Factors affecting the persistency of milk production in Jersey crossbred cattle. J. Dairy Vet. Anim. Res., 7(6): 268‒271. https://doi.org/10.15406/jdvar.2018.07.00225
Kopec T, Chládek G, Falta D, Kučera J, Večeřa M, Hanuš O (2021). The effect of extended lactation on parameters of Woods model of lactation curve in dairy Simmental cows. Anim. Biosci., 34(6): 949-956. https://doi.org/10.5713/ajas.20.0347
Kshandakar S, Verma MR, Singh YP, Kumar S (2018). Effect of parity and calving season on modelling of lactation curves of Vrindavani cattle. Pharm. Innov., 7(10): 185-193. Available at: https://www.thepharmajournal.com/archives/2018/vol7issue10/PartD/7-9-51-806.pdf
Lee M, Lee S, Park J, Seo S (2020). Clustering and characterization of the lactation curves of dairy cows using k-medoids clustering algorithm. Animals, 10: 1348. https://doi.org/10.3390/ani10081348
Macciotta NPP, Vicario D, Cappio-Borlino A (2005). Detection of different shapes of lactation curve for milk yield in dairy cattle by empirical mathematical models. J. Dairy Sci., 88: 1178–1191. https://doi.org/10.3168/jds.S0022-0302(05)72784-3
Miller N, Delbecchi L, Petitclerc D, Wagner GF, Talbot BG, Lacasse P (2006). Effect of stage of lactation and parity on mammary gland cell renewal. J. Dairy Sci., 89: 4669-4677. https://doi.org/10.3168/jds.S0022-0302(06)72517-6
Niozas G, Tsousis G, Malesios C, Steinhöfe I, Boscos C, Bollwein H, Kaske M (2019). Extended lactation in high-yielding dairy cows. II. Effects on milk production, udder health, and body measurements. J. Dairy Sci. 102: 811–823. https://doi.org/10.3168/jds.2018-15117
Obaid, D, Kaskous Sh, Al-Najjar Kh (2014). Description of lactation curve and some factors affecting it in Shami cattle. Damascus University J. Agric. Sci., 30(1): 127-139. Available at: http://damascusuniversity.edu.sy/mag/farm/images/stories/1-2014/127-139.pdf
Pereira RJ, Verneque RS, Lopes PS, Santana ML, Lagrotta MR, Torres RA, VercesiFilho AE, Machado MA (2012). Milk yield persistency in Brazilian Gyr cattle based on a random regression model. Genet. Mol. Res., 11(2): 1599-1609. https://doi.org/10.4238/2012.June.15.9
Rekik B, BenGara A, Ben Hamouda M, Hammami H (2003). Fitting lactation curves of dairy cattle in different types of herds in Tunisia. Livest. Prod. Sci., 83: 309-315. https://doi.org/10.1016/S0301-6226(03)00028-9
Sölkner J, Fuchs W (1987). A comparison of different measures of persistency with special respect to variation of test- day yields. Livest. Prod. Sci., 16: 305–319. https://doi.org/10.1016/0301-6226(87)90001-7
Soysal MI, Mutlu F, Gurcan EK (2005). A study of the lactation biometry of Black and White dairy cows raised in private farms in Turkey. Trakia J. Sci., 3(6): 11-16. Available at: http://tru.uni-sz.bg/tsj/Vol3No6/Soysal%20et%20al%20-%201.pdf
Ural DA, Koskan O (2014). The estimation of lactation curve parameters from test-day milk yield in Holstein-Friesian cows in Bozdogan province in Turkey. Res. J. Agric. Environ. Manag., 3(2): 145-150. Available at: https://www.apexjournal.org/rjaem/archive/2014/Feb/fulltext/Ural%20and%20Koskan.pdf
Wood PDP (1967). Algebraic model of the lactation curve in cattle. Nature, 216: 164-165. https://doi.org/10.1038/216164a0
To share on other social networks, click on any share button. What are these?

