South Asian Journal of Life Sciences


Research Article

Ichthyofauna of Tovè River in the South Benin: Specific Diversity and Spatial Distribution
Gildas Djidohokpin1,2*, Edmond Sossoukpe1, Zacharie Sohou1,3, Joseph L. Tamesse2, Emile D. Fiogbe1
1Research Laboratory on Wetlands (LRZH), Department of Zoology, Faculty of Sciences and Technics, University of Abomey-Calavi (UAC), B.P. 526 Cotonou, Benin; 2Zoology Laboratory, Higher Teachers’ Training College, University of Yaoundé I, P.O. Box 47, Yaoundé, Cameroon; 3Benin Fisheries and Oceanologic Research Institute (IRHOB), 03 B.P. 1665 Cotonou, Benin.
Abstract | Aquatic ecosystems shelter an important animal biological diversity, which constitute a protein source for populations. In order to ensure the sustainable management of these commercially important resources, this study was conducted to explore the ichthyological fauna of the Tovè River in Benin. The fish fauna was sampled from October 2015 to September 2016 with a range of several fishing gears. A total of 46 species belonging to 30 genus and 19 families were identified. Cichlidae are the most dominant family with 13 species followed by Mormyridae with 7 species, Characidae and Clariidae, are represented each by 4 species. The most dominant species are Synodontis schall, Shilbe intermedius and Tilapia dageti respectively. The species richness is not significantly different between the 3 study areas (p > 0.05). The river upstream is the station that has the highest species richness (39 species). The middle and downstream of the river are the stations where there is the low species richness (35 and 31 species respectively). The spatial distribution of the fish fauna and its diversity are important data to be taken into consideration to establish a sustainable management of the ichthyological fauna of Benin.
Keywords | Tovè river, Inventory, Ichtyofauna, Specific diversity, Spatial distribution, Benin
Editor | Muhammad Nauman Zahid, Quality Operations Laboratory, University of Veterinary and Animal Sciences, Lahore, Pakistan.
Received | May 12, 2017 Accepted | August 23, 2017; Published | August 30, 2017
*Correspondence | Gildas Djidohokpin, Research Laboratory on Wetlands (LRZH), Department of Zoology, Faculty of Sciences and Technics, University of Abomey-Calavi (UAC), B.P. 526 Cotonou, Benin; Email: [email protected]
Citation | Djidohokpin G, Sossoukpe E, Sohou Z, Tamesse Jl, Fiogbe ED (2017). Ichthyofauna of tovè river in the south benin: specific diversity and spatial distribution. S. Asian J. Life Sci. 5(1): 19-29.
DOI | http://dx.doi.org/10.17582/journal.sajls/2017/5.1.19.29
ISSN | 2311–0589
Copyright © 2017 Djidohokpin et al. This is an open access article distributed under the Creative Commons Attribution License, which permits unrestricted use, distribution, and reproduction in any medium, provided the original work is properly cited.
INTRODUCTION
The aquatic ecosystems provide various goods and services that are not often valued (Brummett et al., 2008). The knowledge of the aquatic resource is a prerequisite for sustainable management of fisheries. Unfortunately African ichtyofauna remains underexplored (Lévêque and Paugy, 2006).
Indeed, in spite of the signing of the Convention on Biological Diversity by the most of countries (Lévêque and Paugy, 2006), many rivers and lakes are still not explored in some countries. Moreover some rivers have not yet been subject to systematic ichtyological inventory and their fish fauna is extrapolated across one part of their watershed. Therefore, in recent years scientists and development managers have started investigations on ichtyofauna of African rivers and lakes (Gourène et al., 1999).
In Benin, several studies have been conducted in recent years on some rivers and reservoirs (Adité, 1990; Niyonkuru, 2001; Ahouansou Montcho, 2003). Moreover, some studies about bio-ecology aspects of fish were conducted by De Kimpe (1967), Adité and Winemiller (1997), Lalèyê et al. (1997), Sossoukpè et al. (2016). More research on fisheries aspects by Welcomme (1971) and Fisheries Direction of Benin (1987) show that fish species collected are diversified. These studies conducted up to now lack a comprehensive inventory of the fish fauna in Benin freshwaters. The available information on fish fauna of this country rivers or lake is sometimes fragmentary and not up to date. This very rich and diversified fish fauna constitutes an important source of proteins and incomes for the local populations. In Benin country, fish constitutes the most important source of animal proteins for the population and represent 31.9% of the total animal proteins of origin and about 5.5% of the total proteins (FAO, 2004). Fish remains a commodity perfectly integrated as food in Benin (Pliya, 1980). In addition, fish is relatively cheaper and its flesh constitutes an alternative to overcome malnutrition because of the high biological value of its protein and essential amino acids (Pliya, 1980).
Therefore there is an urgent need to update comprehensive knowledge of the fishery composition of each aquatic ecosystem in Benin. This approach requires a perfect knowledge since our freshwaters ichtyofauna is still poorly known.
Benin, a coastal country, has a diverse watershed (Lalèyê, 1996). The most important river owing to its flooded areas surface is the Ouémé River. Its basin is characterized by a variety of habitats including rapids, quiet and a wide floodplain. This ecological diversity gives the river an important ichthyological richness exploited by local populations who use various fishing techniques. This important river basin of Benin communicates with most of the tributaries among which belongs the Tovè River. This River is located in the lower valley of the Ouémé which is today considered as the second richest valley in the world after the Nil in Egypt. It was chosen as the area of current study considering its importance to the waterside population in terms of fishery and agricultural zones.
However, very little information is known on this aquatic ecosystem in general and its fish fauna in particular.
This study, the first one to be carried out on Tovè, River aims to describe the fish population of this river through the specific diversity and spatial distribution.
MATERIAL AND METHODS
Study Area
The Tovè River is located in the Southern Benin (04°42’47” N, 07°45’2” W). Benin country is located in West Africa at 6° 15’ and 12° 25’ North latitude and 0 ° 45’ and 04 °00’ East longitude. It is bounded at the North by Niger and Burkina Faso, at the East by Nigeria, at the West by Togo and the South by the Atlantic Ocean. Its surface area is estimated at 114 763 km2 (along 700 Km about 125 km wide and 325 km South to North).
With an approximately length of 1 km, with an average width of 3 m, the Tovè River is located in the Ouémé Division, specifically in the Adjohoun Sub Division at about 32 Km from Porto-Novo (Administrative Capital of Benin). The Sub-Division is limited at the South by the Dangbo Sub Division, at the North by the Bonou Sub-Division, at the East by the Sakété Sub-Division and at the West by the Abomey-Calavi and Zè Sub-Divisions. This river rises in the swamp of Tovè at Tovègbamè and flows into the Ouémé River, the largest river of Benin.
In order to exhaustively inventory the ichtyofauna of this ecosystem, and study its spatial distribution, the river was divided into three main areas A, B and C respectively upstream, middle stream and downstream (Figure 1).
Sampling and Study of the Fish Fauna
Fishes specimens were collected monthly from October 2015 to September 2016. Fishing was undertaken daily and night. During daily fishing sampling, we used artisanal and experimental fishery techniques such as gillnets (mesh size between 10 mm and 100 mm node to node); hoops designed in creels wire mesh; or with local materials, with or without bait, hook in troubled waters with simple and composed lines (longlines); dam nets, enclosure acadjas and bamboo traps. For the night fishing, gear are posed on 5 pm and withdrawn by 7am of the next day. The caught fish were safely preserved in a container and transported to the laboratory where they were identified up to species level and sorted by areas of investigations. Identification was made using morphometric and meristic characters provided by fish identification keys of Lévêque et al. (1990-1992), FAO (1992) and Paugy et al. (2003a, 2003b). Some characters at the species level were described after the dissection of some specimens under a stereo microscope “Olympus SZ40.” Fishes were sorted, measured and weight and the different species are recorded including their counting number. This information was used to assess fish assemblage by using biological parameters such as:
(1): Numerical percentage (N): the number of individuals of a species (ni) on the total number of individuals (Nt) in a taxonomic group (species, family or order) multiplied by one hundred:
N = (ni / Nt) × 100
(2) Frequency and percentage of occurrence (F): this frequency consists to count the number of times the species i appear in the catches at a given station (Dajoz, 2000). It quantifies the degree of ubiquity of different species and is expressed as percentage of the total number of fishes captured. The occurrence or frequency of catch was calculated in all the data collected for artisanal fisheries and experimental fishing with the following mathematical formula:
F = (Fi × 100) / Ft
Fi = number of samples containing species i and Ft = total number of samples.
(3) Similarity index of Jaccard (J’): this index enables a qualitative study based on the presence or absence of species in the different samples by comparing the different sectors in pairs (Jaccard, 1908). It is calculated using the following formula:
J ‘= ((number of species common to both sectors) / (total number of species in both sectors)) × 100
(4) Shannon-Wiener diversity index (H’) and evenness Index of Pielou (E): for a good presentation of information and for a better understanding of fish ichyofauna population of the Tovè River, we studied the spatial evolution of the diversity index of Shannon-Weiner (1948) (H’) and evenness Index of Pielou (E) (Niyonkuru, 2001) in tabular form. The Shannon diversity index showed us how individuals are more or less spread in a group of species. H’ is maximal when all species are also represented in the sample. But the Evenness E showed the regularity of the distribution of species in an ecosystem (Hill, 1973). While H’ expressed how species are organized in the community, E help us to appreciate the quality of the distribution of individuals within species in their environment (Pielou, 1966). These indices were calculated as follows:
H’ = - Σ [(Ni / N) × log2 (Ni / N)]
Ni: number of individuals of a given species i , i ranging from 1 to S (total number of species), N: total number of individuals; H’ is expressed in bits per individual and is generally range from 1 to 4.5 bits per individual or exceptionally higher in the case of large samples of complex communities.
E = H’/ log 2 S
H’ = Shannon index, S = total number of specific or species richness; 0 < E < 1. E tends to 0 when almost entire number is focused on a species and to 1 when all species have the same abundance.
Data Analysis
The software Statistical Analysis System version 9.1 (SAS v. 9.1) has been used for the statistical analysis. These analysis essentially consisted in analysis of variance. The Shapiro-Wilk test was applied to verify if the data set follow a normal distribution. The average values of the species richness, Shannon diversity index H’ and Evenness E of the 3 study areas were then compared between them with the help of the Kruskal-Wallis test in the doorstep of 5% (probability level). The test is significant for a value of the probability inferior to 0.05 (p < 0.05).
RESULTS
Fish Specific Diversity of Tovè River
Qualitative inventory of fish fauna and taxonomic numerical aspect
Table 1 and Figure 3 present the fish species encountered in Tovè River 8 during this studies. The fish specimens captured belonged to 19 families, 30 genera and 46 species. Cichlidae were the most represented family with 5 genera and 13 species. This family was followed successively by Mormyridae with 7 genera and 7 species, Characidae and Clariidae, represented each by 1 genus and 4 species. Channidae and Claroteidae represented by 1 genus and 2 species. All the others specimens are represented by only 1 species (Figure 2).
Quantitative inventory of fish fauna and percentage taxonomic aspect
The most abundant family collected during this survey was Mochokidae (43%) followed by Cichlidae (16%), Shilbeidae (10%), Clariidae (9%), Bagridae 18 (6%) and Anabantidae (4%); %). Thirteen other families represented 12% of the total number of fishes captured (Figure 4). Considering the species level, Synodontis schall was the dominant species representing 41% of the total fish sampled. It as followed by Shilbe intermedius, Tilapia dageti, representing respectively 11%, 8%, Chrysichthys auratus, Ctenopoma petherici and Clarias gariepinus representing 4% of the total number of collected individuals. The others species represented each less than 4% of the total number of caught fishes (Figure 5).
Spatial Distribution Along the Upstream-Downstream Gradient of the Tovè River
Variation of species richness among sampling areas
Figure 6 shows the variation in the fish individuals collected from October 2015 to September 2016 in the sampling areas. The analysis of this figure shows that the variation of the number of fish’s species depends on the sampling areas. In fact, the highest number of fish’s species was recorded at the upstream of the river, 39 species. At the middle of the river, it was collected a total of 35 species where as at the downstream, 31 fish specimens were captured (Figure 6).
Distribution and percentage of occurrence of ichtyofauna
• Distribution
The fish caught in the Tovè River have a wide distribution
Table 1: List of fish species collected in the Tovè River from October 2015 to September 2016
| Families | Species | |
| Cichlidae |
Sarotherodon melanotheron (Rüppell, 1852) |
|
|
Sarotherodon occidentalis (Daget, 1962)* |
||
|
Sarotherodon tourneiri (Daget, 1954)* |
||
|
Chromidotilapia guntheri (Sauvage, 1882) |
||
|
Hemichromis fasciatus (Peters, 1852) |
||
|
Oreochromis niloticus (Linnaeus, 1758) |
||
|
Tilapia zillii (Gervais, 1848) |
||
|
Tilapia dageti (Thys van den Audenaerde, 1971)* |
||
|
Tilapia louka (Thys van den Audenaerde, 1969)* |
||
|
Tilapia cessiana (Thys van den Audenaerde, 1968)* |
||
|
Tilapia joka (Thys van den Audenaerde, 1969)* |
||
|
Tilapia busumana (Günther, 1903)* |
||
|
Tilapia brevimanus (Boulanger, 1911)* |
||
| Hepsetidae |
Hepsetusodoe (Bloch, 1794) |
|
| Channidae |
Parachanna africana (Steindachner, 1879) |
|
|
Parachanna obscura (Günther, 1861) |
||
| Bagridae |
Chrysichthys auratus (Geoffrey St Hilaire, 1808) |
|
|
Chrysichthys nigrodigitatus (Lacepède,1803) |
||
| Clariidae |
Clarias agboyiensis (Sydenham, 1980) |
|
|
Clarias gariepinus (Burchell, 1822) |
||
|
Clarias macromystax (Günther, 1864)* |
||
|
Clarias anguillaris (Linnaeus, 1758)* |
||
| Anabantidae |
Ctenopoma petherici (Günther, 1864) |
|
|
Ctenopoma kingsleyae (Günther,1896) |
||
| Schilbeidae |
Schilbe intermedius (Rüppell, 1832) |
|
| Cyprinidae |
Labeo senegalensis (Valenciennes, 1842) |
|
| Characidae / Alestidae |
Brycinus Iongipinnis (Günther, 1864) |
|
|
Brycinus nurse (Rüppell, 1832) |
||
|
Brycinus macrolepidotus (Valenciennes, 1849) |
||
|
Hydrocynus brevis (Günther, 1864)* |
||
| Mormyridae |
Hyperopisus bebe (Lacépède, 1803) |
|
|
Mormyrops anguilloides (Linné, 1758) |
||
|
Petrocephalus levequei (Bigorne et Paugy, 1990)* |
||
|
Mormyrus rume (Valenciennes, 1846) |
||
|
Pollimyrus isidori (Valenciennes, 1846) |
||
|
Brienomyrus niger (Günther, 1866) |
||
|
Hippopotamyrus paugyi (Lévêque et Bigorne, 1985)* |
||
| Mochokidae |
Synodontis schall (Bloch et Schneider, 1801) |
|
| Malapteruridae |
Malapterurus electricus (Gmelin,1789) |
|
| Gobiidae |
Gobius guineensis (Peters,1876)* |
|
| Elopidae |
Elops lacerta (Valenciennes, 1846) |
|
| Ostoglossidae |
Heterotis niloticus (Cuvier, 1829) |
|
| Clupeidae |
Pellonula leonensis (Boulenger, 1916) |
|
| Protopteridae |
Protopterus annectens (Owen, 1839) |
|
| Polypteridae |
Erpetoichthys calabaricus (Smith,1866) |
|
| Notopteridae |
Xenomystus nigri (Günther, 1868) |
Note:*= species never reported in Ouémé River (Lalèyèet al., 2004)
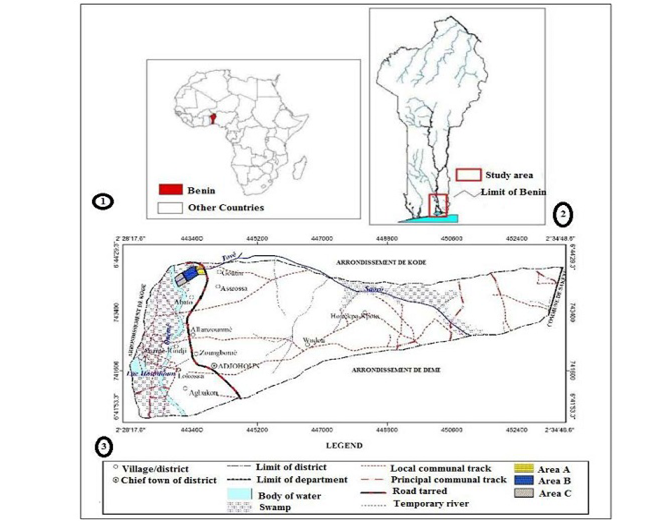
Figure 1: Study Area of Tovè River (3) located in Southern of Benin (2), Country situated in West Africa (1)
in the longitudinal gradient (Table 2 and Figure 7; 8 and 9). Species such as Sarotherodon melanotheron, Chromidotilapia guntheri Hemichromis fasciatus, Tilapia dageti, Hepsetus odoe, Parachanna obscura, Chrysichthys auratus, Clarias agboyiensis, Clarias gariepinus Clarias anguillaris, Ctenopoma petherici, Schilbe intermedius, Labeo senegalensis, Mormyrus rume, Hippopotamyrus paugyi, Xenomystus nigri and Synodontis schall were all present along the river since they were captured at the three sampling areas during this survey. The followed species were collected in two areas of the river:
Sarotherodon tourneiri, Tilapia zillii, Tilapia louka, Tilapia cessiana, Parachanna africana Chrysichthys nigrodigitatus, Brycinus longipinnis, Brycinus nurse, Hyperopisus baby, Mormyrops anguilloides, Petrocephalus levequei, Malapterurus electricus, Gobius guineensis, Elops lacerta, Erpetoichthys calabaricus, Protopterus annecteus and Pellonula leonensis. Lastly, others species such as Sarotherodon occidentalis, Oreochromis niloticus, Tilapia joka, Tilapia busumana, Tilapia brevimanus Clarias macromystax, Heterotis niloticus, Pollimyrus isidori, Briemomyrus niger, Brycinus brevis and Brycinus macrolepidotus were captured only in one of the three sampling areas.
Percentage of occurrence
The classification of species according to their percentage of occurrence (Table 3) revealed that8 species were very common species (frequency between 50% and 100%), 4 species were accessory (frequency between 25 and 50 %), and 34 species were accidental (frequency < 25 %).
Evolution of species richness
• Shannon diversity index H’ and Evenness E
The highest Shannon index (H’= 2.522) was obtained at
the downstream of the river whereas the lowest value of the index (H’ = 2.266) was obtained in at the upstream of the river (Table 4). The same report was noted for the evenness (E = 0.413 and E = 0.241 for the downstream and the upstream respectively) (Table 4). Nevertheless, no significant difference was noticed among the sampling areas (P> 0.05) for species richness, Shannon diversity and Piélouevenness (Table 4)
Table 2: Distribution of the fish species in the different sampling areas of the Tovè River
| Species | Upstream | Middle stream | Downstream |
| Sarotherodon melanotheron | X | X | X |
| Sarotherodon occidentalis | X | ||
|
Sarotherodon tourneiri |
X | X | X |
| Chromidotilapia guntheri | X | X | X |
| Hemichromis fasciatus | X | X | X |
| Oreochromis niloticus | X | ||
| Tilapia zillii | X |
X |
|
| Tilapia dageti | X | X | X |
| Tilapia louka | X | X | |
| Tilapia cessiana | X | X | |
| Tilapia joka | X | X |
X |
|
Tilapia busumana Tilapia brevimanus |
X X |
||
| Hepsetus odoe | X | X | X |
| Parachanna africana | X | X | X |
|
Parachanna obscura Brycinus brevis |
X X |
X | X |
| Chrysichthys auratus | X | X | X |
| Chrysichthys nigrodigitatus | X | X | X |
| Clarias agboyiensis | X | X | X |
| Clarias gariepinus | X | X | X |
|
Clarias macromystax Clarias anguillaris Pollimyrus isidori Brienomyrus niger Ctenopoma kingsleyae |
X X X X |
X X |
X
X |
| Ctenopoma petherici | X | X | X |
| Schilbe intermedius | X | X | X |
| Labeo senegalensis | X | X |
X |
| Brycinus Iongipinnis | X | X | |
| Brycinus nurse | X | X | |
| Brycinus macrolepidotus | X | ||
| Hyperopisusbebe | X | X | |
|
Mormyrops anguilloides Mormyrus rume Hippopotamyrus paugyi |
X X X |
X X X |
X X |
| Petrocephaluslevequei | X | X | |
| Synodontis schall | X | X | X |
| Malapterurus electricus | X | X | |
| Gobius guineensis | X | X | X |
| Elops lacerta | X | X | X |
|
Pellonula leonensis Heterotis niloticus Xenomystus nigri Erpetoichthys calabaricus Protopterus annectens |
X
X X X |
X X
|
X
X X X |
Note: X= presence
Table 3: Classification of the species of fish captured according to their frequency (%)
| Very Common Species [50-100 %] | AccessorY Species [25-50 %[ | Accidental Species < 25 % |
| Chrysichthys auratus | Chromidotilapia guntheri | Brienomyerus niger |
| Clarias agboyensis | Chrysichthys nigrodigitatus | Brycinus longipinnis |
| Clarias gariepinus | Clarias anguillaris | Brycinus macrolepidotus |
| Hepsetus odoe | Hemichromis fasciatus | Brycinus nurse |
| Ctenopoma petherici | Heterotis niloticus | |
| Synodontis schall | Hydrocynus brevis | |
| Shilbe intermedius | Hyperopisus bebe | |
| Tilapia dageti | Hyppopotamyrus paugyi | |
| Labeo senegalensis | ||
| Malapterurus electricus | ||
| Mormyrops anguilloides | ||
| Mormyrus rune | ||
| Oreochromis niloticus | ||
| Parachanna africana | ||
| Parachanna obscura | ||
| Pellonula leonensis | ||
| Petrocephalus levequei | ||
| Pollimyrus isidori | ||
| Protopterus annectens | ||
| Sarotherodon melanotheron | ||
| Sarotherodon occidentalis | ||
| Sarotherodon tournieri | ||
| Clarias macromystax | ||
| Elops lacerta | ||
| Erpetoichthys calabaricus | ||
| Gobius guineensis | ||
| Tilapia zillii | ||
| Tilapia louka | ||
| Tilapia cessiana | ||
| Tilapia joka | ||
| Tilapia busumana | ||
| Tilapia brevimanus | ||
| Ctenopoma kingsleyae | ||
| Xenomystus nigri |
Table 4: Shannon diversity index H’ and PielouEvenness E of the fish species based on the numeric values of captured species in the Tovè river
| Parameters | Upstream | Middle | Downtream | Significativity |
|
Species richness |
39 | 35 | 31 |
0.368 NS |
| Diversity (H') | 2.266 | 2.513 | 2.522 |
0.368NS |
| Evenness (E) | 0.241 | 0.325 | 0.413 |
0.368 NS |
Note: NS= No significant p> 0.05
Table 5: Index of similarity between sampling areas
| Areas | Upstream | Middle | Downtream |
| Upstream | 1 | ||
| Middle | 58.15 | 1 | |
| Downtream | 57.19 | 67.28 | 1 |
• Index of similarity between sampling areas
Jaccard index, calculated between the different sampling areas for the eight months, remains fairly high. This index
varied between 57.17% and 67.28% with an average of 2 60.87% (Table 5). The highest similarities were observed between the Upstream and the middle stream on the one hand and between the Middle and Downstream of the river on the other hand. The lowest similarity was observed between Upstream and Downstream of the river.
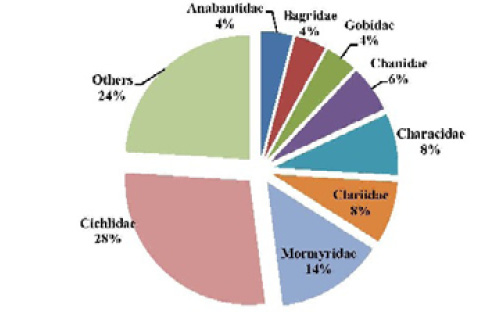
Figure 2: Relative importance in number of species, of the main fish families sampled in the Tovè River from October 2015 to September 2016
DISCUSSION
Inventory of Tovè River fish fauna showed 46 species 8 of fish in 30 genus and 19 families. These results pointed out the diversity of this fauna at the different sectors of the river during the sampling period. They seem to confirm the statement of Hugueny and Lévêque (1999) who showed that the numbers of fish species may vary according to the habitat in the same river. The high fish specific diversity recorded for Tovè River, 13 could also be explained by its permanent communication with Ouémé River, where Lalèyè et al. (2004) reported 122 species belonging to 87 genus and 50 families. Indeed, most of the species from this Ouémé River may can migrate into the Tovè River via its downstream sector. On the other hand, the current study has enabled to identify 14 species never reported in Ouémé River (Lalèyè et al., 2004).
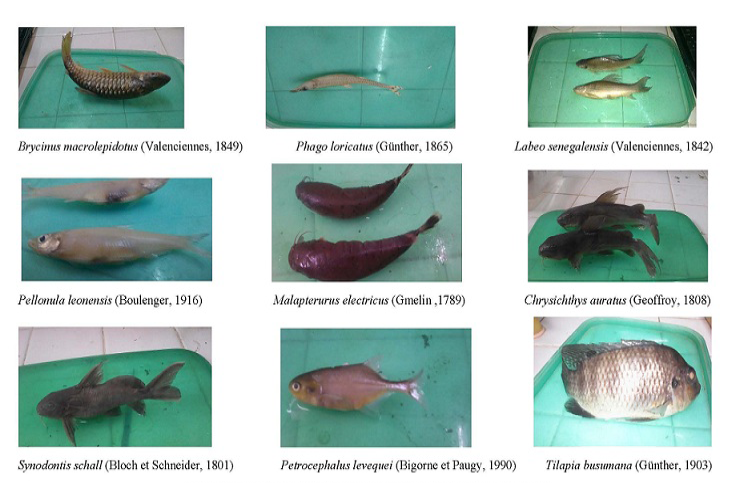
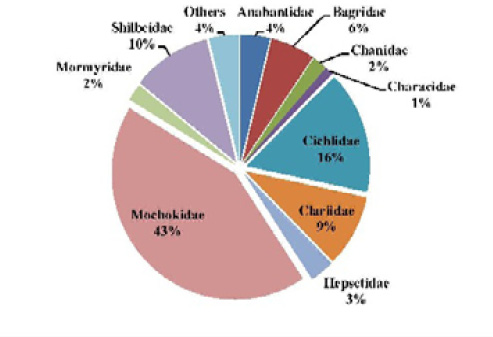
Figure 4: Percentage composition of fish family sampled in the Tovè River from October 2015 to September 2016
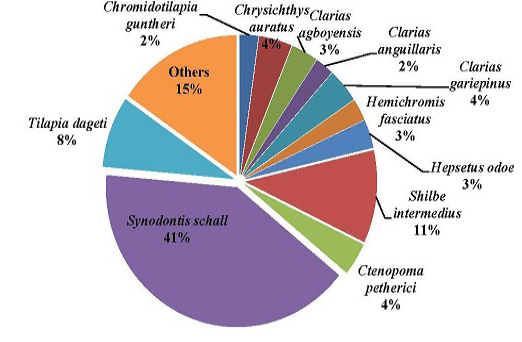
Figure 5: Percentage composition of fish species sampled in the Tovè River from October 2015 to September 2016
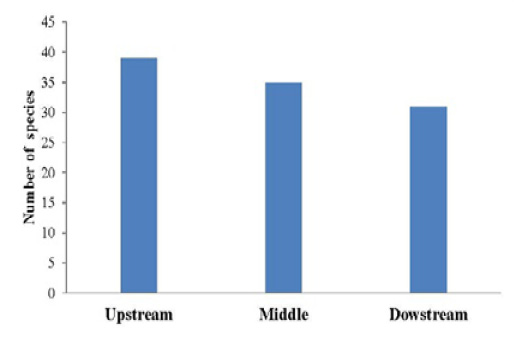
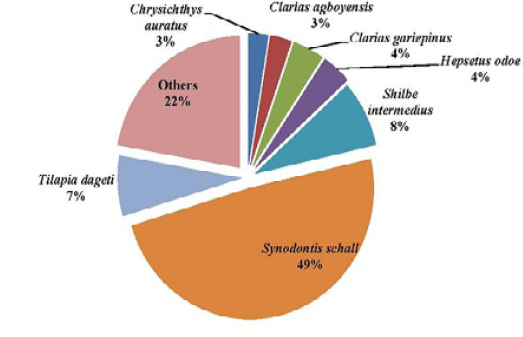
Figure 7: Percentage composition of fish species sampled in the upstream of the Tovè River from October 2015 to September 2016
These species are: Clarias macromystax, C. anguillaris, Tilapia dageti, T. cessiana, T. busumana, T. louka, T. joka, T. brevimanus, Sarotherodon occidentalis, S. tourneiri, Petrocephalus levequei, Hippotamyrus paugyi, Hydroycinus brevis and Gobius guineensis. These species could be considered less accessible and vulnerable species comparative to the very common species present in the two rivers. The presence of some species in Tovè River could also be justified by the statement of Lalèyê et al. (2004),who mentioned that some of the species absent in the largest streams of the country such as the Ouémé River, could be present in some of the smallest rivers or in some non-prospected particular habitats such as the Tovè of Tovè River.
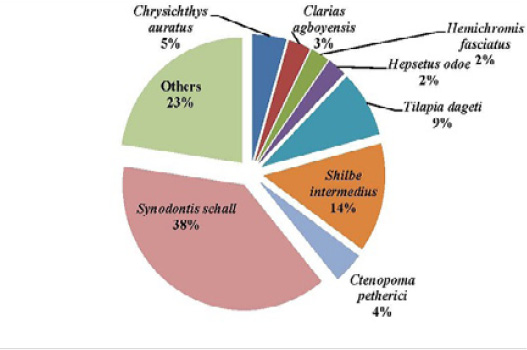
Figure 8: Percentage composition of fish species sampled in the Middle stream of the Tovè River from October 2015 to September 2016
The ichthyofauna of the Tovè River is dominated by species belonging to the Cichlidae, Mormyridae, Characidae and Clariidae families. This taxonomic composition reflects the one of the Ouéme River (Lalèyê et al., 2004). The representativeness of Mormyridae which species constitute indicators of the ecological quality of water (Hugueny et al., 1996) is also a good tool for the assessment of biotic integrity of the river.

Figure 9: Percentage composition of fish species sampled in the Down stream of the Tovè River from October 2015 to October 2016
About the spatial distribution, the studied ichthyofauna presents an distribution who is not significantly different between the 3 study areas (p > 0.05). This richness that begins with 39 species upstream decreases in the middle stream (N = 35) and in the downstream sector (N =31). Thus, we noted that in the Tovè River, species richness is higher where the rivers takes its source and decrease in the middle stream and in the downstream. The upstream is located in the flooding zone where the ecological features would be favourable for an important colonization by fish. The downstream area which communicate with Ouémé River could be considered as the transition zone of the common species to both environments. It is necessary to notice also that few human activities are observed in the upstream areas contrary to the middle sector which is exploited by the population for their daily activities (fishing, laundry, toilet, fluvial landing, bottom sand dredging). These results was in agreement with those of Kouamélan et al. (2003) and Yao et al. (2005) for their studies on the Boubo River and the Comoé River respectively and attributed the irregular distribution of species richness to human activities. The tendency a complex interplay among temperature, water conditions, habitat diversity and accessibility, according to the “River Continuum Concept“ (RCC) could be explained based on a complex interplay between temperature, water conditions, habitat diversity and accessibility, abundance and type of potential food (Vannote et al., 1980).
The study of the organization of fish species population in the various areas of the Tovè River using the Shannon diversity index (H’) and Evenness (E) relative high values above the average. This point out a good organization of the population. The character relatively steady of the diversity as observed in this study could have been influenced by the sampling methods that is appropriate to the structure of the river fish stock.
CONCLUSIONS
This study enables to establish the data about Tovè River fish fauna and indirectly to update Benin fish fauna. It also reveals that Tovè River includes a great fish diversity in spite of its small size with an important quantitative and qualitative variability of the captures during the hydrological seasons.
ACKNOWLEDGEMENTS
The authors thank the European Union through the Intra-ACP program AFIMEGQ “Africa for Innovation, Mobility, Exchange, Globalization and Quality”, thanks to which we have done some of the work at the Laboratory of Zoology, Department of Science at the Higher Teacher Training School of the University of Yaounde I in Cameroon. Also, we grateful all personal of Laboratory of Research on Wetlands, Department of Zoology, University of Abomey-Calavi in Benin.
Conflict of Interest
The authors declare that they have no competing interest.
Authors’ Contribution
All authors contributed equally in research and writing of manuscript.
REFERENCES