
Wheat Yield, Physiology and Phenology Response to AM Fungi Application and Phosphorus Management


Wheat Yield, Physiology and Phenology Response to AM Fungi Application and Phosphorus Management
Mehran Ali* and Inamullah
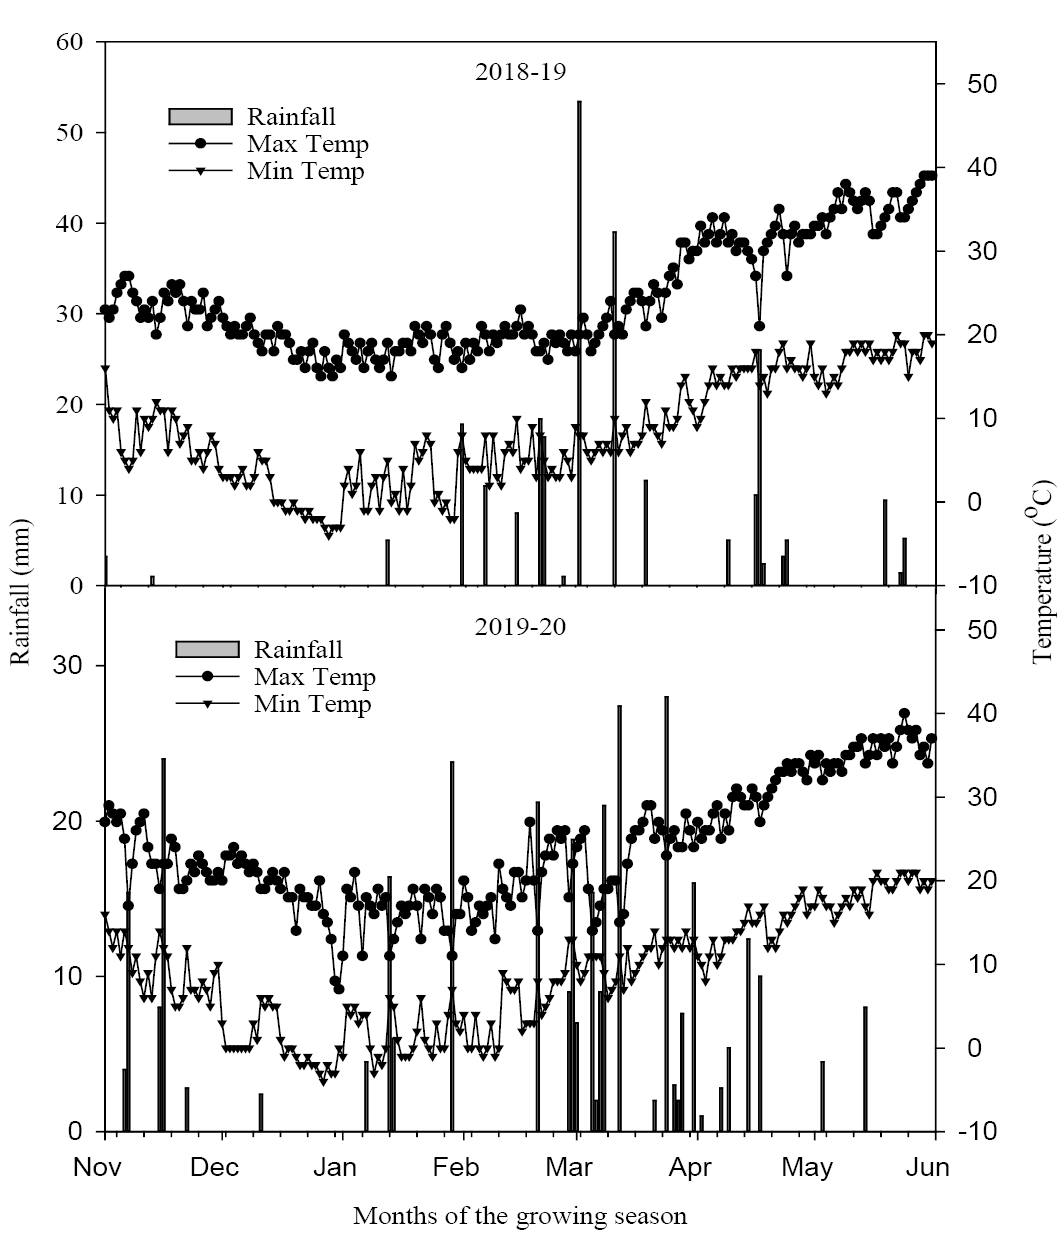
Figure 1:
Maximum and minimum temperatures (oC), and total monthly rainfall (mm) during wheat growing season 2018-19 and 2019-20.
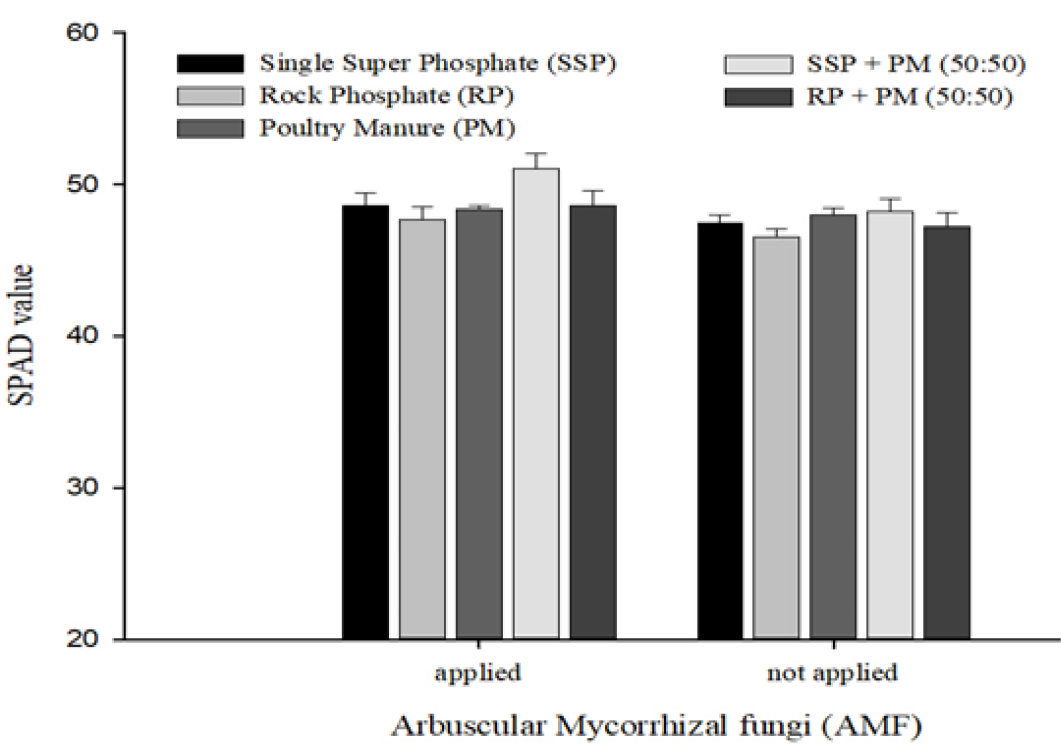
Figure 2:
Interaction between AMF and P sources for SPAD value of wheat.

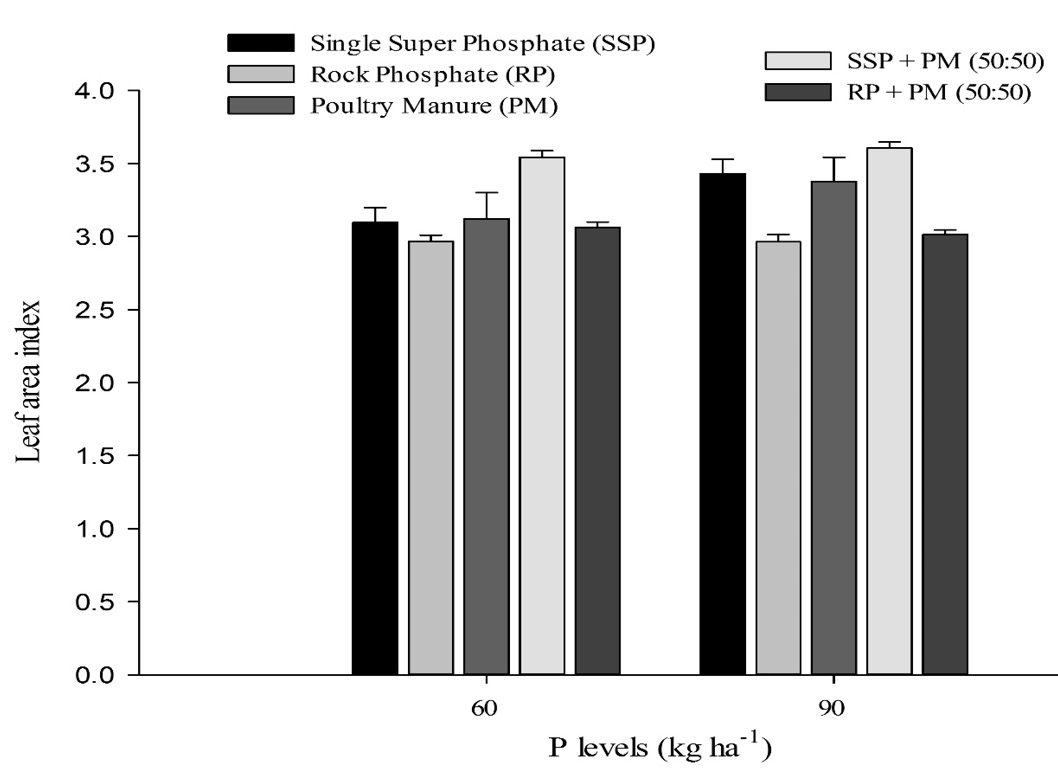
Figure 3:
Interaction between P levels and P sources for leaf area index of wheat.
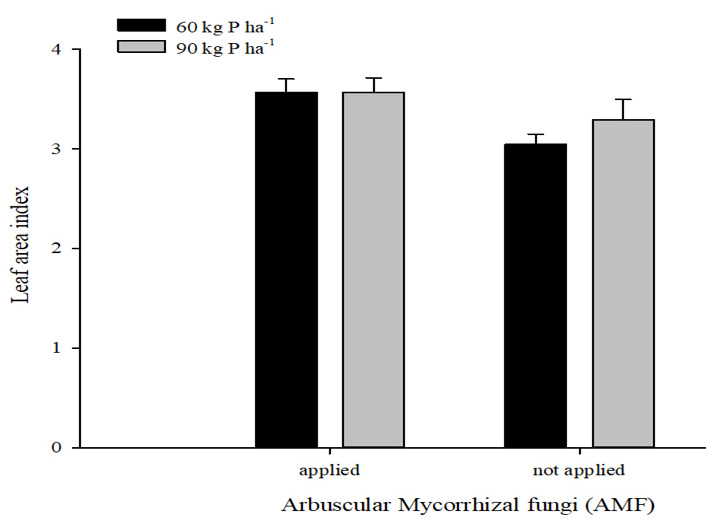
Figure 4:
Interaction between AMF and P levels for leaf area index of wheat.
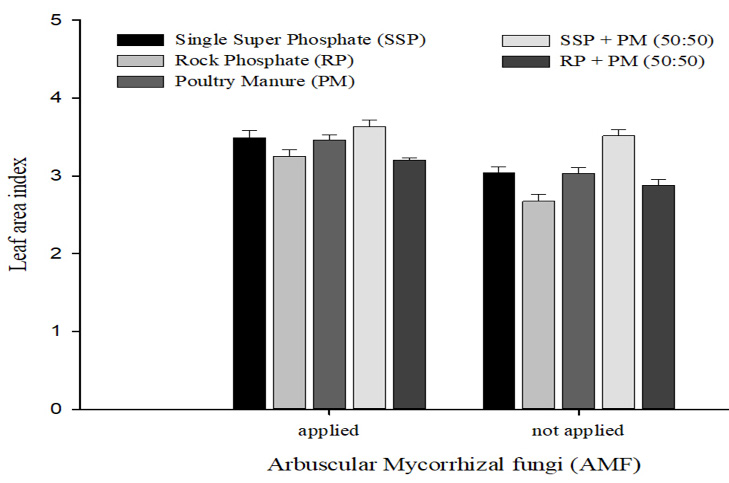
Figure 5:
Interaction between AMF and P sources for leaf area index of wheat.

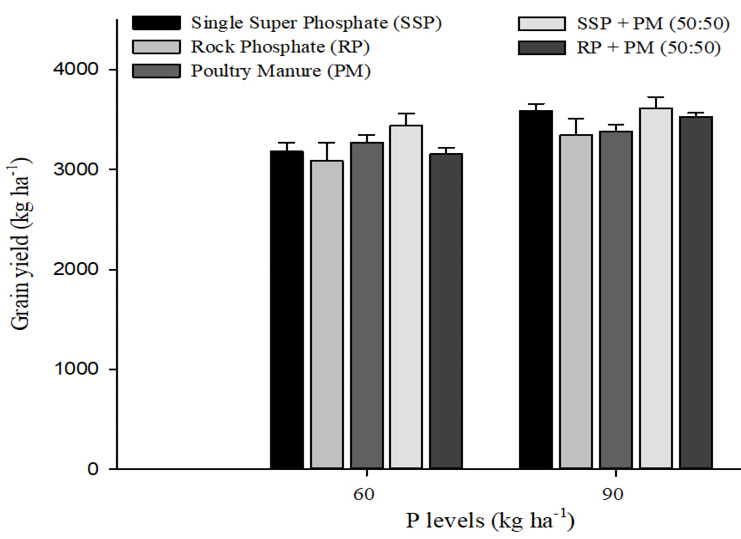
Figure 6:
Interaction between P levels and P sources for grain yield (kg ha-1) of wheat.
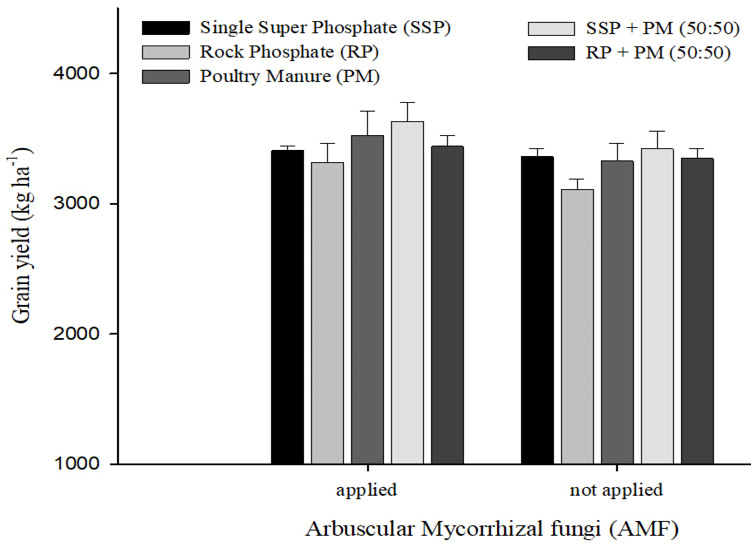
Figure 7:
Interaction between AMF and P sources for grain yield (kg ha-1) of wheat.

Equation 1

September 2023
Vol.39, Iss. 3, Pages 573-780

