
Visitors’ Willingness to Pay for Conservation of the Biodiversity and Tourism in Kalam Valley of Khyber Pakhtunkhwa, Pakistan


Review Article
Visitors’ Willingness to Pay for Conservation of the Biodiversity and Tourism in Kalam Valley of Khyber Pakhtunkhwa, Pakistan
Sanaullah1, Fazli Rabbi2*, Shahid Ali2, Zeeshan Khan3 and Muhammad Zamin4
1Pakistan Institute of Development Economics (PIDE) Islamabad, Pakistan; 2Department of Economics and Development Studies, University of Swat, Khyber Pakhtunkhwa, Pakistan; 3School of Economics and Management (SEM), Tsinghua University, Beijing, China; 4Department of Agriculture, University of Swabi, Khyber Pakhtunkhwa, Pakistan.
Abstract | This paper is based on a Contingent Valuation (CV) survey conducted in Kalam valley, which is a famous tourist and biodiversity hot spot. The valley has remained underdeveloped in terms of infrastructure, tourists’ information facilities, telecommunication, affordable public transport system, and comfortable accommodation for the tourists. In the past few years, the development of this tourists’ spot has been neglected in the public development budget. Moreover, due to the war against militancy in Swat, the frequency of tourists was declined in the valley. As a consequence, the livelihoods of the local population were adversely affected. As public financial resources for the development of the area have been meagre in the past, therefore, this study is aimed to estimate tourists’ Willingness to Pay (WTP) for development and biodiversity conservation. A well-structured interview schedule was used and face to face interviews were conducted with a total of 264 tourists. Travel Cost Method (TCM) and poisson regression techniques were used for data analysis. The results reveal that 98 percent of the sampled tourists were willing to pay for the development and conservation in the area. Moreover, 37 percent of the sampled tourists were willing to pay Rs.100 (0.94 US$) per visit as an entry fee. The analysis further showed that an estimated amount of 421 million Rupees (3.97 million US$) could be generated as consumer surplus. The poisson regression estimates show that visitors’ frequency to the site is significantly affected by traveling cost, gender, and visitors’ perception of the quality of the site. The policy should legislate to introduce payment system for visiting the tourist site to generate funds for its development. Moreover, development programs shall be initiated to attract tourists vis-à-vis realize the objectives of the sustainable management and conservation of biodiversity.
Received | September 18, 2019; Accepted | November 20, 2019; Published | January 12, 2020
*Correspondence | Fazli Rabbi, Department of Economics and Development Studies, University of Swat, Khyber Pakhtunkhwa, Pakistan; Email: rabbi.fazli@gmail.com
Citation | Sanaullah, F. Rabbi, S. Ali, Z. Khan and M. Zamin. 2020. Visitors’ willingness to pay for conservation of the biodiversity and tourism in Kalam valley of Khyber Pakhtunkhwa, Pakistan. Sarhad Journal of Agriculture, 36(1): 81-94.
DOI | http://dx.doi.org/10.17582/journal.sja/2020/36.1.81.94
Keywords | Willingness to pay, Continent valuation, Tourism, Biodiversity, Kalam valley
Introduction
Around the world, people visit recreational sites for social exchanges, economic and cultural processes (Rafiq et al., 2007). The recreation and tourists’ attraction locations in the mountains regions are rich in natural forests and biodiversity.
The natural and scenic beauty, rich biodiversity and pleasant weather of the natural sites attract tourists. Such places have market and non-market values. In most cases the non-market values are often ignored. In many developing countries, little attention has been given to the non-market values of many natural places. The access of visitors to such sites is mostly free or at a nominal entry fee. In Pakistan too, there are many scenic sites for tourist’s attraction. The Kalam valley in North East Pakistan is one of these famous tourist attractions with peculiar natural beauty and rich biodiversity. Nonetheless, due to negligence in the public development programs and the war against the militants in the area have adversely affected the frequency of the tourist to the site. This in turn has implications for the local economy, tourist’s business as well as the livelihoods of the local residents. The visits to recreational sites have significant contribution to economic growth and conservation of the natural resources. Natural resources are useful to society survival and yield direct and indirect benefits (Khan, 2004, 2006). They have not only ecological functions, but they also have important recreational services for the tourists. The preservation and maintenance of tourist sites and protected area is important. Nonetheless, such preservation, management and development need financial resources. There are two ways of finances viz; public funding and private finances. The fact is that in many developing countries, meagre amount is allocated for the conservation of natural habitats, parks, natural forests, tourists’ sites and protected areas. Researchers argue that ecotourism could be mean to sustain and self-finance protected areas (McNeely, 1994; cited in Togridou et al., 2006). In case of private finances, entry fee is suggested as a mean of funding. In order to rationally propose entry fee for parks and other tourist sites, it is suggested that visitors’ Willingness to Pay (WTP) be investigated and the motivation of visitors to justify their willingness to pay (White and Lovett, 1999) A number of studies have been conducted in Pakistan and other countries to estimate the benefits of the recreational sites. Many people visit the recreational sites for utility maximization. Therefore, empirical studies to examine the willingness to pay are crucial for policy. There has been large volume of published literature on valuing the environmental resources and willingness to pay. A study by Beal (1995) using travel cost analysis to estimate the value of carnarvon gorge national park the overall benefit was estimated $ 2.4 million per year.
Studies on the visitor willingness to pay are numerous on national level (Khan, 2004; Ahmed and Hussain, 2016) and international seeking to examine the willingness to pay for site visit using Travel Cost method (TCM) and Contingent Valuation Methods (Alvarez-Farizo et al., 2001; Beal, 1995; Cesario, 1976; Dixon et al., 2001).
Khan (2004) in a study used Travel Cost Method (TCM) for Margalla Hills National Park (MHNP) to examine the recreational value. The aggregate benefits of the park were calculated Rs. 23 million per year base of Rs. 20 entry fees. Rafiq et al. (2007) used Zonal Travel Cost (ZTC) method to assess the recreational value of Chitral valley. The study found the total consumer surplus (CS) to be Rs. 5,225,190/-for the year 2007.
Despite the fact, that Kalam valley in the North of Pakistan’s Khyber Pakhtunkhwa Province is a famous and most attractive location for tourism but pooling of financial resources for its development have been negligible in the recent past. According to the Khyber Pakhtunkhwa (KPK) annual budget report (2014-15) tourism along with sports, archaeology and youth affairs gets only Rs. 1350 million which is approximately 0.965 percent of the total budget allocated for the purpose of the maintenance and development of the recreational sites in the province. It is fact that even that amount is not properly utilized in its proposed allocated segment. The war on terror in the valley of Swat and the devastating floods which hit the area in 2010 badly damaged the tourism in Kalam valley.
Development and enhancing the recreational facilities would need huge finances. Research has shown, that visitor entry fee may be an important source to finance the development of tourism spots. As public funding in most cases is limited, visitors’ Willingness to Pay (WTP) for the site development would be an important source of funding. Valuation of such resources may help to improve the resource status. As such maximum benefit could be obtained from any environmental good.
Taking into account the existing gap in the literature on valuation of the tourist sites such as Kalam in the Swat valley as well as the threat of future degradation and its impact on the tourism vis-à-vis on the natural resources, this study is aimed to estimate Willingness to pay (WTP) by using the individual Travel Cost Method following Khan (2006) and Ahmad and Hussain (2016). The specific objectives of the study are (a) to estimate the recreational value (benefits) of the site; (b) to analyze the responsible factors that affects the visitors’ willingness to pay (WTP) and suggest entry fee based on tourist willingness and (c) to investigate the desirable changes for increase in recreational benefits of the site.
The study site: Kalam valley
Swat is known as the “Switzerland” of the East due to its natural beauty, lush green agriculture farms, natural coniferous forests, snow-peaked mountains and the “Swat River” flowing in the center of Swat valley. Kalam is a mountainous touristic spot in Swat valley (Figure 1). Kalam is among the famous locations for tourism in Pakistan. The valley is located in the northern areas of Pakistan at an elevation of 2,074 meters, (6,800 feet. It is located at a distance of 350 Kilometers from Islamabad- the capital of Pakistan. It is surrounded by Behrain and Mankyal valleys on the South, Utror and Gabral valleys on the west, Chitral and Ghizar districts on the North and Indus Kohistan on the East. In addition to its dense conifer forests, there beautiful lakes, waterfalls and green pastures. It is also the intersection where the famous Ushu and Utror rivers joins and from there downwards it is known as Swat River.
In Kalam and surrounding areas, the maximum annual temperature is most of the time not above 20 degrees Celsius. In winter, heavy snow fall occurs leading to blockage of main road. This in turn leads to the shortage of food and other necessities in winter. Therefore, the local people on the advent of winter, purchases bulk quantities of essential items for the winter season. In winter months, the temperature drops to -6 to -10 degrees Celsius. Due to severe cold and lack of required heating facilities and shortage of fodder for the animals, majority of the local people migrate to down districts located to the South of Kalam valley.
Several languages are spoken in the area, but the most dominant is called Kohistani. The main village in the area is Kalam and hence the area is known as Kalam Kohistan. Traditionally Swat has been divided into two distinct tracts, namely Swat Khohistan and Swat Proper. Swat Khohistan is the mountain area on the upper reaches of the Swat River and its tributaries (Rome, 2005).
About 30,000 people visit Kalam every year and the number is expected to increase. However. the tourism industry has been badly affected in the area resulting in huge economic losses (Rabbi et al., 2014). There are wonderful lakes, marvelous water fall, lush green hills, and snowcapped peaks. The most dominant tree species found in the area are fir (Abies), pine (Pinus willichiana) and deodar (Cedrus deodara). The area is also host to rare species of plants and is rich in biodiversity. There are dense forests, however due to deforestation the forest area has been declined over the years. The climatic conditions of the valley are favorable for the growth of the tall coniferous trees (Nawab et al., 2017). Kalam widen in to six-kilometer upland, where river Ushu and Utror River converge and become the river of Swat. A small population of Pakhtun inhibit the area. As per 1981census, the total population of Kalam was 26000 which is growing 4 percent per year (District Census Report). The fertile land of Swat proved attractive for Buddhism and emerged as its great center Swat never came under foreign rule or imperial power at least after the occupation by the Yousufzais (Rome, 2005).
In addition to the crops and fruit and vegetables, Kalam is also home to common medicinal plants (Table 1). The forests in Kalam like other parts of the Swat valley are under the threat of degradation. Illegal tree cutting and timber smuggling are widespread leading to pressure on the natural forests in many forests areas in Swat (Rabbi, 2009). The forests in Kalam are also host to rare species of fauna and flora. There are important plant species which have tremendous medicinal values (Table 1).
Du to extreme winter in the area, about 80 percent of the total population migrate outside the valley in winter.
Table 1: Common Medicinal plants in Kalam.
| S. No. | Local Name | Botanical name | Market price/kg(Pakistani rupees) * |
| 1 | Mater Jharai |
Trillilum govanianum Wall.ex Royle |
3,800 (US$ 35.84906) |
| 2 | Gojhai |
Morchella esculenta (L.) Pers. |
20,000(US$188.6792) |
| 3 | Anjhabar |
Bistorta amplexicaulis (D.Don) Green |
2,000(US$18.86792) |
| 4 | Ghoz |
Juglans regia L. |
160(US$1.509434) |
| 5 | Kakora |
Sinopodophyllum hexandrum (Royle)T.S.Ying |
280(US$ 2.64) |
| 6 | Zahar Mora |
Aconitum heterophyllum Wall. Ex Royle |
80(US$.75) |
| 7 | Sar bawary |
Aconitum violaceum Jacquem ex.stapf |
6,500(US$ 61.32) |
| 8 | Nazer Panra |
Skimia laurola (DC) Sieb. and Zucc ex Walp. |
70(US$.66) |
| 9 | Kwary |
Berberis lyceum Royle |
120(US$1.132) |
| 10 | Valenay |
Mentha longifolia (L.) L. |
200(US$ 1.88) |
| 11 | Tour amlok |
Diospyros lotus L. |
100(US$.94) |
Source: Field Survey information of the local people * 1 US$= 156 Pakistani Rupees.
Table 2: Definitions of explanatory variables.
| S. No | Variable | Explanation |
| 1 | Age |
Age of the visitors and the number of visits to recreational site are inversely related (Khan, 2004; Wynen, 2013; Tullu and Ketema, 2014; Ahmad, 2015). |
| 2 |
Gender of respondents |
It is another determinant of the visitation of recreational sites. It is hypothesized that men visit recreational sites more often than females (Khan, 2004; Wynen, 2013; Ahmad and Hussain, 2016). |
| 3 | Education | Higher the education level the more will be the visitation rate to recreational sites (Khan, 2004; Wynen, 2013; Ahmad and Hussain, 2016). |
| 4 | Household income |
Household average monthly income local currency (PKR). It has been observed that income have positively related to participation in outdoor recreational activities. |
| 5 |
Location/Residence |
Respondent's local or non-local, local visitors will visit the recreational site more often than those from non-local areas (Khan, 2004; Wieland and Horowitz, 2007). |
| 6 | Quality of the recreational site | better quality of the recreational site attracts the visitor towards it. |
| 7 | Travel Cost |
Travel cost may also effect the visitation of the recreational site now the question is what cost should be included in the existence literature the researcher investigated that the depression cost of the vehicle plus the oil cost (Seller et al., 1985). Therefor accommodation, food and vehicle cost is the most appropriate cost regarding the value of on-site time. Hence, opportunity cost, the time spent on-site should be include in the travel cost (McConnell, 1992). |
| 8 |
Marital status
|
It’s expected that unmarried people visit more recreational site like Kalam than those who are married and divorced Wynen (2013). |
The purpose of out migration for 75 percent of the people is seeking work, while for 20 percent it is due to shortage of fodder in the winter for their livestock (Socioeconomic Survey conducted by the DRG). The migration begins in November each year and stretch up to March in the next year. Most of the migrants moves with the entire family.
Literature review
There is a vast body of literature available on non-market valuation of environmental goods. Numerous methods exist for valuation of the environmental goods. Nonetheless, Contingent Valuation Methods (CVM) and Travel Cost Methods (TCM) are the most recently used methods.
One of the favored method for estimating the recreational demand of a site is the so-called Hoteling-Clawson-Knetsch (HCK) approach that is Travel Cost Method (CVM), which estimates the demand curve. In the Travel Cost Method (CVM), the time cost of the trip has to be incorporated, otherwise the demand will be downward biased from its true position and the benefits will be estimated conservatively. In Travel Cost Method, the cost per day or cost per minute is estimated and the time value is given one third of the average wage rate (Cesario, 1976). In the literature, the importance of the recreational benefits as well as the use and non- use values are evident. Research has revealed that resources are threatened by soil erosion, forest fires, human settlement, and pollution (Himayatullah, 2003). The time value is important because it have unbiased estimates (Beal, 1995). It has also been shown that Tavel Cost Methods (CVM) and travel time has negative relationship with visitation (Chotikapanich and Griffiths, 1998). The Contingent Valuation Method and Travel Cost Methods are together used to determine the value of a recreational resort. Studies such as Yaping (1999) have assessed the value of recreational sites and findings have revealed that entry fee could be the mean of the payment for improving quality of the site. Nonetheless, other have argued that entry fee is necessary but not a sufficient condition for improvement and sustaining the natural resources (Dixon et al., 2001).
There has been an increasing evidence of valuing the natural resources and different methods and techniques have been developed and used to estimate the value of the natural environment. Among others, Travel Cost Method (TCM) is one of the vital techniques that help in estimating the values of natural environment. However, TCM does not take into account the non-use value of the parks. TCMs are credible for estimation of the recreational benefits, for giving weight to the consumer surplus and to help governments in keeping an appropriate policy for the natural environment. As these parks have something unique in qualities (that are natural resources) and these parks are of convenient location so they are visited. The number of visits will be high if the site has some uniqueness. An increase in travel cost of the regional zones, the park will have fewer visitors (Lansdell and Gangadharan, 2003).
The economic valuation of the tourists’ spots has been investigated by several researchers around the world. Rafiq et al. ( 2007) estimated the value of the recreational benefits on the basis of tourists’ preferences and found that the valuation of the recreational benefits can help in formulating an appropriate policy for management of the natural resources.
Similarly, the attraction of historical places and buildings capture the attention of local and foreigner tourists, which contribute in tourism industry, valuation of such places is very important for the economy (Khan, 2004).
Some studies have also used individual Travel Cost Method (TCM) for estimation of recreational benefits. For example, study by Ahmad and Hussain (2016) estimated the recreational benefits. The study revealed that travel cost, households’ income, age, gender, number of family members and level of education are the major determinants of the visitation to a recreational site. It was further found that revenues can be generated through levying of entry fee based on the willingness to pay of individual or groups of people.
In another study Herlina (2015) found that the willingness to pay depends on the economic status and social characteristics like age, literacy level, traveling cost, distance and income of the tourist. It also depends on attitude of tourists towards tourism. Access to information about specific site will help the visitor about services and facilities available at that particular place.
Economic factors do not influence the preference of a place, but rather its use is influenced by non-economic factors such as social factors, and cultural factors etc. There are factors such as number of people visiting the site and their behavior. The valuation of the natural sites can be carried out via combination of travel cost method and a contingent valuation (Ezebilo, 2016).
The Travel Cost Method (TCM) is used for non-economic valuation of those resources which doesn’t have any market to sold or bought. In a study Mishra (2014) estimated the economic value using of a lake using the Travel Cost Method (TCM) and Contingent Valuation Method (CVM). Monetary cost of traveling time cost, number of visits and most important indicator that will define the use value of any recreational site is the environmental quality of that site. To estimate the environmental quality of any recreational site travel cost method, by asking the perception of visitors about the quality of environment at that site and what changes need to be made that will increase the number of visitors to that site along with increase in number of visits (Pienaar, 2017).
In most of developed and some developing countries valuing the recreational sites is not only contributing in government revenue but also quite helpful in the maintenance and development of these sites. It maybe because in developing countries valuing recreational site is new therefore a very small literature is available (Ahmed and Hussain, 2016). The existing literature show that travel cost methods are viable techniques for estimating the value of the recreational sites. Travel cost method have also been shown to provide more reliable than contingent evaluation method (Mayor et al., 2007). Similar methods have been used by other for estimating the recreational values using the Individual travel cost method (Himayatullah, 2003; Ahmad and Hussain, 2016).
Theoretical framework
Environmental goods provide both the direct and indirect benefits to the consumers. The existing literature focuses on valuing recreational benefits. In travel cost model’s consumer is assumed to choose his/her visits to a recreational site, just as he consumes other goods. According to Nilleson (2002).

Where;
U = utility; x= market goods; v = visits to the site.
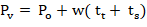
The budget constraint is given as:

Where;
w= wage rate; L= labor hours/ working hours; Po= it’s the cash cost associated with the visits, which can be accommodation, fuel and food cost.
Further, is to consider the additional cost that is time spent in travelling to and from the site and also time spent at the site. Consider that an individual has T hours of time to spend, either to work or visit a site. So the time constraint to be faced by the individual would be as follow:

T= total hours of time; tt =time to and from the site to residence. ts= time spent at the site.
For maximization of utility, MaxxvU (x, v)
Substitute Equation 1 in 2.

Here TC is representing as price of the visit where:
The utility maximization problem is a standard process, except the price of visit is newly introduced here, which is considered not only in money spent but also in time consumed.
Solving for maximization, the demand function for visiting the site for each individual would be:
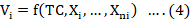
This is the basis for Travel Cost Method. Where: Xi, …Xni are the socio economic variables, such as age, education, family size, income, close substitute that can be included in the model (Hanley and Spash, 1993).
The travel cost method is a means for finding values of the visits. The idea was initially developed by Harold hoteling in 1947. Estimation of the demand curve for any site, requires the costs incurred by the individuals in travelling to the site. Individual Travel Cost and Zonal Travel Cost are widely used approaches to measure travel cost. Zonal Travel Cost Approach (ZTCA) is quite useful when one is interested to evaluate the recreational site as a whole. But the possibility that it may not consider some factors which might be important for determine the value of the site, not only that but also not easy use to value change in the quality of the recreation site. Therefore, this study is using Individual Travel Cost Approach (ITCA) to evaluate the recreational value of Kalam site. Individual Travel Cost Approach (ITCA) is similar to the Zonal Travel Cost Approach however it utilizes the data of individual respondent in the statistical analysis instead of data of each zone. Moreover, this approach required more information and to some extent more complicated analysis but provide more accurate result.
Materials and Methods
The study is based on primary data. Primary data was collected in Kalam Swat through a survey using a questionnaire. The data was collected randomly at exit point of Kalam Swat from 264 sample respondents on the following variables. Economic theory highlighted that demographic variables are believed to influence recreation visitation.
Econometric model
There are many studies (Freeman, 2003; Smith, 1984; Feenberg and Mills, 1980) which suggest methodology to value a non-market resource based observable consumption behavior. This method is called Travel Cost Method (TCM). TCM was first introduced by the Hotelling (1947) (first reported in Prewitt (1949) though Clawson (1959) and Clawson and Knetsch (1966) develop empirical model for the travel cost.
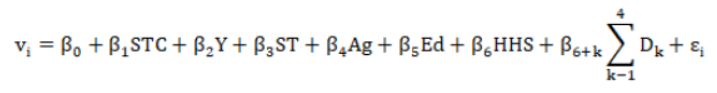
Where;
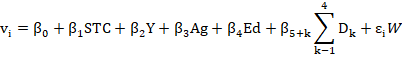
Vi , the dependent variable stands for the number of visits by the ith individual to the Swat valley Kalam per period of time, STC the sum of all cost occurred on the round trip in rupees to the site including travel time; Y indicates households’ income (Rupees (PKR)/month); STC represents site travel cost which is the Price or the cost occurred to visit a substitute site; Ag represents the for age of the respondent/visitor; Ed represents the highest level of education gained by the respondent/visitor; HHS represents the family size; D1 is dummy variable and represents the marital status: it takes the value “1” if the respondent is single; and takes the value “2” if the respondent is married. It takes the value “3” if the respondent is divorce/widow. The symbol D2 represents the gender and takes the value “1” if the respondent is male and 0 otherwise; D3 represents location and takes the value “1” if the respondent is non-local and “0” otherwise; D4 represent the Quality/satisfaction and takes the value “1” if the visitor’s perceives the quality of the site is “good” and takes the value “0” if the visitor perceive the site quality is “bad”. The symbol ɛi is the random error. The site Kalam has no close substitute to be matching with cost incurred and distance. Also the respondents haven’t mentioned any close substitute for Kalam Swat, beside these household family size is highly insignificant in our analysis therefore the variable was dropped.
Besides the study analyze the factors which effecting the willingness to pay for the tourist for the recreational site Kalam Swat for that we construct another regression model.
Where;
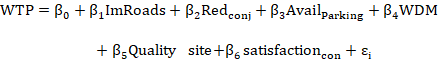
WTP is Willingness to pay; ImRoads represents Improvement in Roads; Red_conj represents Reduction in congestion; Avail Parking is availability of Parking; WDM represents Waste Disposal; Quality_ site is Quality of the Site; Satisfaction_con is Level of satisfaction of the consumer (respondents), and ɛi is the error term.
It is hypothesized that people will pay more for the improvement in road if the road condition is bad. Reduction in congestion, it is hypothesized that if the problem of congestion exist, tourists will likely to pay more in order to reduce in the congestion problem. It is also hypothesized that tourists are expected to pay more for the facility of parking. The abbreviation WDM stands for waste disposal. Waste Management is likely to enhance the beauty of the site, so tourists will likely to pay for its management. It is hypothesized that if the consumer (respondents) perceive that the quality of the environment is poor, they are more likely to pay for quality improvement. Similarly, it is also hypothesized that, if the consumer (respondent) not satisfied, he/she will be more likely to pay for development of the site.
The Poisson regression model was used which is based on the positively skewed dependent variable. It represents the number of visits to the recreational site of Kalam in last 5 years. The model is used as the data on dependent variable is discrete in nature as well as it cannot assume negative values. Models that assume the continuous data distribution such as the Ordinary Least Square (OLS) cannot be used. Therefore, we use a model that assumes the discreteness in data (Hellerstein, 1991). This method also has been used by Tullu and Katema (2014) in their study.
Results and Discussion
Descriptive results
According to Kalam Hotel Association the total average number of tourists is about 30,000 per year. Keeping confidence level 95 percent, the appropriate sample size for this population was derived as 264 respondent calculated through sample size calculator. Furthermore, around 40 percent of the visitors visit Mahodhand Lake (nearest tourist spot to Kalam) therefore our sample allocation is:
The analysis in Table 4 shows that 95 percent of the respondents are male while only 5 percent were found to be female. The reason for less number of female respondents is attributed to the fact approaching the female in the area is against the social norm of the area. Access to the female respondents is very difficult specially for male interviewers. The area is inhibited by people who are known as “Khohistani” and this culture keeping contact with female who are stranger to the person is not permitted.
Table 3: The sampling distribution of the respondents in the study area.
| Research site | Number of visitors | Total sample respondents |
| Kalam | 18,000 | 158 |
| Mahodand | 12,000 | 106 |
| Total | 30,000 | 264 |
Source: Field survey.
Table 4: Descriptive statistics of the explanatory variables.
| Variables | Response (percent) | Variable | Response (percent) |
| Gender | Marital status | ||
| Male | 95 | Married | 70 |
| Female | 5 | Single | 28 |
| Divorce/widow | 1 | ||
| Education | Residence | ||
| Illiterate | 1.9percent | Non-local | 80percent |
| Primary | 6.1percent | Local | 20percent |
| Secondary | 9.5percent | ||
| University | 82.6percent |
Source: Field Survey.
The analysis further show that 70 percent of the respondents were married followed by 28 percent single and 1 percent were found to be divorced. The reason for majority of the married respondents is attributed to the fact that married couple normally visit the site coming from down districts either for honeymoon or bringing the children for recreation. It was also found that 82.6 percent of the sample respondents had university education followed by other with 9.5 percent with secondary education; 6.1 percent with primary and 1.9 percent were illiterate. The higher education level of the sample respondents is attributed to the fact that mostly educated class are more eager to visit new places as compared to less educated people. These figures do not reflect the education level of the households in the study area. As the sample respondents belonged to different cities of Pakistan most of whom may have attended universities. The data on the location show that 80percent of the respondents were non-local (belonging to districts other than Swat) while only 20 percent were local i.e. belonging to District Swat.
Table 5 reports the results of the respondents’ views about the development of the site. A total of 58 percent respondents supported the development of the site. On the contrary, 42 percent responded that there is no need for development of the site. These respondents were of the opinion that, the development of the site is the sole responsibility of the government. In response to the question of the source of funding, a total of 51 percent were of the opinion that funding should be raised via enhancement of the entry fee, while 48.5 percent proposed the funding should be raised from the public source. While 0.4 percent of the respondents proposed the source of funding should be via donation. In response to the question do they visit the Mahodand Lake- famous lake? A total of 48.9 percent reported a visit to the lake while 51.1 percent reported that they did not visit the lake.
If there is no other way, but to raise the entry fee question was responded positively, and 98.5 percent of the total respondents said that they will be visiting the site, even if entry fee is imposed. It points that people have the willingness to pay for a visit to the site. Furthermore the respondents were asked for their willingness to pay an entry fee which will be used on the maintenance of the infrastructure thus, About 36.3 percent of the total respondents responded that even if entry fee of PKR 100 is payable, they would pay it willingly, 24.2 percent of the total respondent were willing to pay PKR 50, 13.3 percent of the respondents RS 70, 8.8 percent of the respondent PKR 30, 9.5 are willing to pay PKR 20 while only 8 percent of the total respondents were agreed to pay an entry fee below PKR 20 as an entrance to Kalam Swat.
Table 7 shows the descriptive statistics of the explanatory variables. Average number of recreational trips in last 5 years for all the respondents is 10.69 with the range of 50 trips in last 5 years. Spending on eco-tourism in the same period has an average of 163901.52. The average number of trips from in the last five years by the visitor’s to Kalam is almost 1.94 during five years to Kalam.
Table 5: Respondents’ response to the need for the development of the site and source of funding for development.
| Is there any need for development of the site?* | percent of responses | How does the funding be raised? | percent responses | Do you visit “Mahodand Lake” | percent responses |
| No | 42 | Enhance entry fee | 51 | No | 48.9 |
| Yes | 58 | Public budget | 48.5 | Yes | 51.1 |
| Total | 100 | Donation | 0.4 | Total | 100 |
Source: Field survey; *improvement of the site refers to infrastructure; camping sites; Parking areas; hotels; reduction in congestion; mapping and tourist information center.
Table 6: Visitor willingness to pay for the levying of an entry fee to visit Kalam valley.
| Category of Response | percent of respondents | Amount of fee would you pay? | percent of the respondents willing to pay |
| No | 1.5 | 100 | 36.3 |
| Yes | 98.5 | 70 | 24.2 |
| Total | 100 | 50 | 13.3 |
| 30 | 8.8 | ||
| 20 | 9.5 | ||
| Below 20 | 8.0 |
Source: Field survey.
Most of the respondents disclosed that whenever the pay visit to Kalam, it gives them a sort of satisfaction, while travelling all the way from urban areas to Kalam. A total of 89.4 percent respondents were not satisfied from the tourists spot (Kalam). Most of the respondents, around 67.8 percent reported the weather of Kalam very pleasant, while only 32.2 percent of the respondent said that the weather of Kalam is not pleasant.
Table 7: Descriptive Statistics of the explanatory variables.
| Variables | Mean | Min. | Max. |
| No. of recreational trips in the last five years | 10.69 | 0 | 50 |
| Yearly spending on ecotourism (PKR) | 163901.52 | 0 | 600000 |
| Household monthly income (PKR) | 36443.18 | 8000 | 90000 |
| Distance (Km) | 393.77 | 3 | 2000 |
| No. of trips to kalam in last five years | 1.94 | 0 | 24 |
| Age (Years) | 35.56 | 20 | 58 |
| Household Size | 5.24 | 2 | 12 |
Source: Field survey.
The visitors were enquired about their view of visit to Kalam valley. They were asked to give their frequency of visit if the tourist site is further developed. The development presented to the respondents included, improved road infrastructure, affordable, low cost and comfortable accommodation, tourists information facilities, telecommunication and public transport for the tourists etc. Around 42 percent of the total respondents were willing to visit the site 1 time a year, 36 percent of the total respondents were willing to visit 2 times in a year, 0.4 of the total respondents were agreed to visit 6 times, 6.1 percent will visit 3 times, 3 percent will visit 4 times, 3.4 will visit 5 times, 0.8 percent of the total respondents are willing to visit 8 time per year, 3.8 percent will visit 12 time per year, 0.4percent will visit 7 time per year, 0.4 will visit 13 time, another 3.4percent of the total respondents willing to visit 9 times per year, while only 0.4percent of the total respondents were willing to visit 16 times per year (Table 7).
The analysis in Figure 1 shows that majority of the visitor lies in the upper income bracket (Rs. 50000-Rs.100000). While a small proportion 3.4 percent belonged to the lower income bracket (Rs.5000-Rs.10000). These findings point to the fact that people with high income are among those who visit the tourist attraction locations.
The results in Figure 2 shows that analysis of the data concerning no of days spent at the site. A total of 29.5percent of the total respondents said that they spent only 4 days at site, 26.9percent disclosed 3days, 15.9percent replied 1 day, 10.2percent answered 2 days, 12.1percent of total responded 5 days, 3.4percent of the total respondents spent 8 days, 0.8percent of the total respondent spent 10 days while only 0.8percent of the total respondents are those who spent 14 days at site Kalam Swat.
The analysis in Figure 3 reveal that 96.6percent of the visitors recommended improvement of roads in Kalam. Such developments are likely to increase the flow of tourists and also the value (benefits) of the site as well it will be easy for them to travel again and visit the site in future. Furthermore, when roads are constructed properly then it will take very short time to reach the site as well as the cost of maintenance of the vehicle will cut down.
Figure 3 further shows the analysis of the data regarding waste management. The waste disposal problem is one of the serious issues leading to pollution of river water and other water resources. It was found as depicted in Figure 3 that 93.9percent of the total respondents highly recommended that the authorities should take care of this problem.
A total of 86 percent of the total respondents indicated that congestion is a problem. This is attributed to the fact the road from Bahrain to Kalam is still under construction, and that due to heavy machinery and other impediments cause road congestion most of the time in the peak season.
On inquiring about the requirement of Tourist Information Centers (TICs), 61.4 percent of the total respondents replied that there is no need of the TICs while, 38.5 percent of the total respondents replied yes to this question. No respondent left this question unanswered. So, it means that Tourist Information Center is an important component for quality tourist services. It will not only attract the tourist to visit the site by helping them in their visits but also generate employment for the local people.
Table 8: Respondents opinion about their satisfaction and weather of the tourist site.
| Are getting sort of satisfaction? | percent of responses | Do you like the weather? | percent responses |
| No | 89.4 | No | 32.2 |
| Yes | 10.6 | Yes | 67.8 |
| Total | 100 | Total | 100 |
Source: Field survey.
Table 9: Visitors’ perspective visit to the site after development of Kalam.
| No of proposed visit after development | percent of responses | No of proposed visit after development | percent of responses |
| 1 | 42 | 7 | 0.4 |
| 2 | 36 | 8 | 0.8 |
| 3 | 6.1 | 9 | 3.4 |
| 4 | 3 | 12 | 3.8 |
| 5 | 3.4 | 13 | 0.4 |
| 6 | 0.4 | 16 | 0.4 |
Source: Field survey.
Results in Table 10 shows number of visits to Kalam is significantly affected by respondents’ education, gender, age, income and perception about the site. The coefficient associated with gender reveals that the average number of visits to Kalam for male on average is higher by 0.72 (visits) as compared to females. Our results are consistent with the study of (Khan, 2004) who also reported the insignificance of age with a negative sign and significant positive coefficient of monthly income of the respondent, in our result coefficient of household monthly income consistent with the study of Wynen (2013) and Ahmad (2015). Furthermore, data was collected mostly from male respondents, due to social, religious and cultural constraints.
Table 10: Estimated results of poisson regression equations.
| Variable | Coefficients (t-stats) |
| Dependent Variable | Total No. of Visits in previous 5 years |
| Log STC | -0.57 (0.311) *** |
| Log Y | 0.19 (0.211) |
| Marital status 0 single 1 married | -0.26 (0.239) |
| Age | 0.019 (0.014) |
| Education | 0.19 (0.136) |
| Dummy1 (1 for Male, 0 female) | 0.72 (0.409) *** |
| Dummy2 (0 for local, 1 for non-local) | -3.54 (0.364) * |
| Dummy3 (1 if Visitor’s Perception is Good/satisfied; 0 otherwise) | 0.46 (0.181) * |
| Chi-sq value: 219.87 | |
| Prob. Of Chi-sq: 0.0000 |
Note: *; **; *** indicates significant at 10; 5 and 1percent respectively.
Level of education is positively related to the number of visits. These results are consistent with the study of Wynen (2013). The sign is correct according to a priori expectation, but it is insignificant which could be attributed to the fact that in the sample, a very large number of respondents had a university level education. The total cost incurred on trips, marital status and visitors’ location have negative relationship with the number of visits to Kalam. In contrast, local and non-local visitors and total cost occurred on trips have negative and statistically significant relationship with the number of visits to Kalam. These results are consistent with the study of Khan (2004), Wynen (2013), Tullu and Ketema (2014), Ahmad and Hussain (2015). This is in accordance with the law of demand, that is as price or travel cost increases the quantity of the visitation rate per zone will decrease. Therefore, it can also be observed that larger the distance of the tourists from the site, the higher will be the Travel Cost. As the distance between the home town and the site increases, the number of visits to the site decreases and vice versa. Furthermore, the coefficient of the total cost incurred on trips in previous five years indicates that 1percent increase in the cost of the trip will lead to decrease of about 1 trip in to site, for locality of the visitors, on average the non-local people visits less by -3.54 to Kalam as compare local visitors. These results are consistent with the early findings of Khan (2006) except marital status. Besides these, the coefficient of the visitors’ perception about quality of the site is positively and significantly associated with the number of visits to the recreational. The better the quality of the site the more likely the respondents to visit the site. Similar findings have also been reported by Wynen (2013).
Moreover, the results obtained from Poisson regression the value of Chi Square indicate that overall model is highly significant and fit.
The results in Table 11 show a positive and statistically significant relationship among maximum willingness to pay with improvement in roads. This confirms our hypothesis that people will pay more for the improvement of road if they perceive that the condition of the road is bad. The coefficient of availability of parking is positive and significant at 10 percent level of significance, which implies that willingness to pay is positively associated with the availability of parking. This confirms our hypothesis that tourists are expected to pay more, if the facility of parking is provided.
Table 11: Estimated results of poisson regression equations.
| Dependent Variable | Maximum willingness to pay |
| Variable | Coefficients (t-stats) |
| Improvement of Roads perception | 12.98(2.35) *** |
| Reduction in congestion | 0.757(1.45) |
| Availability of Parking | 5.293 (1.05) *** |
| Waste management | 2.052 (2.066) |
| Quality of the Site perception | -1.207(0.69) * |
| Satisfaction of the visitor | -13.255(1.09) *** |
Note: *; **; *** indicates significant at 10; 5 and 1percent respectively.
The coefficient of the variable “quality of the site” is negative and significant at 1 percent level of significance, which implies that willingness to pay negatively depends on visitor perception of the quality of the site. This confirms our hypothesis that if the consumer (respondents) perceive that the quality of the environment is poor, they are more likely to pay for quality improvement.
The coefficient of satisfaction of the consumer is negative and significant at 1 percent level of significance. This implies that willingness to pay is negatively associated with the satisfaction of the respondents. This confirms our hypothesis that if the consumer (respondents) perceive the quality of the site is low/if the consumer (respondent) not satisfied, he/she will be more likely to pay for development/improvement of the of the quality of the site.
Estimation of the recreational value
Estimation of the consumer surpluses were obtained through the following formula: using the method of Creel and Loomis (1990).

The recreational value of the site or the consumer surplus estimated value for the year (2014) for Kalam was PKR 421.45 million. This method was also followed Ahmed and Hussian (2016).
Conclusions and Recommendations
The Non-market valuation of recreational parks and natural sites been an important area of research in environmental and resource economics. This paper has estimated the recreational benefits and visitors’ willingness to Pay (WTP) for development of the famous valley of Kalam in Swat, Khyber Pakhtunkhwa. Travel Cost Method and visitors’ Willingness to pay techniques have been used. The findings show the Total Economic Value (TEV) is worth Rs. 421 million based on visitors’ Willingness To Pay (WTP) for the development of the valley including improvement of roads, accommodation facilities, tourists information facilities, telecommunication and public transport. It is concluded that valley of Kalam has a potentially high use value and sufficient revenue can be generated as visitors are willing to pay for the site development. It is also concluded that tourist is more likely to pay for the development, if various aspects are considered by the concerned stakeholders, and development agencies. Among others, improving the conditions of the roads, provision of safe parking space, and overall development of the quality of the site shall be focused in any developmental program. The current analysis has shown that enhancing the level of amenities for the tourists will generate sufficient funds for further development of this scenic tourist spot. Therefore, the policy should focus on strategies to generate public funds through levying of fee on entry, and such funds shall be utilized on the development of facilities targeted towards the tourists. That in turns may lead to positive outcome for the improvement of the livelihoods of the surrounding population, majority of whom are still living below the poverty line. Such strategies may help to promote tourism vis-à-vis ensure sustainable utilization of the natural resource and livelihoods improvement.
Novelty Statement
A road map for policy makers to introduce payment system for the tourist visiting District Swat, Kalam. Funds-generating could be the main revenue source for the area development and conservation.
Author’s Contribution
Sanaullah: Conceived the Idea, designed the research and col-lected the data.
Fazli Rabbi: Contributed in data processing and interpretation of results and organized overall manuscript development.
Shahid Ali: Contributed in analysis and discussion of results
Zeeshan Khan: Contributed in review of literature
Muhammad Zamin: Contributed in technical support for plant species and biodiversity.
References
Álvarez-Farizo, B., N. Hanley and R. Barberán. 2001. The value of leisure time: a contingent rating approach. J. Environ. Plant Mange. 44(5): 681-699. https://doi.org/10.1080/09640560120079975
Ahmed, N. and A. Hussain. 2016. The recreational value of Rohtas fort, Pakistan. Asia Pac. J. Tour. Res. 21(7): 782-794. https://doi.org/10.1080/10941665.2015.1075563
Cesario, F.J. 1976. Value of time in recreation benefit studies University of Wisconsin press. pp. 32-41. https://doi.org/10.2307/3144984
Cesario, F.J. 1976. Value of time in recreation benefit studies. Land Econ. 52(1): 32-41. https://doi.org/10.2307/3144984
Clawson, M. and J.L. Knetsch. 1966. Economics of outdoor recreation. Johns Hopkins Univ. Press Baltimore.
Chotikapanich, D. and W.E. Griffiths. 1998. Carnarvon gorge: A comment on the sensitivity of consumer surplus estimation. Aust. J. Agric. Res. Eco. 42(3): 249-261. https://doi.org/10.1111/1467-8489.00049
Creel, M.D. and J.B. Loomis. 1990. Theoretical and empirical advantages of truncated count data estimators for analysis of Deer hunting in California. Am. J. Agric. Eco. 72(2): 434-441. https://doi.org/10.2307/1242345
Ezebilo, E.E. 2016. Economic value of a non-market ecosystem service: an application of the travel cost method to nature recreation in Sweden. Int. J. Bio. Sci. Eco.Syst. Serv. Manage. 12(4): 314-327.
Freeman, A.M. 2003. The measurement of environmental and resources values resources for the future, Washington, DC (2003), Google scholar.
Feenberg, D. and E. Mills. 1980. Measuring the benefits of water pollution abatement. New York: Acad. Press. https://doi.org/10.1016/B978-0-12-250950-6.50013-1
Hanley, N. and C. Spash. 1993. Cost-benefit analysis and the environment, Edward Elgar, Aldershot.
Herlina, S.S. 2015. Visitors’ willingness to pay for local tourist attraction in Sabang based on travel cost method. IJABER, 5677-5701.
Himayatullah, 2003. Economic valuation of the environment and the travel cost approach: The case of ayubia natioanl park. Pak. Dev. Rev. 42 (4): 537-551. https://doi.org/10.30541/v42i4IIpp.537-551
Hellerstein, D.M. 1991. Using count data models in travel cost analysis with aggregate data. Am. J. Agric. Econ. 73(3): 860-866. https://doi.org/10.2307/1242838
Khan, H. 2004. Demand for eco-tourism: estimating recreational benefits from the margalla hills national park in northern Pakistan. Working papers 31. S.Asian Netw. Dev. Environ. Econ. (Vol and Pages).
Khan, H. 2006. Willingness to pay for Margalla Hills National Park: Evidence from the travel cost method. Lah. J. Econ. 11(2): 43-70. https://doi.org/10.35536/lje.2006.v11.i2.a3
Lansdell, N. and L. Gangadharan. 2003. Comparing travel cost models and the precision of their consumer surplus estimates: Albert Park and Maroondah Reservoir. Aust. Econ. Pap. 42(4): 399-417. https://doi.org/10.1111/1467-8454.00207
Mishra, P.P. 2014. Potential benefits and earnings from improving the hussain sagar lake in Hyderabad: A combined revealed and stated preference approach.
McConnell, K. 1992. On-site time in the demand for recreation. Am. J. Agric. Econ. 74 (4): 918-927. https://doi.org/10.2307/1243189
McNeely, J.A. 1994. Lessons from the past: forests and biodiversity. J. Bio. Conserv. 3: 3–20. https://doi.org/10.1007/BF00115329
Nillesen, E. 2002. The travel cost approach: an application to Bellenden Ker National Park. An Unpublished Thesis submitted to the School of Economics, University of Queensland, Australia.
Pienaar, E. 2017. Valuing the recreation uses of natural resources: The travel cost method. WEC341. Gainesville: Univ. Florida Inst. Food Agric. Sci. http://edis.ifas.ufl.edu/uw386
Rafiq, M., M. Shafiqullah and A. Malik. 2007. Demand analysis of recreation visits to Chitral Valley: A natural resource management perspective [with comments]. Pak. Dev. Rev. pp. 971-984. https://doi.org/10.30541/v46i4IIpp.971-984
Rabbi, F., A. Ali, S. Ali and A. Khan. 2014. Doing Business under terror: Empirical assessment of Hotel Business in the Post Conflict Period in Swat valley, Pakistan. NICE Res. J. (7): 11-29.
Rome, S. 2005. Forestry in the princely state of Swat and Kalam ( North-West Pakistan). A historical perspective on norms and practices . IP6 working paper, No. 6.
Seller, C., J. Stoll and J. Chavas. 1985. Validation of empirical measures of welfare change: A comparison of nonmarket techniques. Land Econ. 61 (2): 156-175. https://doi.org/10.2307/3145808
Tullu, F.S. and M. Ketema. 2014. Determinants of recreational demand of abijatashalla lakes national park in Ethiopia: A Travel Cost Approach. Doctoral dissertation, Haramaya Univ.
Togridou, A., T. Hovardas and J.D. Pantis. 2006. Determinants of visitors’ willingness to pay for the National Marine Park of Zakynthos, Greece. Ecol. Econ. 60: 308–319. https://doi.org/10.1016/j.ecolecon.2005.12.006
White, P.C.L. and J.C. Lovett. 1999. Public preferences and willingness to- pay for nature conservation in the North York Moors National Park, UK. Env. Manage. 55: 1–13. https://doi.org/10.1006/jema.1998.0250
Wynen, J. 2013. An estimation of the determinants of same-day visit expenditures in Belgium. Tour. Econ. 19 (1): 161-172. https://doi.org/10.5367/te.2013.0190


