
Virologic Detection and Molecular Characterization of Rabies Virus in Delta Region, Egypt

Virologic Detection and Molecular Characterization of Rabies Virus in Delta Region, Egypt
Morcos Ibrahim Yanni1* and Eid Elsaid Abdelaziz2
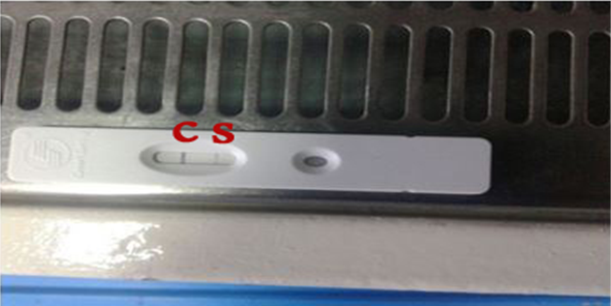
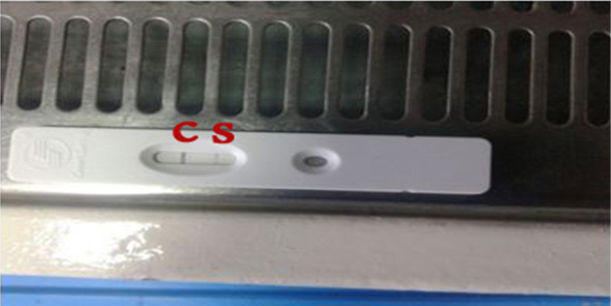
Positive brain sample using the rapid antigen test kit C control line /S positive sample line.

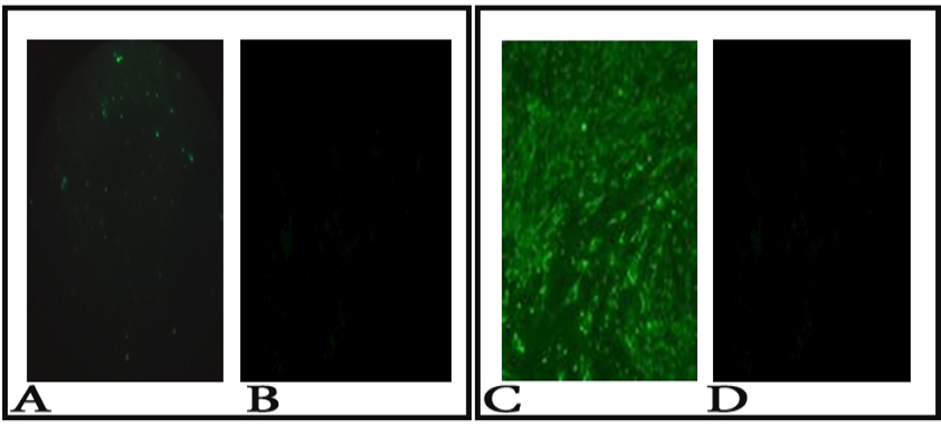
A: Positive fluorescence on brain impression smear 100x (dust like appearance of apple green color); B: No fluorescence at a negative control brain impression smear; C: Positive fluorescence sample on BHK cells100x (intracytoplasmic fluorescence); D: No fluorescence at a negative control BHK cells.

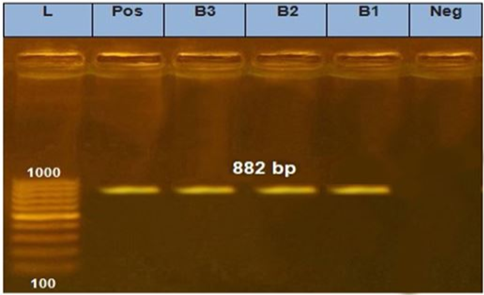
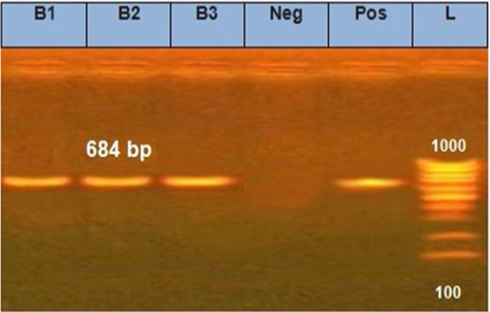
The electrophoretic pattern of PCR products (684 bp) to the brain samples (B1, B2, B3) for N gene.
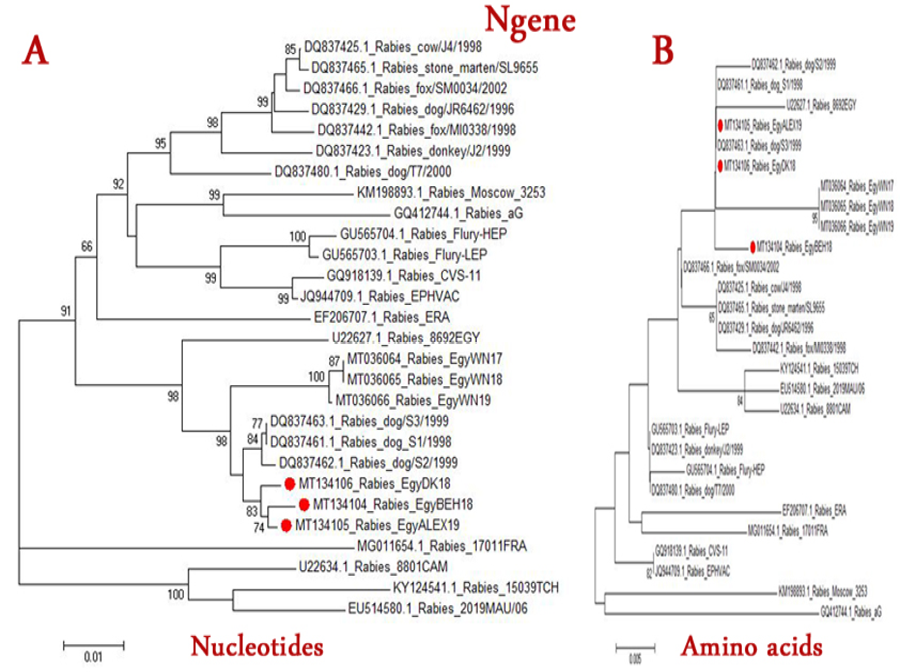
The Phylogenetic tree of Rabies viruses based on nucleotide (A) or Amino acid (B) sequence of N gene. Phylogenetic tree is based on maximum likelihood calculations (Mega 7 software) under the best fit model. Numbers at nodes represent measures of robustness based on 1000 bootstrap values. The sequences of selected publicly available strains were obtained from GenBank. Strains of current study are labeled with red circles.
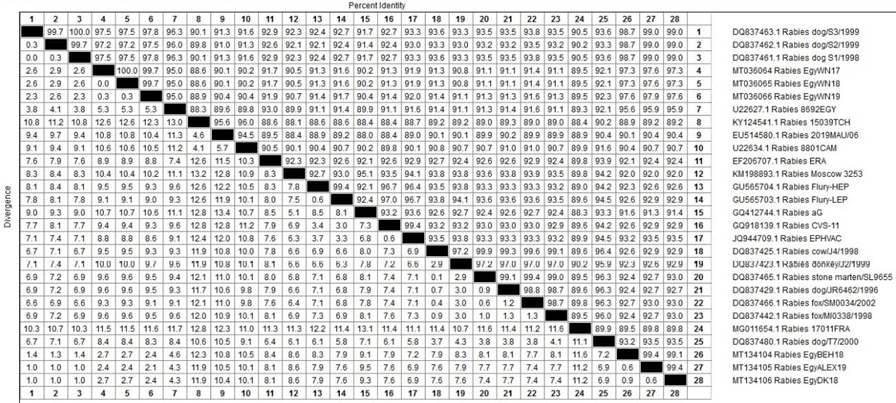
Figure illustrating the % of nucleotide identity of some Egyptian rabies isolates with other rabies virus isolates and strains at the level of the N gene.

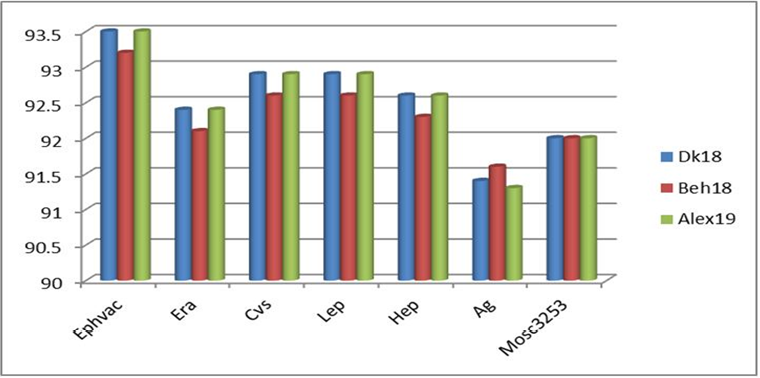
Comparing the nucleotide identity between each of the new Egyptian isolates and some vaccinal strains at the level of the N gene.
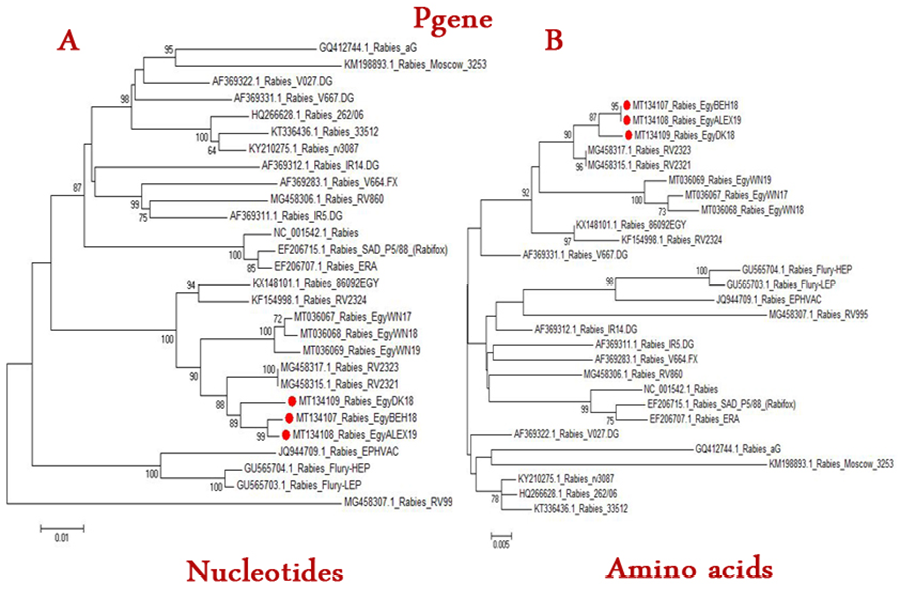
The phylogenetic tree of Rabies viruses based on nucleotide (A) or Amino acid (B) sequence of P gene. Phylogenetic tree is based on maximum likelihood calculations (Mega 7 software) under the best fit model. Numbers at nodes represent measures of robustness based on 1000 bootstrap value. The sequences of selected publicly available strains were obtained from GenBank. Strains of current study are labeled with red circle.
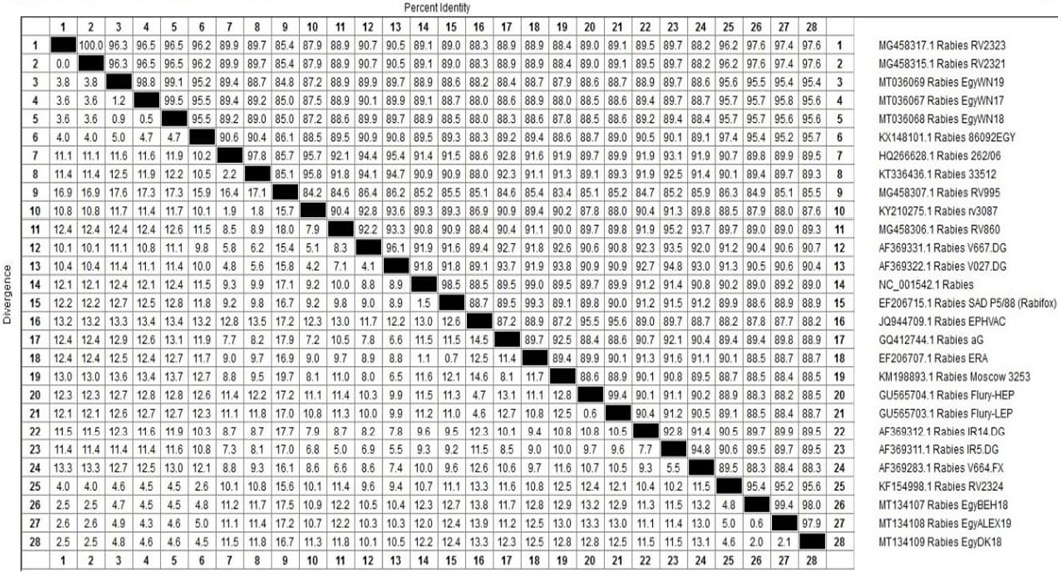
Figure illustrating the % of nucleotide identity of some Egyptian rabies isolates with other rabies virus isolates and strains at the level of P gene.
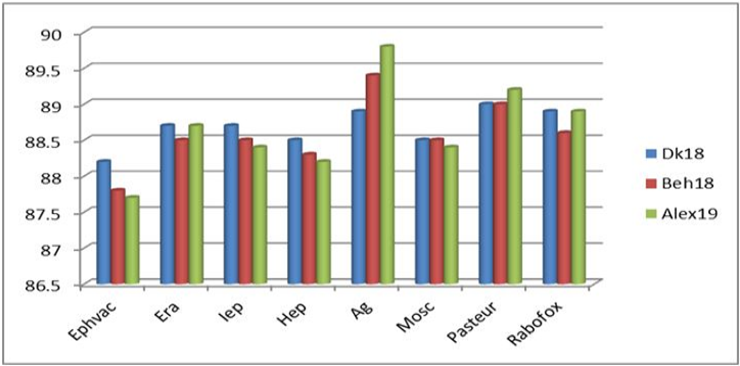
Chart comparing the nucleotide identity between each of the new Egyptian isolates and some vaccinal isolates at the level of the P gene.

