Using of Autoregressive Integrated Moving Average (ARIMA) Model for Forecasting Milk Production of Dairy Cattle Farms in Dakahlia Governarate of Egypt
Using of Autoregressive Integrated Moving Average (ARIMA) Model for Forecasting Milk Production of Dairy Cattle Farms in Dakahlia Governarate of Egypt
Asmaa A. Badr, Eman A. Abo Elfadl, Mohammed M. Fouda, Sayed M. Elsayed
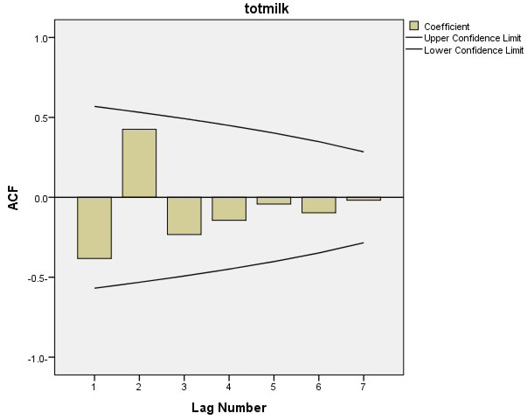
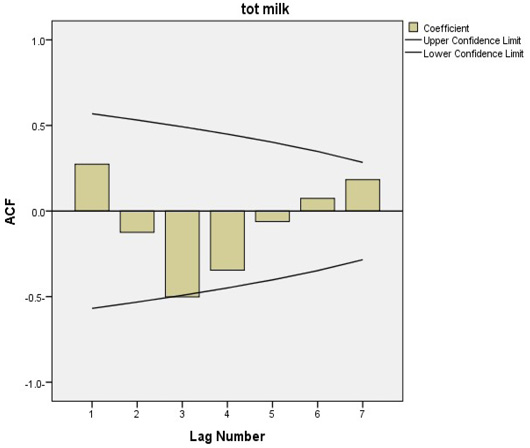
ACF value (Holstein Friesian).
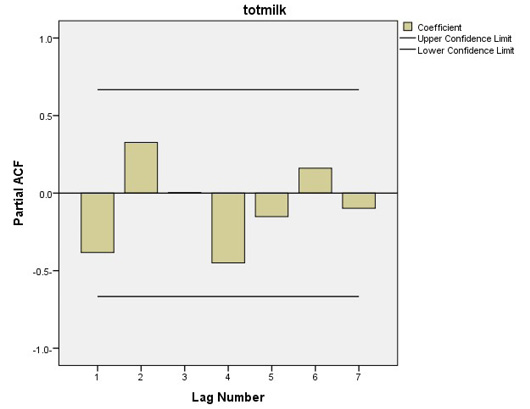
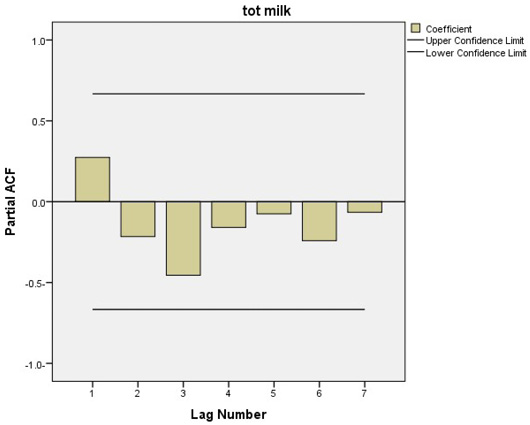
Partial ACF (Holstein Friesian).
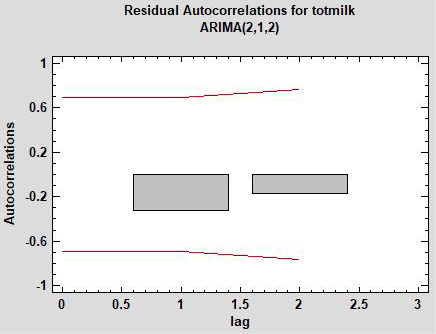
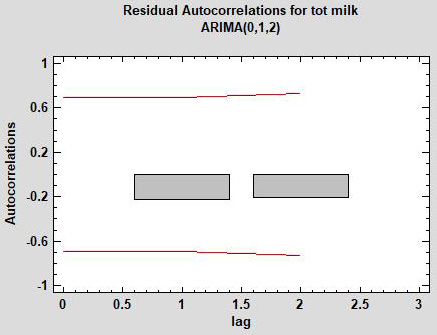
Residual autocorrelation.
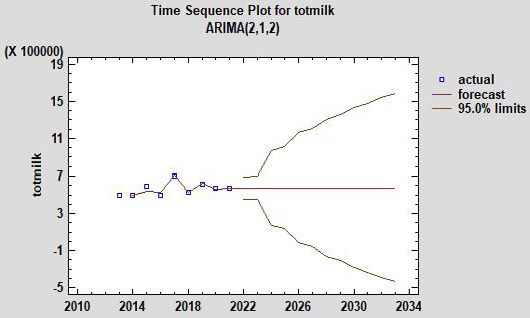
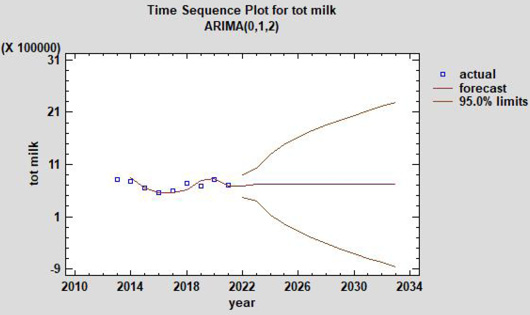
Time sequence plot for milk production of Holstein Friesian.
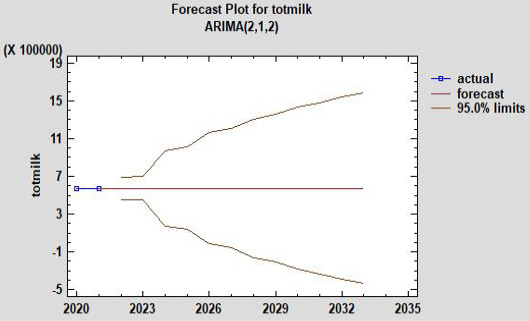
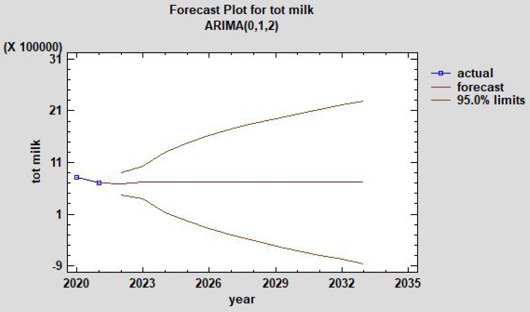
Forecasting plot for milk production of Holstein Friesian.
ACF (auto correlation function) for Holstein German.
PACF (partial auto correlation function) for Holstein German.
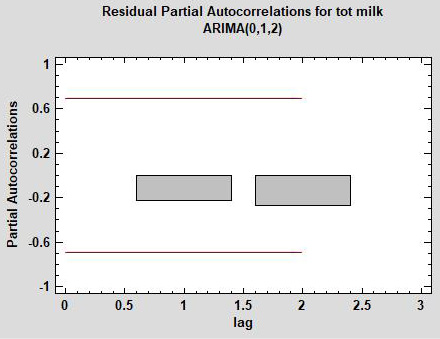
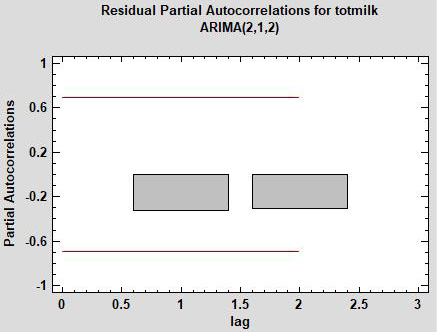
Residual partial autocorrelation.
Forecast plot for Holstein German.
Residual partial autocorrelation.
Residual autocorrelation for Holstein German.
Time sequence plot for forecasting milk production of Holstein German.


