Urban Residential Asthmatics Facing the Hazards of Indoor Carbon Dioxide (CO2) Concentrations in Lahore, Pakistan


Urban Residential Asthmatics Facing the Hazards of Indoor Carbon Dioxide (CO2) Concentrations in Lahore, Pakistan
Syed Shahid Imran Bukhari
Government Graduate College of Science Wahdat Road Lahore, Pakistan.
Abstract | This study provides information about the indoor air quality (IAQ) of local asthmatics. Lahore, being a metropolitan city, is among the most polluted cities Pakistan. IAQ has been a matter of public concern in the country. Asthma is a common respiratory disorder. CO2 is components of the air we breathe; type of house and room is directly linked with its concentration. CO2 concentration is a surrogate indicator for the assessment of IAQ and ventilation efficacy. Average indoor CO2 can be helpful to identify ventilation system performance. Data was gathered from 50 asthmatic homes with natural ventilation located throughout the nine administrative towns of Lahore, Pakistan. The levels of CO2, the rate of air change, and the rate of ventilation per person per second were all closely observed in each home. Using CO2, the ventilation rates were commuted using the tracer gas approach. The CO2 monitor was used to measure the levels of CO2 indoors. With SPSS (v.22), statistically significant correlations between open and closed windows of indoor CO2 levels have been found. Every micro environment’s lowest and highest air exchange rate per hour (ACH) was evaluated, and its effects on asthma were noted. Elevated symptoms of asthma have been linked to low ventilation rates. The findings indicated that the ambient air’s CO2 concentration above regulatory limits set by NEQS (National Environmental Quality Standards) and USEPA (United States Environmental Protection Agency), however observed elevated concentrations were in accordance with the given low occupancy (4 people/100 m2). Other related characteristics included socioeconomic status, smoking, and cleanliness. According to the results, improved ventilation rates per person in a normal home can reduce symptoms by up to 80%. Correlation analysis and one-way ANOVA were used to assess relationships between indoor CO2 concentration and ventilation rate. The high rates of CO2 contamination in the homes under examination pose a major risk to the health of those who have asthma, especially and occupants of such houses normally. Curative steps are needed to safeguard the people at risk.
Novelty Statement | This study is unique in reporting the risk of high indoor carbon dioxide concentrations for asthmatic patients of people living the urban areas of Lahore Pakistan.
Article History
Received: November 06, 2023
Revised: April 12, 2024
Accepted: April 29, 2024
Published: May 29, 2024
Keywords
Carbon dioxide, indoor air quality (IAQ), ventilation, air change rate per hour
Copyright 2024 by the authors. Licensee ResearchersLinks Ltd, England, UK. This article is an open access article distributed under the terms and conditions of the Creative Commons Attribution (CC BY) license (https://creativecommons.org/licenses/by/4.0/).
Corresponding author: Syed Shahid Imran Bukhari
To cite this article: Bukhari, S.S.I., 2024. Urban residential asthmatics facing the hazards of indoor carbon dioxide (CO2) concentrations in Lahore, Pakistan. Punjab Univ. J. Zool., 39(1): 107-118. https://dx.doi.org/10.17582/journal.pujz/2024/39.1.107.118
INTRODUCTION
Pakistan is a heavily populous country, ranking sixth among other nations, with an estimation of 2.62% of 179 million total world’s population (DESA UN, 2012). The average persons per household is 7.2 as estimated in a survey conducted in 2009-2010 by Pakistan Economic Survey, due to an increasing tendency in population dynamics; around 64% of the country’s population lives in rural areas. Approximately 92% of people living in rural areas and 22% of people living in urban areas use solid fuels for cooking and other uses, like space heating, which contributes to indoor CO2 rise (Satish et al., 2012).
Lahore is provincial capital of Pakistan, District Sheikhupura at north and Wagha border (Indo-Pak Border) at east and district Kasur on south. River Ravi passes from the north of Lahore. Lahore city contributes over 13.2% of the country’s GDP, growing at an average annual rate of 5.6%. The city’s dense transportation network and industries seriously harm both the urban environment and public health. Elevated air pollution is known to be associated with a higher risk of respiratory allergies, kidney damage, asthma, and other mental health issues (Butler et al., 2012). People, however, are not well informed about the risks and expenses to which they are exposed.
Indoor air pollution is a major concern especially in developing countries like Pakistan which is facing severe pollution problems. The air quality situation in urban areas is deplorable and the lack of information leads to an inability to understand the health risks. NEQS are set by the government to control a certain pollutant in limited range in the air. It is also recommended that indoor air pollution is also a potent health risk which must be addressed at the political level. No standards have been defined for determining range values of indoor pollution. Apart from a few studies, detailed information on monitoring CO2 concentration in residential environments is lacking (Kulshreshtha and Khare, 2011).
The matter of discuss contamination are not recent ones rather they are known and emitted by cave men since ancient times when fire burning was explored which included up CO2 interior these caves. This focuses out to the moo ventilation at that time but how much it must have influenced the tenants is still obscure (Satish et al., 2012). It gives an inspiration to understanding into the tall levels of toxins collection inside display residences. In 12th century, few European houses began utilizing chimneys but the chimney stacks became common by 16th century (Zhai et al., 2011). Initially primary IAQ issues were highlighted in early 19th century and then amid vitality emergency in late 19th century, IAQ issues became main focus (Sherbini and Pariggar, 2016). In arrange to avoid open air poisons from mixing with indoor environment, different precautions were made including covering buildings and making at that point discuss tight. In spite of the fact that these steps demonstrated valuable in avoiding invasion from the encompassing discuss, it too postured unused issues, expanded concentration of gasses like CO2. The toxins concentration was found to be more in indoor air as compared to outdoor space. There is an assessment of sources within indoor environment which are supposed to be cause of next toxin level than the encompassing discuss (Wellenius et al., 2012).
Carbon dioxide is fundamental constituent of the soil environment. It is additionally a critical human metabolite. There are 350-400 ppm foundation levels of CO2 in surrounding discuss. Its concentration in buildings can be as higher indeed coming to 4000-4500ppm (De Giuli et al., 2012). The main components which contributes to CO2 level of indoor air includes the recurrence of discuss trade and human expiration due breathing. The strategies used to measure the ventilation rates in the interior of a building take account of the number of tenants, volume of the building and the ACH (Fischer-Mackey, 2013).
There are assortment of components within the indoor environment whose interaction can unequivocally decide the IAQ. These components incorporate the development of tenants coming about in resuspension of as of now stored tidy and contaminants; exercises of the tenants in this manner creating shifting sums of toxins; sources and sinks of poisons and development of discuss inside the distinctive parts of the building and from the outside influencing the evacuation as well as scattering of poisons (Satsangi et al., 2014). These sources change in nature such as outside, inner, organic or chemical in nature (Goyal and Khare, 2011). Discuss development is additionally an indispensably portion of IAQ. Discuss development in a building may be common or forced by a warming ventilation and discuss Conditioning (HVAC) setup. In essence, the ventilation system is a guarantee of invasion and exfiltration of the discussion in and out of the building. As a result, the toxins can move in and out of the indoor miniaturized scale situations (Fiorentini et al., 2015). Some of the different variables that have an effect on discussion streams in real ventilation buildings are location, shape and estimate of building close to wind direction as well as geology. It is also important to keep the temperature and humidity between indoors and outdoors consistent. The two driving forces that cause the wind flow from the exterior to the interior environment are the warm buoyancy and the weight of the wind. Also, it is important that the temperature and humidity of both indoors and outdoors are appropriate.
The two main drivers of the wind flow from the exterior to the interior environment are the warm buoyancy and the weight of the wind (ASHRAE, 2012). As ventilation is characterized by the supply of sufficient quantities of fresh air in an indoor atmosphere to allow people to breathe easily, and as a flood of air from inside can weaken or evacuate poisons that have been produced indoors. A constant supply of new discuss within the indoor small-scale situations is an imperative figure to preserve a solid environment. A higher rate of ventilation implies littler home time of the toxins inside. Ventilation may be characteristic, mechanical (fans or HVAC frameworks) and half breed (Fiorentini et al., 2015). On the other hand, when the external environment is increasingly contaminated, more poisons will stream inside, weakening the toxins as they congregate inside the compartment. The HVAC systems may contain a variety of microorganisms that pose a risk to human health. However, if properly maintained, HVAC systems can be helpful in maintaining a high IAQ (Zhou and Chen, 2010). While natural ventilation is less expensive than mechanical ventilation, it is also more unpredictable because airflow is not always consistent under changing weather conditions. Furthermore, the opening and closing of windows and other similar openings affects the amount of open-air discussion that (Dong and Lam, 2014).
Individuals with asthma are more effortlessly influenced by the unfavorable wellbeing impacts of indoor toxins as compared to sound individuals (Samet et al., 2000). Numerous epidemiological considers of asthma and healing center confirmations are joined with indoor discuss contamination in North America and Europe (Galan et al., 2003; Dominci et al., 2006). However, limit contrasts within the occurrence of asthma among different age bunches like elderly, grown-ups and children have uncommon been tested appropriately (Peel et al., 2005; Atkinson et al., 2001). There aren’t many epidemiological studies assessing how indoor CO2 concentration affects asthma flare-ups (Tolbert et al., 2007).
Materials and Methods
Main purpose of the current ponder was to look into the features and parameters of CO2 concentration air change rate and in naturally ventilated houses of asthma patients of Lahore.
Study area
Lahore is the chronicled city at (31°15’-31°45’ N and 74°01’-74°39’ E), 2nd greatest city of Pakistan located in territory of Punjab. Ravi waterway streams within the north-west. The city is amplified 1772 km2 zone at 217m height over the ocean level. In 2001, Lahore was relegated the regulatory status of city Locale and is separated into 9 small and big towns and military organization cantonment zone. Being one of thickly populated cities around globe, populace of Lahore is around 9,086,000 tenants (Farhat et al., 2018). Lahore gets a hot climate with ordinary temperature ranging up to 24.3oC (Rasheed et al., 2015). The highest usual temperature during exceptionally hot summers is between 33 and 39°C, while the lowest normal temperature is between 22 and 28°C. The range of wintertime maximum temperatures is 17–22°C, while the range of minimum temperatures is 7–12°C (Alam et al., 2012). Lahore encounters yearly precipitation, 600-800 mm, for the most part amid the months of rainstorm period (Mid-July till September) (Pakistan Meteorology Division).
Site selection
Chosen destinations (n= 50) were inside the run of 02 km from main streets with overwhelming activity and different of urban environment regions. Among the chosen houses as it were twenty houses were chosen in urban, ten in semi urban, ten in absolutely commercial region and ten found in region of parks. These houses were of variety of floor area opted from each town. Three groups were formed on the basis of size of the houses large, 418.06 m2, medium; 211-104 m2 and small; 62.71 m2. Since the number of people is also very significant contributor to the indoor air quality; three occupancy levels were also formed low with 03-05 occupants, medium with 06-09 occupants and high with 08-12 occupants.
Filling of survey questionnaire
Survey questionnaire was completed about every sampling site to get data regarding total number of residents, everyday routine activities, the time spent outdoors and indoors, smoking habits, fuel type for cooking and health status. The data thus collected was exceptionally valuable with a knowledge within the day by day schedule of the inhabitants and the conceivable exposures to the toxins at indoor and exterior as well.
Strategies of CO2 checking
Dragerwerk AG, Germany and Drager suction pump (Accuro ® 2000, Dragerwerk AG, Germany) were utilized for estimating indoor level of CO2. Data collected includes CO2 concentrations (one reading) in parts per million (ppm) at each residence.
Estimation of ACH
Every one of the selected homes has regular, good ventilation. The rate of ventilation in each subject’s living room was measured. In order to maintain the same CO2 level, this procedure was finished while no one was in the room. When employing carbon dioxide as a tracer gas, the concentration rot technique was applied. The source of CO2 was a fire quencher barrel, and the IAQ gas test (BW innovations) was used to measure the concentration of gas. With the help of fans, CO2 was introduced into the room and allowed to evenly disperse across the famed foundation concentration. Gas concentration was measured every three minutes until it was within 200 parts per million of the recommended level. Plotting the normal log of CO2 (ppm) over time (hours) yielded an ACH = inclination of the best fit line. The analysis of alter per hour (ACH) was performed to determine the ventilation rate at every site. The volume of discuss entering the desired rooms were too decided by utilizing the straightforward equation:
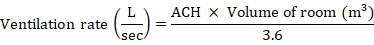
A constant blending and accessibility of new discussions is not ensured by shared ventilation. Because of this, the volume of air shown per person in both miniaturised size scenarios was also determined using the formula Ventilation rate (L/s/person) = L/sec x number of people in the room (Fischer-Mackey, 2013).
Data analysis
Pearson’s relationship between discuss change rate and CO2 concentration was calculated to scrutinize the impact of ventilation rates of indoor discuss through SPSS (v.22.0).
Results
This study compares the CO2 concentrations in 50 asthmatic patients’ actual ventilated homes in Lahore, Pakistan, and offers the results of ACH as well as stream rate and CO2 generation. The selected locations (n = 50) were located between 0.5 and 02 km away from areas of high surge activity in various metropolitan environments. Ten of the selected residences were set up in mechanical ranges; the remaining twenty were located in metropolitan areas, ten in semi-urban areas, and ten near parks. Other than winter, windows were typically left open due to Lahore’s warm environment throughout the year.
Generally speaking, the majority of people living in households were work holders, house spouses, understudies, and house spouses. In all households, fossil fuel petrol was being used as a burning fuel. Table 1 shows that 50% of homes had a kitchen and a living room connected, 40% had a kitchen and a resting room slightly associated, and 10% had neither (Table 1). The floor plans of each place were set up to observe how the spaces were displayed for trade discussions and to gain insight into the living rooms of Lahore’s asthmatics. The study determined that there was a coordinating association between ventilation rate and the measurements of rooms, living regions, entryways, windows, and removals from the street.
The housing estimate for the category-A locations under inspection was 418.1 m2, with a floor zone spanning from 76.26 m2 to 87.16 m2. There were now between 8 and 12 residents, one of whom was a visitor smoker. 23–40°C in temperature and 17–39% mugginess. The selected locations A1–A10 were located between 0.5 and 1.75 kilometres from main streets, and in most cases, the adjacent streets were carpeted or cemented, while the streets outside the two destinations were clean, unpaved streets. Of the six locations shown, the dwellings’ areas vary greatly in an urban and semi-urban setting. The inside CO2 levels in the category-A testing locations were 558–754 ppm and 564–790 ppm with the entryway and windows closed, respectively.
The house size at the category-B testing locations was 211.4 m2, with floor sizes ranging from 52.35 m2 to 66.73 m2. There were no longer six or eight tenants living there, and two of them were occasional smokers. Ranges of temperature are 26–41°C and 19–37% muggy. The selected locations B1–B10 were situated within a 0.5–02 km radius of main streets, with neighbouring streets that were typically carpeted or cemented. The streets outside of these three locations were clean, unpaved streets. In an urban or semi-urban setting, the housing area changes with four destinations. The inside CO2 levels in the category-B inspection locations were 578–744 ppm and 641–781 ppm with the entryway and windows closed, respectively.
House estimates for category-C testing destinations ranged from 37.39 to 44.87 square meters, with a total floor area of 104.5 square meters. There were now six to nine tenants living there, two of whom were visit smokers. Ranges of temperature are 26–41°C and 17–41% muggy. The selected locations C1–C20 were situated within 0.5–02 kilometres of the majority of streets, with neighbouring streets that were typically carpeted or cemented, while the streets outside of the two locations were clean, unpaved streets. Six locations that are displayed in urban and semi-urban environments cause the dwellings’ area to change. The inside CO2 levels at category-C inspection sites were 687–796 ppm and 770–880 ppm with the entryway and windows closed, respectively.
|
Study case |
Size of house in m2 |
Number of occupants |
Town Location |
Distance from road in km |
|
A1- A10 |
418.1 |
8-12 |
Sabzazar, Iqbal town, Model town, Johar town, Gulberg, Wapda town, Valencia, Behria, Cantt, Gulshan ravi |
0.5-1.75 |
|
B1-B10 |
211.4 |
6-8 |
Muslim town, Iqbal town, sabzazar, Green town, Model town, Faisal town, Johar town, Township, Link road, Shadman |
0.5-2.0 |
|
C1-C20 |
104.5 |
6-9 |
Ichra, Samanabad, Yateem khana, Faisal town, Chouburgi, Sabzazar, Islam pura, Muslim town, Iqbal town, Samanabad, Green town, Township, Chouburgi, Mauzang, ShapurKanjraan, Badami bagh, Mughalpura, Railway station, U E T, Shadara |
0.5-2.0 |
|
D1-D10 |
62.7 |
3-7 |
Anarkali, Baghbanpura, Mughalpura, Shalimar town, Shah Alam, Akbari, Gawal mandi, Shahi mohallah, Data darbar, Badami bagh |
0.5-2.0 |
Table 2: Carbon dioxide monitoring open and close (doors and windows).
|
Study case |
House size in m2 |
Room size in m2 |
Door size in m2 |
Win-dow size in m2 |
Tempe-rature °C |
Hu-midity % |
CO2 Conc open door and window |
Four times increase on CO2 spray |
Time Taken in minutes |
CO2 Conc closed door and window |
Four times increase on CO2 spray |
Time taken in min-utes |
|
A1 |
418.1 |
87.16 |
2.61 |
2.31 |
31 |
37 |
752 |
3920 |
12 |
790 |
3682 |
42 |
|
A2 |
418.1 |
76.26 |
2.22 |
2.78 |
31 |
27 |
754 |
3013 |
12 |
775 |
3731 |
45 |
|
A3 |
418.1 |
87.16 |
1.93 |
2.31 |
31 |
30 |
650 |
2585 |
20 |
649 |
2041 |
39 |
|
A4 |
418.1 |
76.26 |
2.22 |
1.85 |
28 |
39 |
602 |
3040 |
22 |
564 |
2302 |
37 |
|
A5 |
418.1 |
87.16 |
2.27 |
3.34 |
34 |
22 |
558 |
2713 |
19 |
690 |
2915 |
41 |
|
A6 |
418.1 |
87.16 |
2.22 |
2.31 |
39 |
21 |
719 |
3183 |
9 |
790 |
3627 |
36 |
|
A7 |
418.1 |
87.16 |
2.08 |
2.78 |
40 |
17 |
592 |
2301 |
16 |
612 |
2501 |
36 |
|
A8 |
418.1 |
87.16 |
1.93 |
2.78 |
30 |
21 |
603 |
2617 |
12 |
670 |
2636 |
36 |
|
A9 |
418.1 |
76.26 |
2.22 |
3.34 |
39 |
19 |
584 |
2510 |
18 |
608 |
2526 |
41 |
|
A10 |
418.1 |
87.16 |
2.61 |
2.31 |
23 |
25 |
560 |
2140 |
19 |
630 |
2501 |
39 |
|
B1 |
211.4 |
52.35 |
1.93 |
1.11 |
35 |
36 |
741 |
3009 |
23 |
781 |
3138 |
29 |
|
B2 |
211.4 |
52.35 |
1.93 |
1.48 |
32 |
29 |
744 |
2976 |
11 |
771 |
3130 |
31 |
|
B3 |
211.4 |
57.19 |
1.93 |
1.85 |
34 |
37 |
676 |
2705 |
15 |
699 |
2541 |
28 |
|
B4 |
211.4 |
61.88 |
1.93 |
1.85 |
29 |
41 |
602 |
2408 |
16 |
660 |
2650 |
23 |
|
B5 |
211.4 |
57.19 |
1.93 |
1.48 |
33 |
20 |
578 |
2307 |
14 |
670 |
2715 |
31 |
|
B6 |
211.4 |
66.73 |
1.93 |
1.48 |
37 |
19 |
710 |
2872 |
16 |
780 |
3272 |
30 |
|
B7 |
211.4 |
61.08 |
1.93 |
1.85 |
41 |
19 |
692 |
2008 |
17 |
712 |
2802 |
28 |
|
B8 |
211.4 |
66.73 |
1.93 |
2.31 |
38 |
21 |
636 |
2610 |
17 |
693 |
2835 |
36 |
|
B9 |
211.4 |
52.35 |
1.93 |
2.31 |
38 |
22 |
684 |
2736 |
20 |
708 |
2860 |
35 |
|
B10 |
211.4 |
61.08 |
1.93 |
1.85 |
26 |
27 |
590 |
2360 |
19 |
641 |
2631 |
29 |
|
C1 |
104.5 |
44.87 |
1.66 |
1.48 |
31 |
37 |
790 |
3260 |
22 |
880 |
3550 |
32 |
|
C2 |
104.5 |
37.39 |
1.66 |
0.82 |
31 |
27 |
724 |
2906 |
23 |
825 |
3391 |
35 |
|
C3 |
104.5 |
41.07 |
1.95 |
0.82 |
31 |
30 |
776 |
3201 |
24 |
839 |
3350 |
36 |
|
C4 |
104.5 |
44.87 |
1.95 |
1.11 |
28 |
39 |
793 |
3200 |
21 |
864 |
3501 |
31 |
|
C5 |
104.5 |
41.07 |
1.95 |
1.48 |
34 |
22 |
780 |
3208 |
20 |
790 |
3200 |
41 |
|
C6 |
104.5 |
44.87 |
1.66 |
1.11 |
39 |
21 |
687 |
2744 |
25 |
812 |
3231 |
31 |
|
C7 |
104.5 |
44.87 |
1.66 |
2.31 |
40 |
17 |
732 |
2928 |
19 |
792 |
3180 |
33 |
|
C8 |
104.5 |
37.39 |
1.95 |
1.48 |
30 |
21 |
767 |
3050 |
21 |
770 |
3095 |
36 |
|
C9 |
104.5 |
41.07 |
1.66 |
1.48 |
39 |
19 |
784 |
3226 |
22 |
809 |
3327 |
41 |
|
C10 |
104.5 |
37.39 |
1.95 |
0.82 |
23 |
25 |
794 |
3190 |
23 |
830 |
3355 |
33 |
|
C11 |
104.5 |
44.87 |
1.66 |
0.82 |
35 |
36 |
760 |
3040 |
24 |
791 |
3184 |
29 |
|
C12 |
104.5 |
44.87 |
1.95 |
1.48 |
32 |
29 |
759 |
3050 |
21 |
799 |
3199 |
31 |
|
C13 |
104.5 |
41.07 |
1.66 |
0.82 |
34 |
37 |
703 |
2817 |
22 |
809 |
3210 |
28 |
|
C14 |
104.5 |
44.87 |
1.95 |
1.48 |
29 |
41 |
792 |
3201 |
19 |
866 |
3521 |
23 |
|
C15 |
104.5 |
37.39 |
1.95 |
1.48 |
33 |
20 |
766 |
3010 |
22 |
834 |
3350 |
31 |
|
C16 |
104.5 |
41.07 |
1.95 |
1.48 |
37 |
19 |
796 |
3199 |
12 |
798 |
3202 |
30 |
|
C17 |
104.5 |
37.39 |
1.95 |
1.48 |
41 |
19 |
788 |
3155 |
20 |
812 |
3220 |
28 |
|
C18 |
104.5 |
41.07 |
1.95 |
1.48 |
38 |
21 |
689 |
2809 |
17 |
873 |
3541 |
36 |
|
C19 |
104.5 |
44.87 |
1.95 |
1.48 |
38 |
22 |
767 |
3099 |
15 |
861 |
3494 |
35 |
|
C20 |
104.5 |
44.87 |
1.95 |
1.48 |
26 |
27 |
796 |
3211 |
18 |
842 |
3364 |
30 |
|
D1 |
62.7 |
28.37 |
1.66 |
-- |
31 |
37 |
819 |
3283 |
29 |
890 |
3588 |
51 |
|
D2 |
62.7 |
28.37 |
1.66 |
-- |
31 |
37 |
854 |
3420 |
27 |
855 |
3510 |
56 |
|
D3 |
62.7 |
22.69 |
1.66 |
0.55 |
31 |
27 |
892 |
3613 |
26 |
839 |
3350 |
48 |
|
D4 |
62.7 |
25.48 |
1.66 |
0.82 |
31 |
30 |
850 |
3435 |
25 |
874 |
3530 |
49 |
|
D5 |
62.7 |
28.37 |
1.66 |
-- |
28 |
39 |
880 |
3540 |
28 |
897 |
3580 |
57 |
|
D6 |
62.7 |
28.37 |
1.66 |
0.55 |
34 |
22 |
858 |
3413 |
23 |
891 |
3544 |
47 |
|
D7 |
62.7 |
25.48 |
1.66 |
0.55 |
39 |
21 |
839 |
3353 |
24 |
884 |
3489 |
46 |
|
D8 |
62.7 |
22.69 |
1.66 |
-- |
40 |
17 |
872 |
3482 |
27 |
879 |
3478 |
58 |
|
D9 |
62.7 |
28.37 |
1.66 |
0.55 |
30 |
21 |
864 |
30351 |
26 |
908 |
3602 |
46 |
|
D10 |
62.7 |
22.69 |
1.66 |
-- |
39 |
19 |
850 |
3505 |
28 |
930 |
3710 |
60 |
The house size in the category-D testing locations was 62.7 m2, with floor areas ranging from 22.69 m2 to 28.37 m2. There were now three to seven people living there, two of whom were smokers on visits. Ranges for temperature are 28–40°C and 17–39% mugginess. The selected locations D1–D10 were discovered within a 0.5 km radius of basic streets, which were typically carpeted or cemented, while the streets outside of the three destinations were clean, unpaved streets. The area of the homes shifts with three destinations show in urban and semi-urban environment. Tables 1 and 2 gives with n diagram of each of the examining locales. Inspecting destinations of category-D had indoor level of CO2 is 819-892 ppm and 839-930 ppm with open and closed (entryway and windows) separately.
Talk about the exchange rate (ACH) The ventilation rates (L/sec) and (L/s/person) of the most extreme and least (open and closed windows and doors) were measured. Maximum ACH 4.4-7.2, ventilation rate (L/sec) 108.63-153.05, and ventilation rate (L/s/person) 325.89-306.11 are the observed values for the selected destinations A1-A10. Ventilation rate (L/sec) 35.78-73.94, minimum ACH 1.6-3.0, and ventilation rate (L/s/person) 143.13-295.76. Maximum ACH 1.7-4.7, ventilation rate (L/sec) 29.95-68.68, and ventilation rate (L/s/person) 119.82-206.06 are the observed values for the selected destinations B1-B10. Ventilation rate (L/sec) 29.03-41.32, minimum ACH 1.6-2.6, and ventilation rate (L/s/person) 116.14-123.0. Max ACH 2.7-12.5, ventilation rate (L/sec) 34.78-143.63, and ventilation rate (L/s/person) 139.14-430.90 are the values obtained for the selected destinations C1-C20 that were examined. Ventilation rate (L/sec) 20.37-54.59, minimum ACH 1.7-5.2, and ventilation rate (L/s/person) 81.48-163.48. The maximum ACH 3.1-79.1, the minimum ACH 2.2-5.3, the maximum ventilation rate (L/sec) 14.18-38.03, and the maximum ventilation rate (L/s/person) 70.92-15214 are the ventilation rates for the selected localities D1-D10 that were verified (Table 3). Of all these gas levels that were associated, more than 70% of the dwellings had CO2 levels that were higher than the recommended amount (ppm).
Carbon dioxide concentration and discuss alter rate appeared negative pearson relationship (Table 4). One way ANOVA appeared noteworthiness of Max and Min ACH (0.007 and 0.079).
Discussion
CO2 could be a natural constituent of the environment. Its degree within the encompassing discuss is as a rule 380ppm or more noteworthy based on the nearby circumstances like vehicular thickness, combustion sources including mechanical, climatic conditions, wind
Table 3: Comparison between maximum and minimum ventilation rate.
|
Case No. |
Maximum ventilation with open doors and windows |
Minimum ventilation with closed doors and windows |
|||||||
|
CO2 concen-tration |
Persons in a room |
ACH |
Venti-lation rate (L/sec) |
Ventilation rate (L/s/ person) |
CO2 concen-tration |
ACH |
Ventilation rate (L/sec) |
Ventilation rate (L/s/person) |
|
|
A1 |
465 |
3 |
4.8 |
116.97 |
350.92 |
522 |
2.7 |
67.15 |
201.46 |
|
A2 |
470 |
2 |
7.2 |
153.05 |
306.11 |
511 |
2.6 |
56.86 |
113.72 |
|
A3 |
449 |
3 |
5.8 |
142.12 |
426.38 |
493 |
2.3 |
57.41 |
172.24 |
|
A4 |
446 |
4 |
5.3 |
112.70 |
450.83 |
488 |
1.6 |
35.78 |
143.13 |
|
A5 |
429 |
3 |
4.4 |
108.63 |
325.89 |
486 |
2.0 |
49.12 |
147.38 |
|
A6 |
469 |
3 |
5.3 |
130.25 |
390.76 |
599 |
2.1 |
53.23 |
159.70 |
|
A7 |
499 |
4 |
5.1 |
123.51 |
494.07 |
513 |
3.0 |
73.94 |
295.76 |
|
A8 |
439 |
4 |
5.2 |
127.29 |
509.17 |
473 |
2.2 |
53.97 |
215.91 |
|
A9 |
433 |
4 |
5.6 |
120.53 |
482.14 |
476 |
2.7 |
57.67 |
230.71 |
|
A10 |
430 |
3 |
4.9 |
120.26 |
360.80 |
501 |
1.9 |
47.43 |
142.31 |
|
B1 |
590 |
2 |
4.3 |
63.47 |
126.95 |
671 |
2.4 |
35.29 |
70.59 |
|
B2 |
685 |
3 |
4.7 |
68.68 |
206.06 |
773 |
2.6 |
39.04 |
117.12 |
|
B3 |
836 |
3 |
2.1 |
33.78 |
101.35 |
896 |
1.8 |
29.96 |
89.89 |
|
B4 |
892 |
4 |
1.7 |
29.95 |
119.82 |
913 |
1.6 |
29.03 |
116.14 |
|
B5 |
595 |
3 |
3.9 |
63.02 |
189.08 |
702 |
2.6 |
41.32 |
123.96 |
|
B6 |
578 |
2 |
3.1 |
58.36 |
116.73 |
690 |
1.7 |
32.63 |
65.26 |
|
B7 |
701 |
2 |
2.3 |
39.52 |
79.058 |
799 |
1.7 |
29.55 |
59.10 |
|
B8 |
760 |
2 |
3.3 |
62.14 |
124.29 |
865 |
2.3 |
43.57 |
87.15 |
|
B9 |
684 |
3 |
4.1 |
60.36 |
181.08 |
728 |
2.4 |
36.10 |
108.30 |
|
B10 |
839 |
2 |
3.9 |
66.77 |
133.54 |
929 |
2.2 |
38.40 |
76.81 |
|
C1 |
669 |
2 |
3.2 |
40.22 |
80.45 |
982 |
2.1 |
26.59 |
53.18 |
|
C2 |
584 |
3 |
6.6 |
69.26 |
207.80 |
691 |
5.2 |
54.49 |
163.48 |
|
C3 |
601 |
3 |
3.4 |
39.20 |
117.60 |
712 |
2.8 |
32.56 |
97.70 |
|
C4 |
581 |
2 |
3.1 |
39.68 |
79.36 |
650 |
2.4 |
30.81 |
61.62 |
|
C5 |
819 |
2 |
5.1 |
59.16 |
118.32 |
923 |
2.6 |
30.02 |
60.05 |
|
C6 |
758 |
2 |
3.3 |
42.23 |
84.47 |
833 |
2.2 |
27.78 |
55.56 |
|
C7 |
709 |
2 |
3.7 |
46.16 |
92.32 |
781 |
2.5 |
31.94 |
63.89 |
|
C8 |
901 |
3 |
3.2 |
34.26 |
102.79 |
944 |
2.4 |
25.62 |
76.87 |
|
C9 |
834 |
3 |
5.0 |
57.20 |
171.60 |
913 |
2.8 |
32.24 |
96.74 |
|
C10 |
792 |
4 |
4.1 |
42.77 |
171.08 |
866 |
3.0 |
31.30 |
125.20 |
|
C11 |
752 |
4 |
2.7 |
34.78 |
139.14 |
790 |
3.9 |
49.70 |
198.82 |
|
C12 |
754 |
4 |
4.3 |
54.13 |
216.53 |
775 |
1.7 |
22.34 |
89.37 |
|
C13 |
650 |
4 |
3.6 |
42.00 |
168.01 |
649 |
1.7 |
20.37 |
81.48 |
|
C14 |
602 |
4 |
5.0 |
63.27 |
253.10 |
564 |
2.2 |
28.48 |
113.92 |
|
C15 |
558 |
4 |
6.2 |
65.36 |
261.47 |
690 |
2.3 |
24.05 |
96.21 |
|
C16 |
719 |
3 |
12.5 |
143.63 |
430.90 |
790 |
2.4 |
27.42 |
82.28 |
|
C17 |
592 |
2 |
4.5 |
47.763 |
95.52 |
612 |
2.5 |
26.04 |
52.09 |
|
C18 |
603 |
4 |
7.0 |
80.65 |
322.62 |
670 |
1.9 |
21.94 |
87.77 |
|
C19 |
584 |
4 |
5.6 |
70.27 |
281.10 |
608 |
2.4 |
30.39 |
121.56 |
|
C20 |
560 |
4 |
4.9 |
61.08 |
244.34 |
630 |
3.2 |
40.39 |
161.57 |
|
D1 |
741 |
3 |
3.1 |
25.14 |
75.44 |
781 |
4.1 |
32.40 |
97.22 |
|
D2 |
744 |
4 |
9.1 |
72.16 |
288.64 |
771 |
2.5 |
19.83 |
79.32 |
|
D3 |
676 |
3 |
5.4 |
34.04 |
102.14 |
699 |
3.1 |
19.92 |
59.78 |
|
D4 |
602 |
4 |
5.8 |
41.09 |
164.39 |
660 |
5.3 |
38.03 |
152.14 |
|
D5 |
578 |
4 |
7.2 |
56.96 |
227.86 |
670 |
2.6 |
21.26 |
85.07 |
|
D6 |
710 |
4 |
5.8 |
45.74 |
182.98 |
780 |
3.3 |
26.51 |
106.05 |
|
D7 |
692 |
4 |
4.3 |
31.00 |
124.03 |
712 |
3.0 |
21.33 |
85.33 |
|
D8 |
636 |
5 |
5.3 |
33.90 |
169.52 |
693 |
2.2 |
14.18 |
70.92 |
|
D9 |
684 |
5 |
4.6 |
36.88 |
184.41 |
708 |
2.5 |
19.76 |
98.83 |
|
D10 |
590 |
4 |
5.0 |
31.90 |
127.62 |
641 |
3.3 |
20.84 |
83.38 |
|
Correlations |
Max CO2 concentration |
ACH |
Ventilation rate |
Ventilationrate (L/s/person) |
|
|
Max CO2 concentration |
Pearson correlation |
1 |
-0.499** |
-0.744** |
-0.738** |
|
Sig. (2-tailed) |
|
0 |
0 |
0 |
|
|
N |
50 |
50 |
50 |
50 |
|
|
ACH |
Pearson correlation |
-0.499** |
1 |
.487** |
0.548** |
|
Sig. (2-tailed) |
0 |
|
0 |
0 |
|
|
N |
50 |
50 |
50 |
50 |
|
|
Ventilation rate |
Pearson correlation |
-0.744** |
0.487** |
1 |
0.883** |
|
Sig. (2-tailed) |
0 |
0 |
|
0 |
|
|
N |
50 |
50 |
50 |
50 |
|
|
Ventilationrate (L/s/person) |
Pearson correlation |
-0.738** |
0.548** |
.883** |
1 |
|
Sig. (2-tailed) |
0 |
0 |
0 |
|
|
|
N |
50 |
50 |
50 |
50 |
|
**, correlation is significant at the 0.01 level (2-tailed).
development and temperature (Butler et al., 2012). Indoor CO2 level for category-A was 558-754ppm, category-B was 578-744ppm, category-C was 687-796ppm, category-D was 819-892ppm with 8-12, 6-8, 6-9 and 3-7occupants individually. An exalted indoor CO2 concentration is connected with check of tenants within the room (Kukee and Dovjak, 2014), ventilation rate and CO2 level within the surrounding discuss of room. When ventilation is insufficient to remove or reduce the amount of CO2 that room occupants consistently produce, indoor CO2 levels can build up (ASHRAE, 2012). The upper limit of acceptable CO2 concentrations is between 250 and 350 ppm, while the present monitoring levels are between 558 and 892 ppm for open windows and doors and between 564 and 930 ppm for closed windows and doors. ASHRAE (2012) ventilation guidelines make it very evident that the indoor CO2 concentration cannot be higher than 650 ppm above the ambient concentration. People who live in areas with higher CO2 concentrations may be executed if they become fatigued and inactive (Satish et al., 2012). Concurring to WHO (World Wellbeing Organization), sufficient ventilation is essential for dodging airborne diseases and it is highly recommendable to maintain a strategic distance from spread of TB and asthma (WHO, 2009). The encompassing discuss quality depends upon the concentrations of vaporous contaminants and its ventilation framework to debase these gasses. It is found essential to check surrounding discuss quality (IAQ) for tenant aspiratory wellbeing and consolation (ASHRAE, 2012). In display consider, category A, B, C, D have max ACH 4.4-7.2, 1.7-4.7, 2.7-12.5 and 3.1-79.1 separately. Prove appeared that diminished ventilation rates are related with high disease rates though; tall ventilation rate can diminish airborne contamination rates by bringing down the concentration of bead cores by decreasing the hazard of inhaled infections (WHO, 2009; NVPAC, 2007). The breathing of tenants is the main source of indoor CO2. CO2 for the most part ranges from 350-2500ppm (Satish et al., 2012).
For the most part indoor CO2 rise up is expected to be a surrogate pointer for other inhabitants, particularly bio effluents and for ventilation rate per inhabitant. The limit run of CO2 is 5000 ppm for eight hours weighted normal exposures (Akkas et al., 2015). ASHRAE (2012) recommended 10 Ls-1 per individual most reduced ventilation rate for workplaces, to a nearly steady circumstance of indoor concentration of 870ppm (ASHRAE, 2012), based on supposition that open air CO2 are 350ppm and generation rate is 0.31 L/min- individual (Apte et al., 2000).
CO2 levels in inside are utilized to get to IAQ and the ventilation rate. The CO2 concentration in a living space appears in case the building’s ACH adjust is satisfactory. CO2 is produced when individuals breathe out and each breathed out breath have 35,000 to 50,000ppm of CO2 and on normal is around 100 times more prominent than is regularly found in encompassing discuss. Greatest admissible CO2 level in a mechanical working environment is 5,000ppm. Surrounding CO2 levels are generally about 380- 500ppm. Indoor CO2 levels ought to not surpass by more than 650ppm (ASHRAE, 2012). Analysts conducted by the US-EPA approximately human presentation to toxins delineated that levels of most toxins are two to five times more noteworthy than surrounding levels. These levels of indoor discuss poisons are of uncommon connection since it is concluded that most individuals particularly children spend 90% of their time inside (Bronsema et al., 2004). A parcel of connection was suggested among indoor CO2 concentration and IAQ and unfavorable wellbeing results of improved CO2, IAQ, CO2 concentration and surrounding discuss (ASHRAE, 2012; Hoskins, 2003). Carbon Dioxide concentration could be exceptionally vital parameter for analyzing indoor discuss quality and efficient ventilation (Godish, 2000).
Although typical ventilation isn’t expensive, it has the drawback of requiring windows and doors to be opened, which isn’t possible because of temperature restrictions, precipitation patterns, safety concerns, and security concerns. There are two possible methods to screen ventilation rate: first, using space volume (i.e., talking about alter per hour or ACH) instead of the total number of occupants in the living area (i.e., liters/second/person). Approximations based on occupancy emphasise the fact that every person in the designated area needs a specific amount of fresh information (WHO, 2007).
DOSH (2005) detailed IAQ provided discuss and ventilation estimation were diverse in ancient and modern buildings. In ancient buildings moo IAQ was recorded (18.60cfm/person) compared in comparison to least (20cfm/person) prescribed ASHRAE Standard-62 (Common Ventilation). Indoor environment recorded lower IAQ level of ASHRAE Standard-62 prescribed may deliver certain warm inconvenience like eye bothering, cerebral pains and discombobulation on delayed presentation. Irtishad (2001) detailed the convenience of discuss dealing with unit (HVAC framework), its upkeep, cleaning handle and time by time review can way better the ventilation and advancement of IAQ. By and large, CDC suggests ventilation in a wellbeing care office must be in between 6-12 air changes per hour (ACH). This is equal to 80 l/s/person for a room of 24m3. Rooms for asthmatics and irresistible TB patients, at slightest 12 ACH are emphatically prescribed (WHO, 2009; CDC, 2005). Though, in our consider Category A, B, C, D have Max ACH 4.4-7.2, 1.7-4.7, 2.7-12.5 and 3.1-79.1 individually which were underneath the prescribed levels. Apte et al. (2000) and Erdman et al. (2002) considered affiliations of SBS (debilitated building disorder symptoms) and indoor-outdoor CO2 concentration deviation as surrogates for per individual ventilation rates. The highest indoor and outdoor CO2 concentrations in our study are 418 and 716 ppm, respectively. Tenant stack patterns were recorded and related to building utilization (Wong and Mui, 2006). Control of IAQ and the vitality related were appeared to be inhabitant stack design related (Mui et al., 2007; Wong et al., 2008). In regularly particular Hong Kong workplaces, inhabitance ranges are nearly steady around working hours but for a drop at lunch-time. In actuality, all IAQ measures must take into account the viability of ventilation rate, commencement rate, vacillation, and weakening of indoor CO2 concentration, as these factors contribute to the amounts’ weaknesses (Hui et al., 2008).
In our study most of the buildings were old and similar results were watched by (Kukee and Dovjak, 2014), expressed that the SBS may happen due to unseemly ventilation and more noteworthy levels of temperature and stickiness and temperature. Clear affiliation in between upgraded of indoor CO2 levels increments in certain SBS indications (Norhidayah et al., 2013). Greatest decreases in indication prevalence are generally up to 70-85% related with CO2 concentration. The lessening of CO2 may come by massive increase in ventilation rates, viability in providing new discuss of breathing zone of tenants (Syazwan et al., 2009). A high level of CO2 in a particular area of the living room may be caused by an improper and limited sum of fresh discuss admissions (Wagocki et al., 2005). The ventilation rates (L/sec) at the selected destinations A1–A10 observed are 108.63–153.05 and 325.89–306.11, respectively. The ventilation rates (L/sec) in the selected sites B1–B10 that were examined are 29.95–68.68 and 119.82–206.06. The selected destinations C1–C20 that were evaluated had ventilation rates ranging from 34.78–143.63 (L/sec) and 139.14–430.90 (L/s/person). Insufficiency of indoor discuss quality can increment long term and brief term wellbeing results (Norback et al., 2000; Simoni et al., 2006; Tillet, 2010; Simoni et al., 2010) that affect execution (Gilliland et al., 2001; Shaughnessy et al., 2006; Mohai et al., 2011) and bring positive alter in wellbeing disintegration (Lohbeck, 2008). The outcomes of this ponder portray a solid affiliation in between higher indoor CO2 levels and individual increment in SBS indications. Examinations conducted utilizing normal and greatest indoor CO2 had comparable discoveries. These discoveries are clear in relapse models and were confirmed through alteration for a number of potential perplex (Apte et al., 2000).
The basic source of CO2 in any house is respiration of the individuals living in it (Zhang et al., 2017). The concentrations in most indoor situations like CO2 buildup is thought to be a pointer of toxins created by tenants, particularly bio effluents and per inhabitant ventilation rate (Bonfiglioli et al., 2013). In spite of the more regrettable conditions of the indoor situations especially in urban ranges, arrangement producers are still insensible of the dangers to which lion’s share of the populace is uncovered. It could be a much-needed step to recognize indoor discuss contamination at approach level so that moderation measures can be started.
Conclusions and Recommendations
The levels of CO2 as a gaseous poison display within the houses were more noteworthy than typical and this may be respected as a potential health danger to the asthmatic patients at large. It can be hurtful to all tenants of these houses in specific. Few preparatory measures are required to escort securely individuals at hazard. These comes about propose that extra ventilation rates per individual among commonplace house will on normal significantly diminish the prevalence of numerous side effects up to 80%.
Acknowledgement
Author is grateful to the Environmental Health and Wild Life Lab, Department of Zoology, the University of the Punjab, Lahore for providing me the platform to complete my research work.
Conflict of interest
The authors have declared no conflict of interest.
References
Akkas, O., David, P., Azari, C.C., Yu, H.H., Sheryl, S., Ulin, T.J., Armstrong, D.R. and Robert, G.R., 2015. A hand speed–duty cycle equation for estimating the ACGIH hand activity level rating. Ergonomics, pp. 184-194. https://doi.org/10.1080/00140139.2014.966155
Alam, M.S. and Hussein, A., 2012. Size effect on shear strength of FRP reinforced concrete beams without stirrups. J. Composit. Constr., 17: 507-516. https://doi.org/10.1061/(ASCE)CC.1943-5614.0000346
American Society of Heating, Refrigerating, and Air Conditioning Engineers, ASHRAE Standard 62.2.2012: Ventilation for Acceptable Indoor Air Quality, Atlanta, GA.
Apte, M.G., Fisk, W.J. and Daisey, J.M., 2000. Associations between indoor Co2 concentrations and sick building syndrome symptoms in us office buildings: An analysis of the 1994-1996 base study data. Indoor Air, 10: 246-257. https://doi.org/10.1034/j.1600-0668.2000.010004246.x
Atkinson, R.W., Anderson, H.R. and Sunyer, J., 2001. Acute effects of particulate air pollution on respiratory admissions, Results from APHEA 2 project. Am. J. Respir. Crit. Care Med., 164: 1860-1836. https://doi.org/10.1164/ajrccm.164.10.2010138
Bonfiglioli, R., Mattioli, S., Armstrong, T.J., Graziosi, F., Marinelli, F., Farioli, A. and Violante, F.S., 2013. Validation of the ACGIH TLV for hand activity level in the OCTOPUS cohort: A two-year longitudinal study of carpal tunnel syndrome. Scand. J. Work Environ. Hlth., pp. 155-163. https://doi.org/10.5271/sjweh.3312
Bronsema, B., Bjorck, M., Carrer, P., Clausen, G., Fitzner, K., Flatheim, G., Follin, T., Haverinen, U., Jamriska, M., Kurnitski, J., Maroni, M., Mathisen, M.H., Morawska, L, Muller, B., Nathanson, T., Nevalainen, A., Olesen, A. W., Pasanen, P., Seppanen, O., Sateri, J. and Witterseh, T., 2004. Performance criteria of buildings for health and comfort. CIB Number 292.
Butler, J.P., Loring, S.H., Patz, S., Tsuda, A., Yablonskiy, D.A. and Mentzer, S.J., 2012. Evidence for adult lung growth in humans. Engl. J. Med., 367: 244-247. https://doi.org/10.1056/NEJMoa1203983
Centers For Disease Control and Prevention, 2005. Guidelines for preventing the transmission of Mycobacterium tuberculosis in health-care settings. Centers Dis. Contr. Prevent. MMWR Recommend. Rep., 54: 1-141.
De Giuli, V., Da Pos, O., and De Carli, M., 2012. Indoor environmental quality and pupil perception in Italian primary schools. Build. Environ., 56: 335-345. https://doi.org/10.1016/j.buildenv.2012.03.024
Department of Occupational Safety and Health (DOSH). 2005. Ministry of Human Resources, Malaysia. Code Prac. Indoor Air Qual.,
Desa, U.N., 2012. World urbanization prospects: The 2011 revision. United Nations, Department of Economic and Social Affairs. Population Division, New York.
Dominici, F., Peng, R.D. and Bell, M.L., 2006. Fine particulate air pollution and hospital admissions for cardiovascular and respiratory diseases. J. Am. Med. Assoc., 295: 1127-1134. https://doi.org/10.1001/jama.295.10.1127
Dong, B. and Lam, K.P., 2014. A real-time model predictive control for building heating and cooling systems based on the occupancy behavior pattern detection and local weather forecasting. In: Building Simulation. Springer Berlin Heidelberg. 7: 89-106. https://doi.org/10.1007/s12273-013-0142-7
Erdmann, C.A., Steiner, K.C. and Apte, M.G., 2002. Indoor carbon dioxide concentrations and sick building syndrome symptoms in the base study revisited: Analyses of the 100 building dataset. Proceedings of 9th international conference on indoor air quality and climate- Indoor Air 2002. Monterey. Indoor Air, 3: 443-448.
Farhat, K., Waseem, L.A., Khan, A.A. and Baig, S., 2018. Spatiotemporal demographic trends and land use dynamics of metropolitan Lahore. J. Hist. Cult. Art Res., 7: 92-102. https://doi.org/10.7596/taksad.v7i5.1774
Fiorentini, M., Cooper, P. and Ma, Z., 2015. Development and optimization of an innovative HVAC system with integrated PVT and PCM thermal storage for a net-zero energy retrofitted house. Energy Build., 94: 21-32. https://doi.org/10.1016/j.enbuild.2015.02.018
Fischer-Mackey, J., 2013. How to measure natural ventilation in resource-limited settings using Carbon Dioxide (CO2). The global health delivery Project, GHDonline.org. Accessed in March.
Galan, I., Tobias, A. and Banegas, J.R., 2003. Short-term effects of air pollution on daily asthma emergency room admissions. Eur. Respir. J., 22: 802-808. https://doi.org/10.1183/09031936.03.00013003
Gilliland, F.D., Berhane, K., Rappaport, E.B., Thomas, A.C., Avol, E., Gauderman, W.J., London, S.J., Margolis, H.G., Mcconnell, R., Islam, K.T. and Peters, J.M., 2001. The effects of ambient air pollution on school absenteeism due to respiratory illnesses. Epidemiology, 12: 43-54. https://doi.org/10.1097/00001648-200101000-00009
Godish, T., 2000. Indoor environmental quality. Ventilation. Appleton Lange. pp. 333.339.
Goyal, R. and Khare, M., 2011. Indoor air quality modeling for PM10, PM2.5, and PM1.0 in naturally ventilated classrooms of an urban Indian school building. Environ. Monit. Assess., 176: 501-516. https://doi.org/10.1007/s10661-010-1600-7
Hoskins, J.A., 2003. Health effects due to indoor air pollution. Indoor Built. Environ., 12: 427-433. https://doi.org/10.1177/1420326X03037109
Hui, P.S., Wong, L.T. and Mui, K.W., 2007. An epistemic indoor air quality assessment protocol for air- conditioned offices. Indoor Built. Environ., 16: 139-149. https://doi.org/10.1177/1420326X07076503
Hui, P.S., Wong, L.T. Wong and Mui, K.W., 2008. Using carbon dioxide concentration to assess indoor air. Indoor Built. Environ., 17: 213-219. https://doi.org/10.1177/1420326X08091773
Irtishad, 2001. Effectiveness of HVAC duct cleaning procedures in improving indoor air quality. Environ. Monit. Assess., 72: 265-276.
Kukec, A. and Dovjak, M., 2014. Prevention and control of sick building syndrome (SBS). Part 1: Identification of risk factors. Int. J. Sanitary Eng., 8: 44-49.
Kulshreshtha, P. and Khare, M., 2011. Indoor exploratory analysis of gaseous pollutants and respirable particulate matter at residential homes of Delhi, India. Atmos Pollut. Res., 2: 337-350. https://doi.org/10.5094/APR.2011.038
Lohbeck, D., 2008. Design for dust. T & MW, pp. 47-52.
Mena and Larsen, 2010. Indoor environment in schools. Master, Technical University of Denmark.
Mohai, P., Kweon, B.S., Lee, S. and Ard, K., 2011. Air pollution around schools is linked to poorer student health and academic performance. Hlth. Aff., 30: 852-862. https://doi.org/10.1377/hlthaff.2011.0077
Mui, K.W., Wong, L.T. and Law, L.Y., 2007. An energy benchmarking model for ventilation systems of air-conditioned offices in sub-tropical climates. Appl. Energy, 84: 89-98. https://doi.org/10.1016/j.apenergy.2006.04.002
Natural Ventilation for the Prevention of Airborne Contagion, PLoS Med., 4(2): e68. https://doi.org/10.1371/journal.pmed.0040068
Norback, D., Walinder, R., Wieslander, G., Smedje, G., Erwall, C. and Venge, P., 2000. Indoor air pollutants in schools: nasal patency and biomarkers in nasal lavage. Allergy, 55: 163-170. https://doi.org/10.1034/j.1398-9995.2000.00353.x
Norhidayah, A., Chia-Kuang, L., Azhar, M.K. and Nurulwahida, S., 2013. Indoor air quality and sick building syndrome in three selected buildings. Proc. Eng., 53: 93-98. https://doi.org/10.1016/j.proeng.2013.02.014
Peel, J.L., Tolbert, P.E. and Klein, M., 2005. Ambient air pollution and respiratory emergency department visits. Epidemiology, 16: 164-173. https://doi.org/10.1097/01.ede.0000152905.42113.db
Rasheed, A., Aneja, V.P., Aiyyer, A. and Rafique, U., 2015. Measurement and analysis of fine particulate matter (PM2. 5) in urban areas of Pakistan. Aerosol Air Quality Res., 15(2): 426-439.
Samet, J.M., Zeger, S.L., Dominici, F., Curriero, F., Coursac, I., Dockery, D.W. and Zanobetti, A., 2000. The national morbidity, mortality, and air pollution study. Part II: Morbidity and mortality from air pollution in the United States. Res. Rep. Hlth. Eff. Inst., 94: 5-79.
Satish, U., Mendell, M.J. and Shekhar, K., 2012. Is CO2 an indoor pollutant? Direct effects of low to moderate co2 concentrations on human decision-making performance. Environ. Hlth. Perspect., 120: 1671-1705. https://doi.org/10.1289/ehp.1104789
Satsangi, P.G., Yadav, S., Pipal, A.S. and Kumbhar, N., 2014. Characteristics of trace metals in fine (PM2. 5) and inhalable (PM10) particles and its health risk assessment along with in-silico approach in indoor environment of India. Atmos Environ., 92: 384-393. https://doi.org/10.1016/j.atmosenv.2014.04.047
Shaughnessy, R.J. Haverinen-Shaughness, U., Nevalainen, A. and Moschandreas, D., 2006. A preliminary study of the association between ventilation rates in classrooms and student performance. Indoor Air, 16: 465-468. https://doi.org/10.1111/j.1600-0668.2006.00440.x
Sherbini, A.M.E. and Parigger, C.G., 2016. Wavelength dependency and threshold measurements for nanoparticle-enhanced laser-induced breakdown spectroscopy. Spectrochimica Acta Part B: Atomic Spectroscopy, 116: 8-15.
Simoni, M., Annesi-Maesano, I., Sigsgaard, T., Norback, D., Wieslander, G., Lystad, W., Canciani, M., Viegi, G. and Sestini, P., 2006. Relationships between school indoor environment and respiratory health in children of five European countries (HESE Study). Eur. Respir. J., 28: 837s.
Simoni, M., Annesi-Maesano, I., Sigsgaard, T., Norback, D., Wieslander, G., Nystad, W., Canciani, M., Sestini, P. and Viegi, G., 2010. School air quality related to dry cough, rhinitis and nasal patency in children. Eur. Respir. J., 35: 742-749. https://doi.org/10.1183/09031936.00016309
Syazwan Aizat, I., Juliana, J., Norhafizalina, O., Azman, Z.A. and Kamaruzaman, J., 2009. Indoor air quality and sick building syndrome in Malaysian buildings. Glob. J. Hlth. Sci., 1: 126-136. https://doi.org/10.5539/gjhs.v1n2p126
Tillet, T., 2010. Formaldehyde exposure among children: a potential building block of asthma. Environ. Hlth. Perspect., 118: 131-133. https://doi.org/10.1289/ehp.118-a131b
Tolbert, P.E., Klein, M., Peel, J.L., Sarnat, S.E. and Sarnat, J.A., 2007. Multi pollutant modeling issues in a study of ambient air quality and emergency department visits in Atlanta. J. Exposure Sci. Environ. Epidemiol., 17: 29. https://doi.org/10.1038/sj.jes.7500625
Wargocki, P., David-Wyon, P., Matysiak, B. and Irgens, S., 2005. The effects of classroom air temperature and outdoor air supply rate on the performance of school work by children. Proc. Indoor Air 1, 1: 368-72.
Wellenius, G.A., Burger, M.R., Coull, B.A., Schwartz, J., Suh, H.H., Koutrakis, P. and Mittleman, M.A., 2012. Ambient air pollution and the risk of acute ischemic stroke. Arch. Intern. Med., 172: 229-234. https://doi.org/10.1001/archinternmed.2011.732
WHO (World Health Organization), 2009. Natural ventilation for infection control in health care settings (Atkinson, James, ed.). pp. 18-19.
Wong, L.T. and Mui, K.W., 2006. Modeling transient occupant loads for offices. Architect Sci. Rev., 49: 53-58. https://doi.org/10.3763/asre.2006.4907
Wong, L.T., Mui, K.W. and Shi, K.L., 2008. Energy impact of indoor environmental policy for air- conditioned offices of Hong Kong. Energy Policy, 36: 714-721. https://doi.org/10.1016/j.enpol.2007.10.022
World Health Organization, 2009. Natural ventilation for infection control in health care settings, WHO, 2009, pp. 18-19.
Zhai, X.Q., Song, Z.P. and Wang, R.Z., 2011. A review for the applications of solar chimneys in buildings. Renew. Sustain. Energy Rev., 15: 3757-3767. https://doi.org/10.1016/j.rser.2011.07.013
Zhang, X., Wargocki, P., Lian, Z. and Thyregod, C., 2017. Effects of exposure to carbon dioxide and bioeffluents on perceived air quality, self-assessed acute health symptoms and cognitive performance. Indoor Air, 27: 47-64. https://doi.org/10.1111/ina.12284
Zhou, J. and Chen, Y., 2010. A review on applying ventilated double-skin facade to buildings in hot summer and cold winter zone in China. Renew. Sustain. Energy Rev., 14: 1321-1328. https://doi.org/10.1016/j.rser.2009.11.017
To share on other social networks, click on any share button. What are these?