

Transcriptome Analysis of Cattle Embryos Based on Single Cell RNA-Seq


Transcriptome Analysis of Cattle Embryos Based on Single Cell RNA-Seq
Jie Wang1, Di Fang1, Jianqing Zhao1, Fei Huang2, Bo Liu2, Weikun Tao2, Baoshan Cui2 and Qinghua Gao1,2,3*
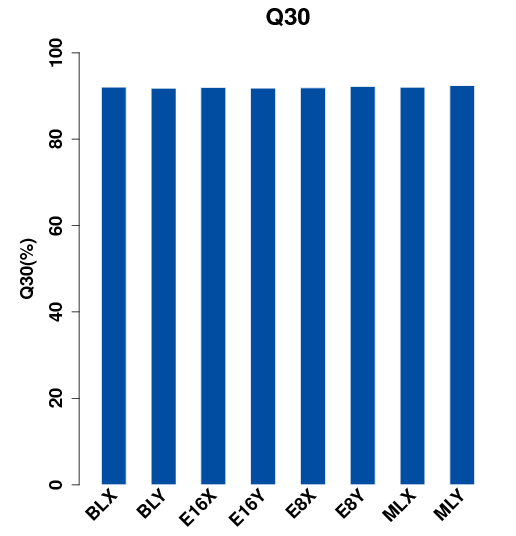
Base quality level of Q30 reactive sequencing. The proportion of the bases with sequencing quality value was greater than 30 (error rate less than 0.1%) in the total Raw Reads.

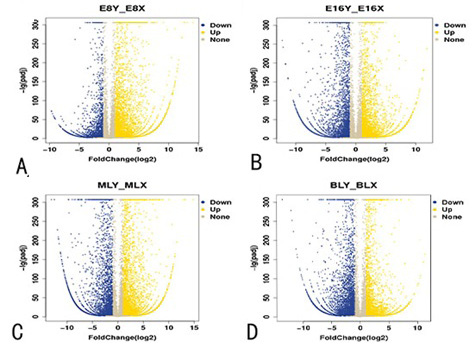
Volcano map showing differential expression genes (DEG) among female and male embryos in each period. The number of DEGs in XX and XY embryos; yellow represents upregulated genes, blue represents the downregulated genes, gray shows the difference that is not significant.

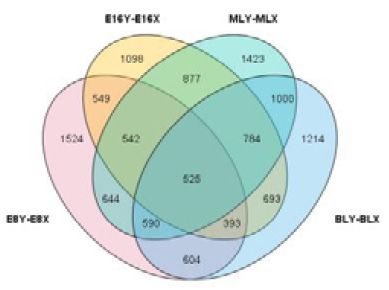
Venn diagram of the DEGs of the four comparison groups.

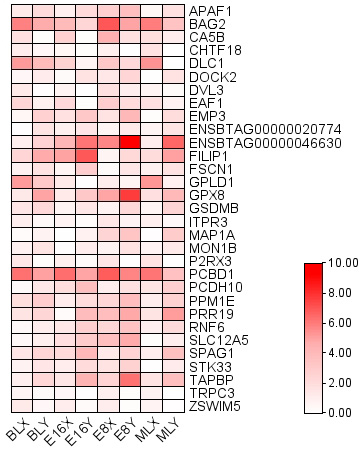
Heatmap shows the gene expression of XX and XY embryos at different periods.

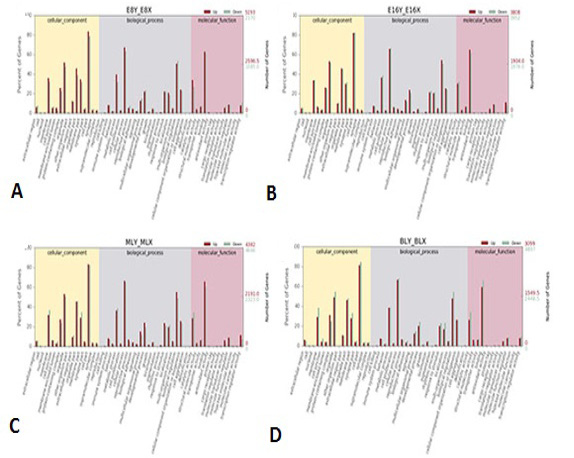
GO analysis of DEGs. GO enrichment analysis of DEGs in cattle embryos. (A) E8Y_vs_E8X; (B) E16Y_vs_E16X; (C) MLY_vs_MLX; (D) BLY_vs_BLX. The abscissa represents GO terms, the ordinate on the left represents the percentage of genes in all genes annotated with GO, right was the number of genes.

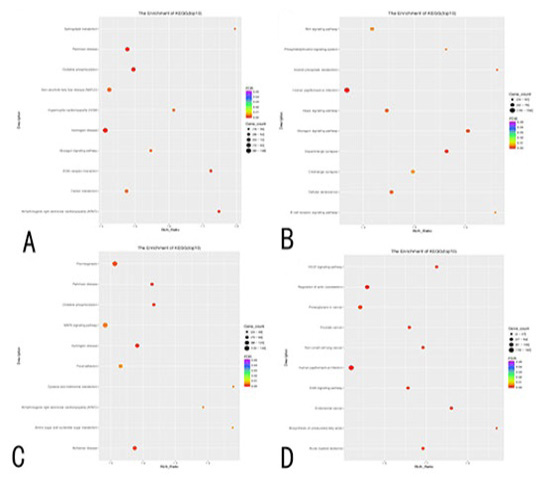
Histogram (Top 10) of KEGG enrichment values in four groups. Annotation of DEGs in KEGG. (A) E8Y_vs_E8X; (B) E16Y_vs_E16X; (C) MLY_vs_MLX; (D) BLY_vs_BLX. In the figure, the path case of the differential top10 is collected, and each circle represents a KEGG path whose name appears on the left legend. The transverse coordinate is the enrichment factor, showing the ratio of the DEGs in the pathway to all DEGs in all pathways to the ratio of genes in the pathway to all genes in all pathways. The larger the enrichment factor, the more important the path is. The color of the circle represents the q value, the adjusted p-value by multiple hypothesis tests; the smaller the q value, the more important the path. The size of the circle represents the number of genes expressed with the differences annotated by the pathway; the larger the circle, the greater the number of genes.


