The Effectiveness of Immunostimulants on NDV Genotype VII and IBDV Infection in Broiler Chickens
Hagar Magdy Ahmed1, Mohamed Mahrous Amer2*, Khaled Mohamed El-Bayoumi1, Ahmed Ali El-Shemy3, Mohamed Abd El-Rahman Bosila1, Gomaa Abd El-Rhim Abdel Alim2
1Department of Poultry Diseases, Veterinary Research Institute, National Research Centre, P.O. Code 12622, Dokki, Giza, Egypt; 2Department of Poultry Diseases, Faculty of Veterinary Medicine, Cairo University, P.O. Code 12211, Giza, Egypt; 3Department of Parasitology and Animal Diseases, Veterinary Research Institute, National Research Centre, P.O. 12622, Dokki, Giza, Egypt.
*Correspondence | Mohamed Mahrous Amer, Department of Poultry Diseases, Faculty of Veterinary Medicine, Cairo University, P.O. Code 12211, Giza, Egypt; Email: profdramer@yahoo.com
Figure 1:
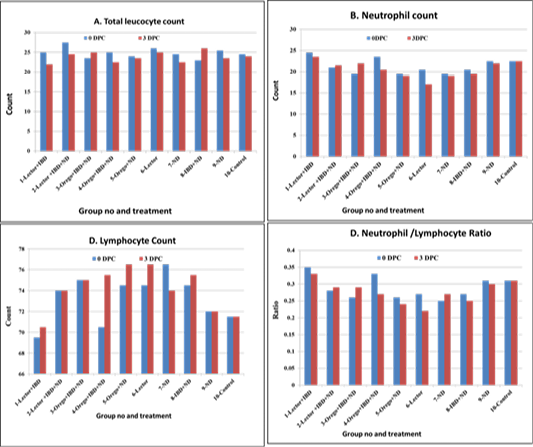
levels of total leucocyte and neutrophil, lymphocytes counts as well as neutrophil/lymphocyte ratio of chicken groups received immunostimulants, vIBDV at 14 days of age and vNDV challenge at 21 days of age at 0, and 3 days post NDV challenge. IBD and NDV infections resulted in undetected basophiles at 0 and 3 days in compared with Lector treated Gp 6 and non-infected non-treated control Gp 10 (table 4). N/L ratio at 0 time Lector + IBD Gp 1 (Table 4, Figure 1D) showed the highest value 0.35 followed by 0.33 in Oregosol+IBD Gp 4 and 0.31 in ND Gp 9 and control Gp10 while the lowest ratio 0.25 was in IBD Gp7. N/L ratio at the 3rd day post NDV challenge immunostimulants treated Gps showed the highest values (0.33) than control Gp10 (0.31), followed by Gps 9, 2 and 3 (0.30, 0.29 and 0.29).
Figure 2:
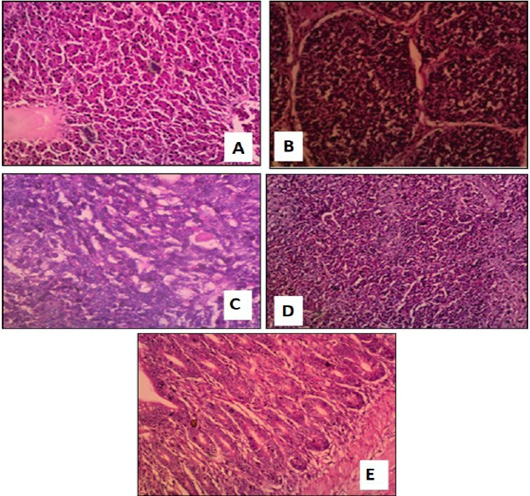
Tissue sections of control negative non-challenged group showing normal structure. A: Normal liver; B: Normal bursa; C, Normal thymus; D, Normal spleen; E: Normal intestine.
Figure 3:
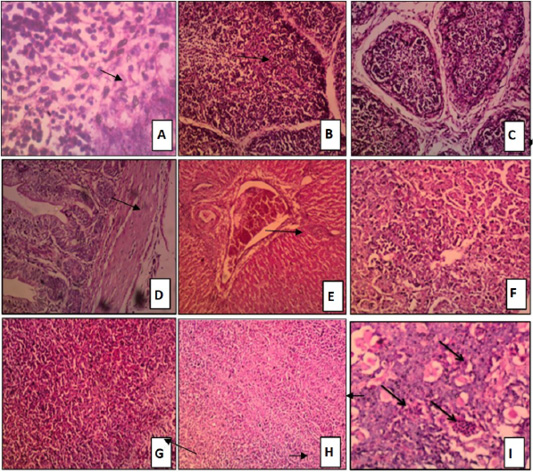
Tissue sections stained with H and E of chicken groups received challenged by NDV only.
A: Bursa: activation of germinal center that showing mitotic figure H and E x 400. B: Bursa: depletion of lymphoid follicles H and E x 200. C: Bursa: inter follicular edema and severe depletion of lymphoid follicles. D: Intestine: mild lymphocytic infiltration of the mucosa H and E x200. E: Liver congestion of central vein H and E x100. F: Liver: focal area of liver necrosis characterized by lymphocytic infiltration H and E x 200. G: Spleen: congestion of red pulp H and E x 200. H: Spleen; sever depletion of lymphoid follicles H and E x100. I: Thymus sowed hemorrhages and necrosis of medulla H and E x 200.
Figure 4:
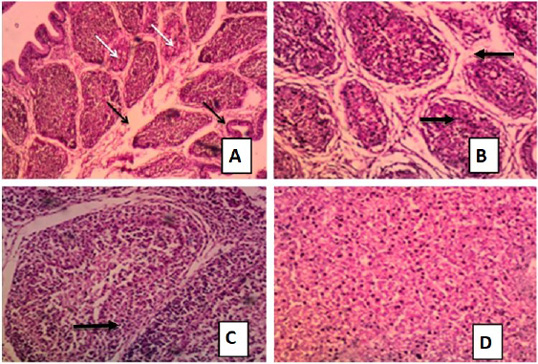
Tissue sections H and E stained of chicken groups challenged with virulent IBDV showing:
A: Bursal depletion of lymphoid follicles and hypertrophy of mucous membrane wit inter follicular edema H and E x 100. B: Bursa: sever depletion of the lymphoid follicle accompanied with inter follicular edema and fibrosis H and E x100. C: Bursa: sever depletion of lymphoid follicle H and E x 200. D: Liver: hydropic degeneration of the hepatocytes cytoplasm H and E x 200.
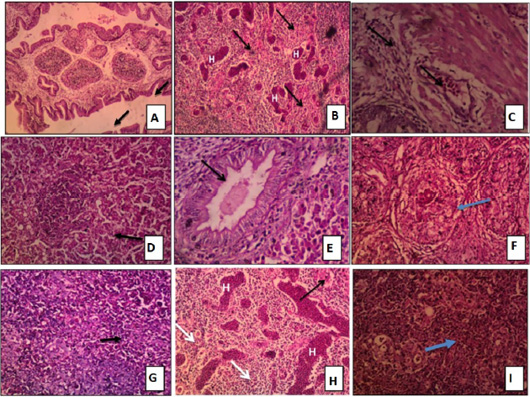
Figure 5:
Tissue sections stained with H and E of Chicken groups challenged with virulent NDV and IBDV showing:
A: Bursa: sever depletion of lymphoid follicles accompanied with inter follicular connective tissue deposition and hypertrophy of the mucous line forming finger like projections H and E x100. B: Bursa: sever depletion of lymphoid follicles with intra follicular hemorrhage H and E x100. C: Intestine: hemorrhage in sub mucosa with lymphocytic infiltration H and E x200. D: Liver: Hydropic degeneration in hepatocytes cytoplasm and focal area of coagulative necrosis infiltrated with lymphocytes H and E x 200. E: Liver: vacuolar degeneration in the cytoplasm of hepatocytes and hypertrophy of bile duct lining epithelium forming finger like projection in the lumen H and E x 200. F: Spleen: fibrosis of the lymphoid follicles H and E x200. G: Spleen: depletion of lymphoid follicles of white pulp H and E x 200. H: Thymus: focal area of hemorrhage, congestion of medulla, congestion of thymic artery and depletion of medulla H and E x 200. I: Thymus: depilation of cortex H and E x200.


