
The Effect of Bacillus cereus Organism on Fish and Its Effect on Human Health


The Effect of Bacillus cereus Organism on Fish and Its Effect on Human Health
Aml M. Ragab1*, Maha R. Basyoni1, Enas A.I. Khoris2, Nadia A. Abd Elghany3

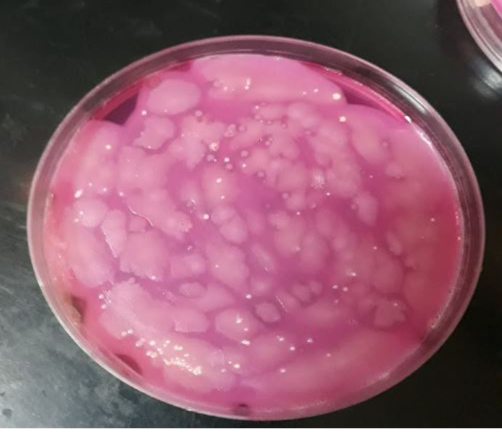
Colonies of B. cereus on MYP media.

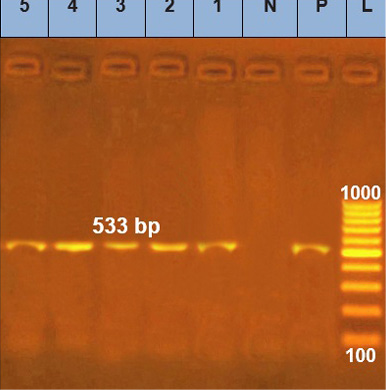
Detection of groELat 533 bp by agarose gel electrophoresis. Lane L: marker of DNA (100 bp), (control positive: P, control negative: N), (Lane 1, 2, 3, 4 and 5): positive samples.
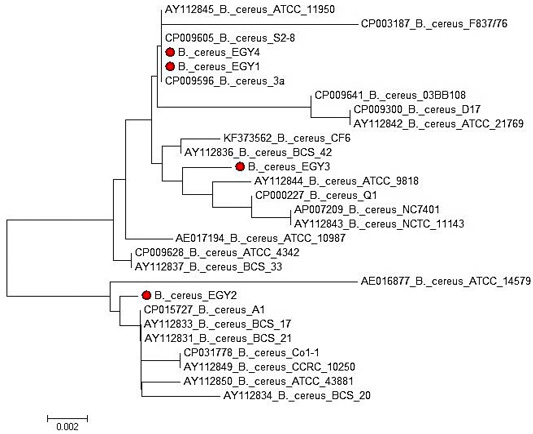
Phylogenetic relatedness of the groEL gene. Subclustering of the analysed strains into 3 subclusters could be indicated by maximum-likelihood unrooted tree generated.
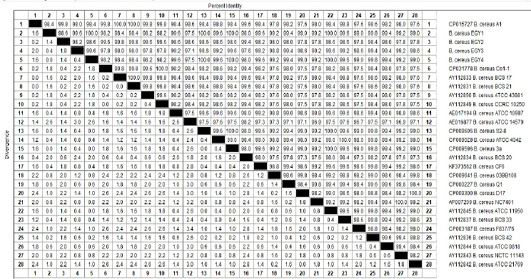
Sequence distance of the groEL gene of the tested B. cereus strains (generated by lasergene software) showing identity range of 97.1-100% with different B. cereus strains and ours in this research.
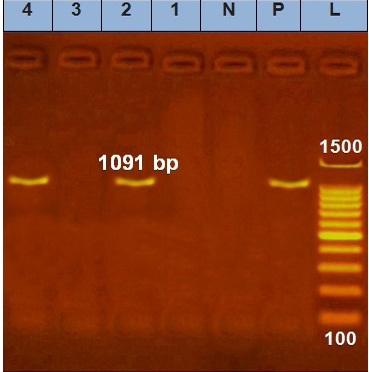
Detection of hbl at 1091 bp by agarose gel electrophoresis. Lane L: marker of DNA (100 bp), (control positive: P, control negative: N), Lane 2 and 4: positive samples, Lane 1 and 3: negative samples.

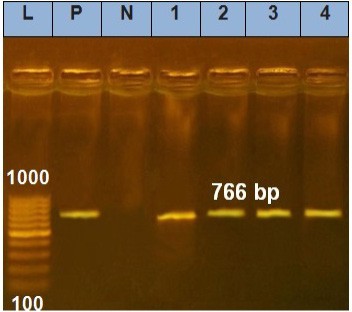
Detection of nhe at 766 bp by agarose gel electrophoresis. Lane L: marker of DNA (100 bp), (control positive: P, control negative: N), Lane 1, 2, 3 and 4: positive samples.

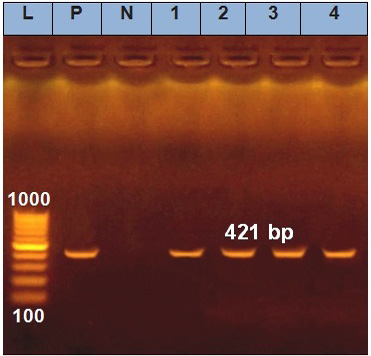
Detection of Cyt k at 421 bp by agarose gel electrophoresis. Lane L: marker of DNA (100 bp), (control positive: P, control negative: N), Lane 1, 2, 3 and 4: positive samples.
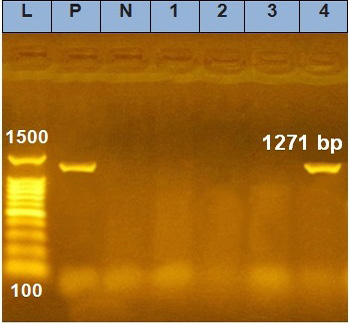
Detection of ces at 1271 bp by agarose gel electrophoresis. Lane L: marker of DNA (100 bp), (control positive: P, control negative: N), Lane 1, 2 and 3: negative, only lane 4: positive.

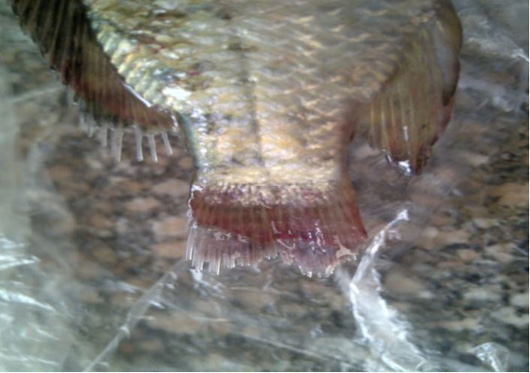
Experimentally infected with O. niloticus showing tail and fin rot, darkness in color, loss of scales and ulceration.

Experimentally infected with O. niloticus showing deep ulceration.
Experimentally infected with O. niloticus showing deep ulceration.
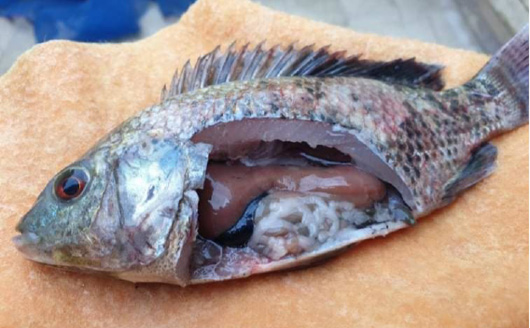
Experimentally infected with O. niloticus showing deep ulceration.

