

Taxonomic diversity of Fish Assemblages in the Pearl River Estuary, Southern China


Taxonomic diversity of Fish Assemblages in the Pearl River Estuary, Southern China
Xinxing Wang1,4, Yunrong Shi2, Guobao Chen1, Tao Chen1, Kui Zhang1,3* and Wenhua Liu4*
1South China Sea Fisheries Research Institute, Chinese Academy of Fishery Sciences, Guangzhou 510300, China
2East China Sea Fisheries Research Institute, Chinese Academy of Fishery Sciences, Shanghai 200090, China
3Key Laboratory for Sustainable Utilization of Open-Sea Fishery, Ministry of Agriculture and Rural Affairs, Guangzhou 510300, China
4Marine Biology Institute, Shantou University, Guangdong Province, Shantou 515063, China
ABSTRACT
The Pearl River Estuary (PRE), an important place provides natural spawning ground and migration channel to multiple fish species located in the northern South China Sea. Keeping in mind limited data available on the taxonomic diversity of fishes from this region, we compiled time-series data on fish species from the PRE collected since the 1980s, and analyze diversity at different taxonomic levels using an inclusion index at the taxonomic level, and indexes of taxonomic diversity. Species inventory includes 18 orders, 79 families and 167 genera. Average numbers of (families, genera, species), (genera, species), and (species) per order, family, and genus, (4.39, 9.28, 14.94), (2.11, 3.41), and (1.61) were recorded. An average taxonomic distinctness of 75.0, and variation in taxonomic distinctness 99.8 were calculated. Whereas, an average taxonomic distinctness reveals genetic relationships between PRE fish species to be closer than in the East China Sea continental shelf (65.7) and Daya Bay (62.2), and more distant for the Dongsha Islands (55.2). Based on the overall results of the present study it is concluded that species abundance and taxonomic diversities in the PRE reflects healthy ecosystem of PRE.
Article Information
Received 05 January 2023
Revised 28 January 2023
Accepted 17 February 2023
Available online 08 May 2023
(early access)
Published 26 August 2024
Authors’ Contribution
XXW, KZ and YRS presented the concept, wrote and edited the manuscript. XXW, TC, and GBC performed investigation and data collection. XXW, KZ and WHL provided resources, and reviewed and edited the manuscript.
Key words
Inclusion index at taxonomic level, Relative abundance index, Similarity index, Pearl River Estuary
DOI: https://dx.doi.org/10.17582/journal.pjz/20230105010156
* Corresponding author: zhangkui@scsfri.ac.cn, whliu@stu.edu.cn
0030-9923/2024/0005-2479 $ 9.00/0
Copyright 2024 by the authors. Licensee Zoological Society of Pakistan.
This article is an open access article distributed under the terms and conditions of the Creative Commons Attribution (CC BY) license (https://creativecommons.org/licenses/by/4.0/).
Introduction
Estuarine ecosystems are important ecological transitional zones characterized by high productivity and strong environmental gradients (Simier et al., 2006). They are also vulnerable to human disturbance such as by overfishing, habitat degradation, water eutrophication, and pollution (Crooks and Turner, 1999; Cai et al., 2021; Kutir et al., 2022; Xu et al., 2022). Estuarine salinity increases from freshwater river habitat, to transitional brackish waters, to fully saline marine conditions (Zhao, 1989). Estuarine habitat is ecologically important to fish which complete their entire life history in these environments, or use them as nursery and/or feeding grounds, or even as migration channels (Malavasi et al., 2004; Steel et al., 2013).
Generally, closely related species have similar habitat requirements (Miranda et al., 2005). Because of the highly heterogeneous nature of estuarine habitat (Shen, 2010; Gomes-Goncalves and Araujo, 2022), considerable differences in demand for certain habitat types should exist and these should be reflected in genetic relationships between species. If this assumption holds true, then estuarine fish communities should comprise species that are more distantly related to each other than those of more homogeneous environments.
Traditional measures of fish community diversity include Pielou’s evenness (Pielou, 1975), Shannon–Wiener diversity (Shannon and Wiener, 1949), and Margalef’s species richness (Margalef, 1958) indexes. However, these indexes are limited by sampling technique and sample size, and do not reflect the diversity of an entire system. The taxonomic diversity index is a statistical method that does not measure how much it deviates from an expected value, and its response to environmental changes is not monotonic. The taxonomic diversity index changes drastically with different habitat types (Xu et al., 2005).
The taxonomic diversity index measures genetic relationships between species in a community by considering the number of species in a community and relationships between them based on taxonomic hierarchy. Taxonomic diversity indexes include taxonomic diversity, taxonomic distinctness, average taxonomic distinctness, and variations in taxonomic distinctness. Such indexes have been previously applied to analyze fish communities (Warwick and Clarke, 1995; Clarke and Warwick, 1998, 2001).
Most fish species in the Pearl River Estuary (PRE) are small and either coastal or estuarine dwellers that are tolerant of high temperatures and reduced salinity (Li et al., 2002). Within the PRE, fish communities change seasonally throughout five water areas (Wang and Lin, 2008). Assessments of ecological diversity in the PRE have revealed characteristics of fish community structure (Li, 2008), but not genetic relationships between species.
To test our hypothesis that genetic relationships between fish species in estuarine waters are more distant than those in more homogeneous environments, we compare taxonomic characteristics of fish communities within the PRE with those from outside of it. Additionally, we report diversity characteristics from different level, and provide a scientific basis on which these fish communities can be protected.
Materials and Methods
Study area
The Pearl River catchment area 415,000 km2 (Zong et al., 2009) is the third largest river in China, with a total river basin length of 3215 km, and discharge ~326 billion m3 (Zhao, 1990). Its annual sediment load is ~3.74 million tons, accounting for 61% of the total runoff of the Pearl River. Lingding Bay, into which the Pearl River discharges, has two relatively deep troughs the east trough (Fanshi fairway) and West Trough (Lingding fairway), boarded by the east, middle and west shoals, each shallower than 5 m (Wu et al., 2014). Our study area includes Lianhuashan–Humen channel, Lingding Bay waters, and the PRE within 40 m depth (Fig. 1) bound by coordinates 21°43–22°45’N, 113°7–114°38’E (Fig. 1).
Data sources
Historical fish survey data within PRE waters (Ma, 1995; Wang, 2006; Li, 2008; Wang and Lin, 2008) was collated, and reported fish species were systematically sorted (Meng, 1996; Nelson et al., 2016) (Table I). Only taxa identified to species were included in analysis. Following the Nelson classification system, freshwater species were excluded.
The inclusion index at taxonomic level (TINCLi)
To explain genetic relationships between fish species, we analyzed the degree of concentration of each level using TINCLi (Li et al., 2011). The higher the TINCLi value, the more species level (families, genera, species) belonging to the higher order class, indicating that the distributions of species are more concentrated, and that relationships between them are closer.
Table I. Historical fisheries research data from Pearl River estuary.
|
Investigation year |
Sample mode |
Investigation months |
Investigation area |
number of stations |
|
1980–1981 |
Agassiz trawl |
Season survey |
Offshore area |
27 |
|
1986–1987 |
Bottom trawl |
Monthly survey |
Humen channel to offshore area |
18 |
|
1990–1991 |
Bottom trawl |
March, October |
Mainly offshore area, part of brackish water area |
25 |
|
1997–1998 |
Lift net, pointed fishnet |
Monthly survey |
Near Neilingding Island |
5 |
|
2003 |
Bottom trawl |
March, April, May, August, September, October, November |
Humen channel to Lingding Bay |
6 |
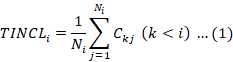
Ni represents the number of i-th taxonomic level, and Ckj is the number of j-th k- taxonomic level. We compared TINCLi values for different sea areas.
Taxonomic diversity
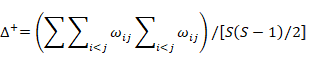
Warwick and Clarke (1995) and Clarke and Warwick (1998) proposed two concepts of taxonomic diversity. These two concepts and TINCLi provide standards to use to identify relationships between species abundance and species relatedness in communities. Average taxonomic distinctness (Δ+), based on differences in taxonomic levels of species, and their presence or absence, is used to assess species diversity within a community; this index eliminates the need to appraise diversity based on species richness. Δ+ refers to the path length of the average taxonomic rank between any two randomly selected species in a community. It is simple weighting of dominant and common species within a community, and its average value is not affected by sample size or the nature of sampling (Warwick and Clarke, 1995; Clarke and Warwick, 1998; Xu et al., 2005; Li, 2013). The Λ+ value is a theoretical average value of deviation from Δ+, which reflects the uniformity in distribution of related fishes in a community; it can also be regarded as an index of the complexity of the classification tree (Mouillot et al., 2005). The value of Λ+ is small only when there are very few species (Graham et al., 2007). These two indexes are calculated as follows.
Average taxonomic distinctness (Ludwig et al., 1988)
Variation in taxonomic distinctness (Ludwig et al., 1988).
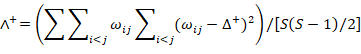
Where ωij is the path length of the i-th and j-th species in a taxonomic tree, and S is the number of species. Because all fish are chordates, our five taxonomic levels are class, order, family, genus, and species. We obtained Δ+ and Λ+ values using TACDTEST in the PRIMER5 software package (Ricotta and Avena, 2002; Li, 2013). Differences in Δ+ and Λ+ among sea areas are regarded to be insignificant (P > 0.05), significant (0.05 ≤ P <0.01), or extremely significant (P ≤ 0.01) (Table II).
Relative abundance index
The number of species in a community is called species richness. Our objective is to analyze fish species abundance in the PRE at a supraspecific level. To achieve this, we use the relative abundance index to characterize relative proportions of fish among different families/orders from the family/order level. The relative abundance index (Li et al., 2011) was calculated by the following equation:
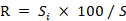
Where Si is the number of fish species of the i-th genus (family, order), and S is the number of corresponding fish genera (family, order) recorded in a sea area. Because the relative abundance index of each taxonomic level reflects basically the same influence trend, we only calculate relative abundance of family and order-level taxa the average number of species of the i-th family/order possessed by taxonomic order.
Table II. Branch weight on species for each taxonomic level.
|
Taxon level |
ωij relationship amongst species |
ωij branch weight |
|
Species |
Species belong to the same genus |
16.667 |
|
Genus |
Species belong to the same family and different genera |
33.333 |
|
family |
Species belong to the same order and different families |
50.000 |
|
order |
Species belong to the same class and different orders |
66.667 |
|
class |
Species belong to the same phylum and different classes |
83.333 |
Similarity index
In communities with similar species, a comprehensive index of the total number of species and the number of common species a community similarity index could be used to express degrees of similarity in species composition. We use the Sorenson community similarity index to calculate similarity in fish species and family taxonomy between the East China Sea continental shelf (ECSCS), Daya Bay, and Dongsha Islands. The similarity index (zhang and Zhang, 1998) can be expressed as:
Where Sx is the number of fish orders (family, genus, species) recorded in sea area A, Sy is the number of fish orders (family, genus, species) recorded in sea area B, Sxy is the number of fish orders common to the two areas (families, genus, species), and C is the Czekanowski coefficient. When species in two areas are identical the Czekanowski coefficient equals 1, and when the species in the two areas differ completely, this coefficient equals 0.
Results
Fish species composition
Fish recorded from the PRE in the 1980s comprise 18 orders, 79 families, 167 genera, and 269 species, including 3 orders, 5 families, and 5 genera of cartilaginous fishes, and 15 orders, 74 families, and 162 genera of bony fishes (Table III). Order level analysis reveals the Perciformes as dominant (37 families, 82 genera), followed by the Clupeiformes (3 families, 14 genera). Family level analysis reveals fish species richness in PPE waters to be relatively high, with the top five families ranked by decreasing richness being the Gobiidae, Sciaenidae, Clupeidae, Carangidae, and Engraulidae.
Table III. Pearl River estuary fish order, family, and genus composition.
|
Class/ Order |
Family % |
Genus % |
|
Elasmobranchii |
||
|
Orectolobiformes |
1.3 |
0.6 |
|
Carcharhiniformes |
1.3 |
0.6 |
|
Myliobatiformes |
3.8 |
1.8 |
|
Osteichthyes |
||
|
Perciformes |
46.8 |
49.1 |
|
Anguilliformes |
8.9 |
7.2 |
|
Scorpaeniformes |
5.1 |
6.0 |
|
Pleuronectiformes |
5.1 |
6.6 |
|
Tetraodontiformes |
5.1 |
4.2 |
|
Clupeiformes |
3.8 |
8.4 |
|
Mugiliformes |
3.8 |
5.4 |
|
Beloniformes |
2.5 |
1.2 |
|
Gasterosteiformes |
2.5 |
3.0 |
|
Siluriformes |
2.5 |
1.2 |
|
Myctophiformes |
2.5 |
1.8 |
|
Elopiformes |
1.3 |
0.6 |
|
Salmoniformes |
1.3 |
1.2 |
|
Gadiformes |
1.3 |
0.6 |
|
Atheriniformes |
1.3 |
0.6 |
Inclusion index at taxonomic level
Average numbers of (families, genera, species), (genera, species), and (species) per order, family, and genus are (4.39, 9.28, 14.94), (2.11, 3.41), and (1.61), respectively. These values are compared with those from the Dongsha Islands (Shi et al., 2009), ECSCS (Li, 2005), and Daya Bay (Li et al., 2011) (Table IV).
Taxonomic diversity
For the PRE, the Δ+ value is 62.3, and Λ+ 99.8, whereas theoretical average value of Δ+ (dotted line in Fig. 2A) changes little with an increase in fish species richness. Figure 2B reveals Λ+ values to be small only when there are fewer than 10 fish species, but for Λ+ to remain largely constant when the number of fish species exceeds 10.
Relative abundance index
Perciformes dominate, followed by Clupeiformes, Pleuronectiformes, and Tetraodontiformes (Table V). Within the PRE, six fish families contain more than 10 species: Perciformes (Gobiidae, Sciaenidae, Carangidae), Clupeiformes (Engraulidae, Clupeidae), and Pleuronectiformes (Cynoglossidae). The relative abundance index for the Gobiidae was greatest, followed by Sciaenidae, Clupeidae, Engraulidae, Carangidae, and Cynoglossidae.
Table IV. Inclusion index at taxonomic level for Pearl River estuary fishes and other sea areas in China.
|
Area |
Latitude |
Number of species |
S/G |
S/F |
S/O |
G/F |
G/O |
F/O |
|
East China Sea continental shelf |
26°00′–33°00′ N |
350 |
1.48 |
2.92 |
12.07 |
1.97 |
8.16 |
4.13 |
|
Daya Bay |
22°30′–22°50′ N |
320 |
1.55 |
3.40 |
14.55 |
2.19 |
9.36 |
4.27 |
|
Pearl River Estuary |
21°43′–22°45′ N |
269 |
1.61 |
3.41 |
14.94 |
2.11 |
9.28 |
4.39 |
|
Dongsha Island |
20°33′–21°10′ N |
514 |
7.45 |
24.48 |
3.09 |
10.14 |
3.29 |
2.41 |
S, species; G, genus; F, family; O, order.
Table V. Relative numbers of orders of fish in Pearl River estuary.
|
Order |
Rr |
Order |
Rr |
|
Perciformes |
761.1 |
Beloniformes |
27.8 |
|
Clupeiformes |
166.7 |
Myliobatiformes |
22.2 |
|
Pleuronectiformes |
116.7 |
Siluriformes |
11.1 |
|
Tetraodontiformes |
94.4 |
Salmoniformes |
11.1 |
|
Anguilliformes |
77.8 |
Gadiformes |
5.6 |
|
Mugiliformes |
61.1 |
Atheriniformes |
5.6 |
|
Scorpaeniformes |
55.6 |
Orectolobiformes |
5.6 |
|
Gasterosteiformes |
33.3 |
Carcharhiniformes |
5.6 |
|
Myctophiformes |
27.8 |
Elopiformes |
5.6 |
Similarity index
Similarity indexes of fish families and species in the PRE, Daya Bay, ECSCS, and Dongsha Island waters are presented in Table VI. At the family level, fishes in Daya Bay are most similar to those in the PRE, followed by fishes in the ECSCS, then Dongsha Islands. At the species level, the fish fauna of the PRE is most similar to that of Daya Bay, followed by the ECSCS, then Dongsha Islands.
Table VI. Pearl River estuary fish faunal similarities with other sea areas in China.
|
Region |
Daya Bay (family/species) |
East China Sea continental shelf (family/species) |
Dongsha Islands (family/species) |
|
Pearl River Estuary |
0.682/0.57 |
0.503/0.271 |
0.358/0.023 |
Discussion
Ecosystem of the Pearl River Estuary (PRE) is triggered by both marine water and river runoff influences that ultimately shake salinity of the estuarine. Therefore, fish species that can adapt wider range of salinities (e.g., big head croaker Collichthys lucidus, Osbeck’s grenadier anchovy Coilia mystus, Dussumier’s thryssa Thryssa dussumieri, and Kammal thryssa Thryssa kammalensis dominate the populations (Wang, 2006). However, in particular years, changes in tides and currents lead to various marine fishes also occurring in the PRE, including shrimp scad Alepes djedaba, silver pomfret Pampus argenteus, orangefin ponyfish Photopectoralis bindus, and largehead hairtail Trichiurus lepturus (Chen, 1990). Compared with other estuaries in china (Yalu, Yellow, Yangtze, and Oujiang river estuaries) (Chen et al., 2000; Xu, 2008; Huang, 2011), the PRE contains more brackish water fish species (20 Gobiidae and 7 Mugilidae species). Numbers of species are consistent with a decrease in species richness with increased latitude, as similarly reported by Shi et al. (2009).
In addition to latitude, habitat range and runoff affect species diversity (Sambou et al. 2020). The PRE occurs in a low-latitude subtropical region, with an average annual water flow to the sea second only to the Yangtze River. Higher species diversity might be related to its larger catchment area. Collectively, low-latitude, high-runoff, and large water area render the PRE habitat complex and elevate its fish species richness. At the order level, more species are referable to the Perciformes than Clupeiformes, then Pleuronectiformes. At the family level, most species are referable to the Gobiidae (Perciformes), Clupeidae and Engraulidae (Clupeiformes), and Cynoglossidae (Pleuronectiformes). At the order level, the Perciformes and Cypriniformes dominate waters of the Yellow River and Yangtze River estuaries (Zheng et al., 2014), while Perciformes, Clupeiformes and Pleuronectiformes taxa dominate those of the PRE.
Table VII. Summary of indices of taxonomic diversity for fish species in the East China Sea continental shelf, Daya Bay, Pearl River Estuary, and Dongsha Islands.
|
Area |
latitude |
Δ+ |
Λ+ |
|
East China sea continental shelf |
26°00′–33°00′ N |
65.7 |
120 |
|
Daya Bay |
22°30′–22°50′ N |
62.2 |
110 |
|
Pearl River Estuary |
21°43′–22°45′ N |
62.3 |
100 |
|
Dongsha Islands |
20°33′–21°10′ N |
55.2 |
110 |
Table VIII. Significance of △+ for fish species in Pearl River Estuary, Daya Bay, East China Sea continental shelf, and Dongsha Islands (t-test).
|
Region |
Daya Bay |
East China Sea continental shelf |
Dongsha Islands |
|
Pearl River Estuary |
4.172** |
4.815** |
9.823** |
Note: **extremely significant difference (P < 0.01).
The PRE Δ+ (62.3) value is greater than that for Daya Bay, and Dongsha Islands (Table VII), indicating that PRE fish species are more closely related to each other than elsewhere, and that the composition of fish species in this estuary is also more complex. The PRE taxonomic diversity index differs significantly from those of the other three areas (Table VIII, P < 0.01). Of 18 orders, 79 families, 167 genera and 269 species recorded from the PRE, the number of species is less than reported elsewhere. The TINCLi of all leves in the PRE was higher than for the ECSCS and lower than for the Dongsha Islands (Table IV). Compared with the TINCLi in Daya Bay, that in the PRE at the genus level was highest, reflecting the significant difference in numbers of species in this region compared with those elsewhere. The highest TINCLi values for different taxonomic orders occur in the PRE. Annual variation in water temperature and salinity throughout the PRE is considerable (Zhao, 1981).
Spatial and temporal environmental gradients change greatly, as does variation in species composition. However, in relatively homogeneous environments, such as tropical coral reefs, fish communities are both relatively diverse but have relatively close morphological relationships because of numerous microhabitats with limited change in temperature and salinity (Shi et al., 2009).
Regional environmental differences also affect regional similarities. At the family level, the similarity between the PRE and Daya Bay is the highest (0.682), the ECSCS the second highest (0.503), and that with Dongsha Islands the lowest (0.358). At the species level, species similarity decreased between the PRE and Daya Bay, ECSCS, and Dongsha Islands. At the family level, fish faunas of PRE and Daya Bay were most similar, with families common to both including the Gobiidae, Sciaenidae, and Carangidae (Perciformes), the Engraulidae (Clupeiformes), and Tetraodontidae (Tetraodontiformes). Of these the Gobiidae is widely distributed and occurs mainly in near-shore intertidal and shallow seas with sediment and reefs, and brackish and freshwater areas of estuaries. Most Sciaenidae (e.g., miiuy croaker Miichthys miiuy, big head croaker Collichthys lucidus, Belanger’s croaker Johnius belangerii) are coastal species, with main habitats in estuaries and bays. Engraulids (such as Osbeck’s grenadier anchovy and Gray’s grenadier anchovy Coilia grayii) can generally adapt to waters with large salinity changes, and estuaries and bays represent important feeding grounds.
Many families have similar habitats, and the similarity between PRE and ECSCS is the greatest. The similarity index between PRE and ECSCS waters is 0.503, with families common to both including (for example) the Gobiidae, Carangidae, Apogonidae, Sciaenidae, Leiognathidae, and Stromateidae (Perciformes), Engraulidae (Clupeiformes), Synodidae (Myctophiformes), and (for example) Bothidae, Soleidae, and Cynoglossidae (Pleuronectiformes), all of which mostly occur in coastal waters. The PRE and Dongsha Islands have the lowest similarity in family composition (the family similarity index is only 0.358); these families are mainly reef fish and a small number of fish that frequent coral clusters of marine species. Families common to two areas mainly include Perciformes (e.g., Serranidae, Carangidae, Lutjanidae, Mullidae, Chaetodontidae, Gobiidae), for which main habitats are near coral or rocky reefs. There are only 9 species of fish, and the similarity index of species is only 0.023 between the PRE and Dongsha Islands. Dissimilarity in coral reef and continental shelf environments typically allows for gene exchange only where similar habitats occur. Although some coral reef ecosystems can be separated by thousands of kilometers, similarities in species composition can be higher between them than between reef and adjacent continental shelf waters (Tilman, 1996; Findley and Findley, 2002).
With increased fishing intensity and rampant fishing practices, most economic fish species in the PRE have been over-exploited. Land reclamation and other marine developments reducing spawning grounds and environmental degradation has led to ecological imbalances. Therefore, maintaining fish communities is unavoidable for ecosystem stability (Tilman, 1996; Li et al., 2021; Jarzyna et al., 2022). The taxonomic diversity index is more sensitive to environmental changes than traditional diversity indexes (Xu et al., 2005). Therefore, identifying changes in PRE fish communities using the taxonomic diversity index can provide a scientific basis for environmental protection by historical data and latest survey data.
Conclusion
Higher species diversity and higher taxonomic diversity are main characteristics of patterns in fish diversity in estuary region. By calculating the taxonomic diversity index, it is also possible to understand the degree of impact on biodiversity due to human or natural disturbances. Under the influence of global warming, overfishing and other factors, the fish in the Pearl River Estuary have been disturbed to varying degrees. Some commercial fish species have been overfished. The species have also been significantly reduced, but how do these factors affect the taxonomic diversity of fish in the estuary? The extent of the impact needs to be further studied.
Funding
Research reported in this publication was supported by National Natural Science Foundation of China (42230413), the Science and Technology Planning Project of Guangdong Province (2019B121201001), and Hainan Provincial Science and Technology Plan Sanya Yazhou Bay Science and Technology City Science and Technology Innovation Joint Project (2021CXLH0004).
IRB approval
This research as approved by South China Sea Fisheries Research Institute Animal Welfare Committee (2021SD01).
Ethical statement
The care and use of experimental fishes were consistent with the People’s Republic of China animal welfare laws, guidelines and policies. Fishes were collected by scientific surveys and the experimental conditions did not distress any fishes involved in our experiments.
Statement of conflict of interest
The authors have declared no conflict of interests.
REFERENCES
Cai, W.J., Feely, R.A., Testa, J.M., Li, M., Evans, W., Alin, S.R., Xu, Y.Y., Pelletier, G., Ahmed, A., Greeley, D.J., Newton, J.A., and Bednaršek, N., 2021. Natural and anthropogenic drivers of acidification in large estuaries. Annu. Rev. Mar. Sci., 13: 23-55. https://doi.org/10.1146/annurev-marine-010419-011004
Chen, D.G., Shen, W.Q., Liu, Q., Jiao, Y., Chen, X., Zeng, X.Q., and Ren, Y.P., 2000. The geographical characteristics and fish species diversity in the laizhou bay and yellow river estuary. J. Fish. Sci. China, 7: 46-52.
Chen, L., 1990. Study on the characteristics of fish and shrimp fauna in lingding bay, pearl river estuary. S. China Fish. Sci., 2: 21-31.
Clarke, K.R. and Warwick, R.M., 1998. A taxonomic distinctness index and its statistical properties. J. appl. Ecol., 35: 523-531. https://doi.org/10.1046/j.1365-2664.1998.3540523.x
Clarke, K.R. and Warwick, R.M., 2001. A further biodiversity index applicable to species lists: Variation in taxonomic distinctness. Mar. Ecol. Prog. Ser., 216: 265-278. https://doi.org/10.3354/meps216265
Crooks, S. and Turner, R.K., 1999. Integrated coastal management: Sustaining estuarine natural resources. Adv. Ecol. Res., 29: 241-289. https://doi.org/10.1016/S0065-2504(08)60195-6
Findley, J.S., and Findley, M.T., 2002. Global, regional, and local patterns in species richness and abundance of butterflyfishes: Reply. Ecology, 83: 585-586. https://doi.org/10.1890/0012-9658(2002)083[0585:GRALPI]2.0.CO;2
Gomes-Goncalves, R.D., and Araujo, F.G., 2022. Relationships between environmental heterogeneity and fish beta diversity in a tropical bay. Mar. Biol. Res., 18: 19-31. https://doi.org/10.1080/17451000.2022.2063902
Graham, N.A.J., McClanahan, T.R., Letourneur, Y., and Galzin, R., 2007. Anthropogenic stressors, inter-specific competition and enso effects on a mauritian coral reef. Environ. Biol. Fishes, 78: 57-69. https://doi.org/10.1007/s10641-006-9077-5
Huang, L.M., 2011. Study on fishery resources and fish diversity in minjiang river estuary and jiulong river estuary and their adjacent. PhD thesis, Ocean University of China, Qindao, China.
Jarzyna, M.A., Norman, K.E.A., LaMontagne, J.M., Helmus, M.R., Li, D.J., Parker, S.M., Rocha, M.P., Record, S., Sokol, E.R., Zarnetske, P.L., and Surasinghe, T.D., 2022. Community stability is related to animal diversity change. Ecosphere, 13: 16. https://doi.org/10.1002/ecs2.3970
Kutir, C., Agblorti, S.K.M., and Campion, B.B., 2022. Migration and estuarine land use/land cover (lulc) change along ghana’s coast. Reg. Stud. Mar. Sci., 54: 1-11. https://doi.org/10.1016/j.rsma.2022.102488
Li, M., 2013. Taxonomy of fish. 3rd edn. Nankai University Press, China.
Li, N.N., Dong, L.N., Li, Y.Z., Ai, H., Li, X., Chen, G.B., and Shi, Y.R., 2011. Taxonomic diversity of fish species in the daya bay, the south china sea. J. Fish. China, 35: 863-870. https://doi.org/10.3724/SP.J.1231.2011.17363
Li, S., 2005. The ecological study of fish community in the east china sea continental shelf: The spatial pattern and diversity. PhD thesis, East China Normal University, Shanghai, China.
Li, Y.J., Chen, Z.Z., and Zhang, J., 2021. Fish composition and diversity of four coral reefs in the south china sea based on hand-line catch. J. Mar. Sci. Eng., 10: 38. https://doi.org/10.3390/jmse10010038
Li, Y.Q., 2008. Study on fish community structure in the pearl river estuary waters. Master thesis, Guangdong Ocean University, Zhanjiang, china.
li, Y.Z., Chen, G.B., Sun, D.R., and Zhang, X.F., 2002. Multivariate analysis of nekton composition in pearl river estuary waters. J. Fish. Sci. China, 9: 328-339.
Ludwig, J.A., Reynolds, J.F., Quartet, L., and Reynolds, J., 1988. Statistical ecology: A primer in methods and computing. John Wiley and Sons Inc, New York, USA.
Ma, Y., 1995. Comprehensive investigation report on island resources in guangdong province. Guangdong Science and Technology Press, china.
Malavasi, S., Fiorin, R., Franco, A., Franzoi, P., Granzotto, A., Riccato, F., and Mainardi, D., 2004. Fish assemblages of venice lagoon shallow waters: An analysis based on species, families and functional guilds. J. Mar. Syst., 51: 19-31. https://doi.org/10.1016/j.jmarsys.2004.05.006
Margalef, D.R., 1958. Information theory in ecology. Gen. Syst., 3: 36-71.
Meng, Q., 1996. Fish taxonomy. 1st edn. China Agricultural Press, China.
Miranda, J.R., Mouillot, D., Hernandez, D.F., Lopez, A.S., Do Chi, T., and Perez, L.A., 2005. Changes in four complementary facets of fish diversity in a tropical coastal lagoon after 18 years: A functional interpretation. Mar. Ecol. Prog. Ser., 304: 1-13. https://doi.org/10.3354/meps304001
Mouillot, D., Laune, J., Tomasini, J.A., Aliaume, C., Brehmer, P., Dutrieux, E., and Do Chi, T., 2005. Assessment of coastal lagoon quality with taxonomic diversity indices of fish, zoobenthos and macrophyte communities. Hydrobiologia, 550: 121-130. https://doi.org/10.1007/s10750-005-4368-y
Nelson, J.S., Grande, T.C., and Wilson, M.V.H., 2016. Fishes of the world. 5th edn. Wiley, USA. https://doi.org/10.1002/9781119174844
Pielou, E.C., 1975. Ecological diversity. John Wiley and Sons Inc, USA.
Ricotta, C., and Avena, G.C., 2002. On the information-theoretical meaning of hill’s parametric evenness. Acta Biotheor., 50: 63-71. https://doi.org/10.1023/A:1014717428386
Sambou, O.S., Kang, B., Xu, H., Zhou, Y.D., and Panhwar, S.K., 2020. Fish assemblage in the Hairtail Protected Area, East China Sea in relation to environmental variables. Cah. biol. mar., 61: 279-289.
Shannon, C.E. and W. Wiener, 1949. The mathematical theory of communication. University of Illinois Press, Urbana.
Shen, G.Y., 2010. Marine ecology. 3rd edn. Science Press, China.
Shi, Y.R., Li, Y.Z., Lu, W.H., and Sun, D.F., 2009. Taxonomic diversity of fish species in coral reef area from dongsha islands. S. China Fish. Sci., 5: 10-16.
Simier, M., Laurent, C., Ecoutin, J.M., and Albaret, J.J., 2006. The gambia river estuary: A reference point for estuarine fish assemblages studies in west africa. Estuarine, Coastal Shelf. Sci., 69: 615-628. https://doi.org/10.1016/j.ecss.2006.05.028
Steel, A.E., Sandstrom, P.T., Brandes, P.L., and Klimley, A.P., 2013. Migration route selection of juvenile chinook salmon at the delta cross channel, and the role of water velocity and individual movement patterns. Environ. Biol. Fishes, 96: 215-224. https://doi.org/10.1007/s10641-012-9992-6
Tilman, D., 1996. Biodiversity: Population versus ecosystem stability. Ecology, 77: 350-363. https://doi.org/10.2307/2265614
Wang, D., 2006. Research of the community and diversity of fishes in the pearl river estuarine waters. Master thesis, Shanghai Ocean University, Shanghai, China.
Wang, D., and Lin, Z.J., 2008. Spatial and temporal variations of fish community structure in the pearl river estuary waters. S. China Fish. Sci., pp. 37-45.
Warwick, R.M., and Clarke, K.R., 1995. New biodiversity measures reveal a decrease in taxonomic distinctness with increasing stress. Mar. Ecol. Prog. Ser., 129: 301-305. https://doi.org/10.3354/meps129301
Wu, Z.Y., Milliman, J.D., Zhao, D.N., Zhou, Z.J., and Yao, C.H., 2014. Recent geomorphic change in lingding bay, china, in response to economic and urban growth on the pearl river delta, southern china. Glob. Planet. Change, 123: 1-12. https://doi.org/10.1016/j.gloplacha.2014.10.009
Xu, B.D., Jin, X.S., and Liang, Z.L., 2005. The taxonomic diversity of fish communities in the yellow sea. Peri. Ocean Univ. China, 35: 629-634.
Xu, P., Zhou, W.G., Xie, M.J., Ding, D.W., and Suo, A.N., 2022. Temporal and spatial comparison of food web structure in marine pastures in the pearl river estuary: Implications for sustainable fisheries management. Ecol. Evol., 12: 13. https://doi.org/10.1002/ece3.8903
Xu, Z.L., 2008. Analysis of fish diversity in the waters off the oujiang estuary in summer and autumn. Acta Ecol. Sin., 28: 5948-5956.
Zhang, Y.L., and Zhang, X.M., 1998. Coeeficient of similarity an important parameter in floristic geography. Geogr. Res., 17: 429-434.
Zhao, H., 1990. The evolution of the pearl river estuary. 1st edn. China Ocean Press, China.
Zhao, H.T., 1981. Bottom relief of lingdingyang of the zhujiang river estuary. Haiyang Xuebao, 2: 255-274.
Zhao, H.T., 1989. Hydrological and sedimentary characteristics of the pearl river estuary. Trop. Geo., 9: 201-212.
Zheng, L., Lv, Z.B., Li, F., Xu, B.Q., Li, M.L., and Yang, F.Z., 2014. Comparison of on taxo-nomic diversity of fish community among the yellow river estuary, yangtze river estuary, pearl river estuary and their adjacent waters. J. Dalian Ocean Univ., 29: 530-535.
Zong, Y., Huang, G., Switzer, A.D., Yu, F., and Yim, W.W.S., 2009. An evolutionary model for the holocene formation of the pearl river delta, china. Holocene, 19: 129-142. https://doi.org/10.1177/0959683608098957
To share on other social networks, click on any share button. What are these?


