Simple Markov Model for Estimating the Growth of Nonreligion in the United States


Research Note
Special Issue: Atheism, Secularity, and Science
Simple Markov Model for Estimating the Growth of Nonreligion in the United States
John Stinespring, Ryan T. Cragun*
The University of Tampa, 401 W Kennedy Blvd, Tampa, FL 33606, USA.
Abstract | The authors develop a simple Markov model to forecast future rates of religious nonaffiliation. A two-period, two-variable Markov switching model is used which yields a tractable steady state solution and growth path for the share of the population that is nonreligious. The model setup and solution are shown to be both intuitive and determined by three parameter values. The authors illustrate its use by estimating these parameter values using biannual data from the 1973 to 2012 General Social Surveys (GSS). The parameter estimates from the first half of the GSS data series, 1973-1991, provide a good fit to the 1993-2012 data. Calibrating the model to the latter half of the data, 1993-2012, produces a forecast range of between 26% and 47% of the US population being nonreligious by the year 2042.
*Correspondence | Ryan T. Cragun, The University of Tampa, Tampa, FL 33606, USA; Email: [email protected]
Citation | Stinespring, J., R. T. Cragun. 2015. Simple Markov Model for estimating the growth of nonreligion in the United States. Science, Religion and Culture, 2(3): 96-103.
DOI | http://dx.doi.org/10.17582/journal.src/2015/2.3.96.103
Guest Editors | John R. Shook PhD, Ralph W. Hood Jr. PhD, and Thomas J. Coleman III
Introduction
Religions in the US are now experiencing a dramatic loss of market share to the nonreligious. Recent decades have witnessed rapid growth of those who identify as nonreligious in the US. In 1990, just 7% of Americans reported no religious affiliation (Kosmin et al., 2009). By 2001, the number had doubled to 14%, and by 2012, 20% of Americans reported they had no religious affiliation (Hout, Fischer, and Chaves, 2013; Lugo et al., 2012).1 The result is a significant restructuring of the religious marketplace in the US, which has long been dominated by Protestants, who no longer make up the majority in the US (Lugo et al., 2012).
Will the rise of the nonreligious continue in the US? In the past several years, a number of scholars have projected religious trends into the future, using a variety of different models. Within the social sciences, the work of Kaufmann and colleagues has received the greatest attention. In 2008, Kaufmann proposed that the differences in birth rates between the religious and nonreligious were so substantial that simply through reproductive momentum, the religious would reverse secularization globally (a finding recently echoed by a report by Pew Research Center 2015). In 2010, Skirbekk et al. projected the religious composition of the US until 2043, taking into consideration fertility, migration, intergenerational transmission of religion, and switching within religions, and argued that the nonreligious would increase just 1%, from 16% of the US population to 17% by 2043. Kaufmann, Goujon, and Skirbekk argued in 2011 that the reproductive momentum of the religious in Europe could reverse secularization there as well, resulting in higher levels of religiosity by the end of the 21st century than at the beginning. While the inclusion of a number of factors that are related to religiosity in their models makes sense, it is apparent that the projections Kaufmann and colleagues have made in the US regarding the nonreligious were off target. Just two years after they published their projections, 2012, the nonreligious had gained another 4% of the religious market, rising to 20% of the US population. Given the further light and knowledge that we now have about the continued rise of the nonreligious in the US, the above models of religious growth and decline should be revisited.
Most similar to the model proposed herein, Abrams, Yaple, and Wiener (2010) proposed a mathematical model of competition between religion and nonreligion to project religious market share into the future. Key to their model was a somewhat arbitrarily assigned value reflecting how attractive religion or nonreligion is. They based this value on market share as well as the “perceived utility of the group”, which they argued reflects “many factors, including the social, economic, political, and security benefits derived from membership as well as spiritual or moral consonance with a group” (p. 1). They tested their model using census data from 85 regions of 9 countries (Australia, Austria, Canada, the Czech Republic, Finland, Ireland, the Netherlands, New Zealand, and Switzerland) and concluded that the nonreligious would continue to grow following a trajectory that approximated a logistic curve and ends at nearly 100 percent nonreligion. In the Netherlands, for instance, they projected that 78% of people would be nonreligious by 2050.
We propose a simple, yet robust, model that predicts a more balanced ratio of religion to nonreligion in the population. We model the religious and nonreligious as two groups competing for market share. Each group attempts to expand its market share by maintaining its current membership while converting members of the other group. This competition is modeled as a Markov switching process where membership changes over time based on the rates of religious conversion and leaving, which are the only inputs into the model. Data from the General Social Surveys (GSS) indicate that the growth in nonreligion is almost entirely explained by these switching rates. In fact, a regression analysis indicates that 89% of the variation of the ratio of religious to nonreligious is explained by the yearly conversion rate alone.2 Though birth rates, religion in which one is raised, immigration, and race/ethnicity all influence religious affiliation, past switching rates alone (which implicitly capture these other factors) are a stronger predictor of shifts in affiliation. The solution to the model provides easily-interpretable steady state market shares of nonreligion and religion and the time path to arrive at the steady state. The factors affecting final shares and the speed of convergence are tractable and intuitive. For these reasons, we recommend the model as a good first-cut or back-of-the-envelope model for social scientists to use.3
The Mathematical Model
Markov switching models are used in many social science fields. A common example from economics involves a duopoly (two-firm market) in which two firms produce a good and compete for market share from one another. The market share for each firm depends upon the particular time period. By specifying the per-period switching and retention rates along with the initial market shares, the Markov model can reveal the trend of market share over time and the eventual steady state market share for each firm. For religion, we define the population share of the nonreligious at time t as nrt and for the religious as rt. The proportion of nonreligious retained per period is s11. This is the percentage of nonreligious in t-1 who did not convert. The proportion of religious retention per period is s22. The leaving rate, the proportion of religious in t who left religion (i.e., were religious in the previous period), is s12 while the conversion rate, the proportion who converted in t after being nonreligious in t-1, is s21. Note that s11 + s21 = 1 and s12 + s22 = 1. As such, the switching rates are the only inputs required for the model and the solution is written in terms of those parameters. This period’s proportions of nonreligious and religious are given by
nrt = s11nrt-1 + s12rt-1 ....…… (1a)
rt = s21nrt-1 + s22rt-1 ……….(1b)
given nr0 and r0
where nr0 represents the initial nonreligion share and r0, the initial religion share.
The solution to the system of equations in (1a-b) consists of two time paths given as functions of time, the switching rates, and the initial percentage of nonreligious, given by

![]()
Each equation in (2a-b) takes the general form
sharet = final share –[share gap](gap adjustment)… (3)
The final share represents the market share to which a society converges. The final share for nonreligion (religion) is the leaving rate (conversion rate) over the total rate of switching (i.e., the conversion rate plus the leaving rate). Logically, then, the final share for nonreligion (religion) is positively related to the leaving rate (conversion rate) and negatively related to the conversion rate (leaving rate).4, 5 If the conversion and leaving rates were equal (s12 = s21) or, equivalently, the retention rates are equal (s11 = s22), the final shares would be equal at 50% for religion and nonreligion.
The share gap is the gap between one’s final share and initial market share. The negative sign in front of the gap indicates the gap between initial and final shares decreases over time. If the initial market share is equivalent to the steady state share, the share gap will be zero and no transition will occur. The speed at which the gap decreases is determined by the gap adjustment term, given as 1 minus the total switching that occurs. The higher the switching rates, the faster the convergence. The gap adjustment decreases over time, approaching zero because it is raised to the t power, implying religion and nonreligion monotonically converge to their final share values over time.6, 7
Table 1: Descriptive statistics for four religious/nonreligious switching/non-switching categories
|
Always Religious |
Converted to Religion |
Left Religion |
Never Religious |
|
|
Mean |
0.877780 |
0.022698 |
0.075587 |
0.023935 |
|
Median |
0.902623 |
0.021725 |
0.062778 |
0.017449 |
|
Maximum |
0.922460 |
0.037209 |
0.148545 |
0.049500 |
|
Minimum |
0.768760 |
0.011708 |
0.050859 |
0.007237 |
|
Std. Dev. |
0.046642 |
0.007272 |
0.026917 |
0.014701 |
|
Jarque- BeraProb |
0.100161 |
0.352991 |
0.029452 |
0.155709 |
|
Observations |
28 |
28 |
28 |
28 |
N = 53,589 from 1973-2012
Data
Estimates of the switching parameters s12 and s21 for the U.S. are calculated from the 1973-2012 General Social Survey (GSS). The GSS asked respondents for both their current religious affiliation and their affiliation at age 16. Responses are separated into four categories: those who were religious at 16 and stayed religious (“always religious”), those who were religious at 16 but later left religion (“left religion”), those who were not religious at 16 but converted (“converted to religion”), and those who were not religious at 16 and remained non-religious when surveyed (“never religious”).8 The descriptive statistics for the categories are shown in Table 1.
The dynamics of conversion and leaving are shown in Figure 1 where the percentage of those who left religion grew from 5.35% of the population in 1973 to 14.85% in 2012. Those who had converted to religion grew a modest 1.47%, to 3.47% of the population over the same period.
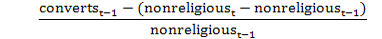
To create the switching parameters, we must convert religious leavers and converters from percentages of the entire population to percentages of the previously religious and previously nonreligious. The conversion rate, s21, is derived using
and the leaving rate, s12, is calculated as
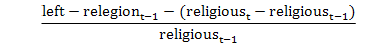
9 The data indicate that the switching parameters are converging over time with conversions declining as secularism is rising. Specifically, annual leaving rates, s12, rose from an average of 6% in the 1973-1991 period to 8% in 1993-2012, while annual conversion rates, s21, fell from 26% in the 1973-1991 period to 7% from 1993-2012.10
The factors that could influence the switching parameters are many. As mentioned, Abrams, Yaple, Weiner (2011) argue that the current size of share and perceived utility of membership determine switching rates. Hout and Fischer (2002) argue that political posturing, such as the aligning of the Republican Party with the Religious Right, which led liberals and progressives to disassociate from religion in symbolic protest, affects switching. Others suggest that this is, in fact, a reflection of the hotly debated secularization that has occurred in so many other developed countries around the world (Chaves, 2011; Norris and Inglehart, 2004; Bruce, 2002; 2013; Crockett and Voas, 2006; Cragun and Lawson, 2010; Gill and Lundsgaarde, 2004; Halman and Draulans, 2006; McAllister, 1988). Our model is agnostic with respect to reasons for switching and implicitly assumes many causes will cancel
Figure 1: Change in proportions of converts to religion, religious exiters, and the nonreligious, 1973-2012. (Source: GSS.)
Figure 2: Nonreligious share of US population, with predictions and calibrations
out one another. Our model assumes – perhaps problematically (see limitations section below) – that the factors that influence switching will be consistent over the period of prediction.
We can test the model with an in-sample forecast by calculating switching rates for the first half of the data set (1973-1991) to forecast the remainder of the sample (1993-2012) from the data. Figure 2 shows the calibrated fit to the data which compares favorably to the actual data (compare the Calibrated to Actual line). The calibrated model predicted that 19% of the US population would be nonreligious by 2010 given the average 1973-1991 switching values.
For the current forecasts, we consider a wide range of switching parameter values by calculating rates for both the full 40-year data period (from 1973-2012) and the most recent 20 years (1993-2012).11 The estimates of the conversion rate ranges from 0.175 in the overall 40-year period to 0.07 in the recent 20-year period, while the leaving rates range from 0.06 to 0.08, respectively.12, 13 Figure 2 also shows the projected growth of nonreligion over 30 years given these different switching regimes. The most rapid growth in nonreligion comes from the higher 20-year mean growth rate with the 7% conversion rate and 8% leaving rate (s11 = 0.92, s21 = 0.08, s22 = 0.93, s12 = 0.07) where nonreligion grows to approximately 47% of the population (the remaining 53% remain religious). Slower growth in nonreligion comes from the 40-year mean growth rate with a 17.5% conversion rate and 6% leaving rate (s11 = 0.825, s21 = 0.175, s22 = 0.94, s12 = 0.06) where nonreligion grows to approximately 26% of the population.
Limitations
Just as prior models projecting the growth of the religious and nonreligious into the future have had some limitations, so, too, does our model. Because the model relies exclusively on past rates of switching, it fails to explicitly take into consideration factors that may contribute to the rise of the nones or nonreligious. A number of these factors warrant consideration. For instance, those who leave religions in the US are more likely to leave some religions than others. Kosmin et al. (2009) noted that many of the nonreligious are former Catholics. Others (c.f. Bruce 2002; Stark and Glock 1968) have noted that many of those who leave religion also come from Mainline Protestant religions. Anonymous reviewers of an earlier draft of this paper suggested that it is important to take into consideration which religions Americans are leaving as some religions may have already shrunk to the point that they will no longer be able to contribute substantially to the growing nonreligious population. This is an important point. However, recent research (Sherkat 2014) finds that Americans are leaving all religions, with the exception of Native American religions. Sherkat’s findings suggest that, while religious exiting may have been concentrated among some religions in prior decades, increasingly it is the case that Americans are leaving all religions. If the rise of the nones was solely due to the decline of a single religion due to a particular crisis or controversy, our model would need to reflect that fact. But the rise of the nonreligious over the last three decades cannot be attributed to a single controversy or crisis but rather to a broad level trend – secularization (Bruce 2002, 2013; Cragun and Lawson 2010; Sherkat 2014).
Another factor to consider in projecting the growth of the nonreligious is the racial/ethnic makeup of the US population. Kosmin et al. (2009) found that the nonreligious were disproportionately White, and that Blacks and Hispanics were under-represented among the nonreligious. However, more recent research has found that a growing percentage of Hispanics are leaving religion (Jones, Cox, Navarro-Rivera 2013). Additionally, Asian Americans are now the fastest growing racial/ethnic group in the US and are also the least religious (Sherkat 2014). Taking into consideration the racial/ethnic makeup of the US would seem to be an important consideration when projecting the growth of the nonreligious.
These are important considerations. However, part of the utility of the Markov model we propose is that it relies on immediate past rates of switching. Those rates of switching will implicitly be reflective of both the religious and racial/ethnic makeup of the US in the immediate past. As a result, both the originating religions of those who leave and the racial/ethnic makeup of the population of interest are implicitly – rather than explicitly – included in the model. Relying on the immediate past growth allows for the refinement of switching projections in the future. In other words, while we projected the growth of the nonreligious into the future in this paper, we would strongly encourage readers and other scholars to update our projections using our model as new data become available. By continuously updating projections based on new data, not only will this allow future scholars to test the accuracy of our model and projections but will also help refine the model as every additional datum will improve the accuracy of the projections.
Discussion
The growth of the nonreligious in the US over the last twenty years has received a fair amount of attention (Chaves, 2011; Hout and Fischer, 2002: Kosmin et al., 2009). While a number of explanations for the growth of the nonreligious have been proposed (Chaves, 2011; Hout and Fischer, 2002; Hout and Fischer, 2002), only a few attempts have been made to project this growth into the future. The most widely cited projection (Skirbekk et al., 2010) has already been shown to be off target as the nonreligious have outpaced that projection. The other projection (Abrams et. al., 2010), while more closely aligned with our own, includes specific assumptions about how attractive religion and nonreligion are that can be problematic.
In contrast to earlier projections, the forecasting model developed in this paper has a setup and solution that are simple, intuitive, and robust. Only two parameters, rates of leaving and conversion, are required. The parameter estimates from the first half of the GSS data series, 1973-1991, provide an excellent fit to the 1993-2012 data. Calibrating the model to the latter half of the data, 1993-2012, produces a forecast range of between 26% and 47% of the US population being nonreligious by the year 2042. As is the case with all forecasts of future shifts in population characteristics, these projections are based on past data and conditions which can change. Yet, this simple Markov model aligns with current data, provides a range of possible trajectories for the nonreligious, includes only the assumption that recent trends in religious switching can be used to predict future trends, and can easily be extended based on new data. In short, our model is simple, parsimonious, and an improvement over prior models.
References
- Abrams, Daniel M., Haley A. Yaple, and Richard J. Wiener. 2010. A Mathematical Model of Social Group Competition with Application to the Growth of Religious Non-Affiliation. 1012.1375. Retrieved March 26, 2011 (http://arxiv.org/abs/1012.1375).
- Bruce, Steve. 2002. God Is Dead: Secularization in the West. London: Blackwell Publishers.
- Bruce, Steve. 2013. Secularization: In Defence of an Unfashionable Theory. Oxford: Oxford University Press.
- Chaves, Mark. 2011. American Religion: Contemporary Trends. Princeton University Press.
- Cragun, Ryan T., and Ronald Lawson. 2010. The Secular Transition: The Worldwide Growth of Mormons, Jehovah Witnesses, and Seventh-Day Adventists. Sociology of Religion 71(3):349-373. http://dx.doi.org/10.1093/socrel/srq022
- Crockett, Alasdair, and David Voas. 2006. Generations of Decline: Religious Change In Twentieth-Century Britain. Journal for the Scientific Study of Religion.
- Gill, Anthony, and Erik Lundsgaarde. 2004. State Welfare Spending and Religiosity: A Cross-National Analysis. Rationality and Society 16(4):399-436. http://dx.doi.org/10.1177/1043463104046694
- Halman, Loek, and Veerle Draulans. 2006. How Secular Is Europe? The British Journal of Sociology 57(2):263-88. http://dx.doi.org/10.1111/j.1468-4446.2006.00109.x
- Hout, Michael, and Claude S. Fischer. 2002. Why More Americans Have No Religious Preference: Politics and Generations. American Sociological Review 67(2):165-90. http://dx.doi.org/10.2307/3088891
- Hout, Michael, Claude S. Fischer, and Mark A. Chaves. 2013. More Americans Have No Religious Preference: Key Finding from the 2012 General Social Survey. Berkeley, CA: Institute for the Study of Societal Issues. Retrieved (http://issi.berkeley.edu/sites/default/files/shared/docs/HoutetalNoRelig2012ReleaseMar2013.pdf).
- Jones, Robert P., Daniel Cox, and Juhem Navarro-Rivera. 2013. 2013 Hispanic Value Survey: How Shifting Religious Identities and Experiences are Influencing Hispanic Approaches to Politics. Washington DC. Public Religion Research Institute. Retrieved (http://publicreligion.org/site/wp-content/uploads/2013/09/2013_HVS_FINAL.pdf).
- Kaufmann, Eric. 2008. Human Development and the Demography of Secularization in Global Perspective. Interdisciplinary Journal of Research on Religion 4(1).
- Kaufmann, Eric, Anne Goujon, and Vegard Skirbekk. 2011. The End of Secularization in Europe?: A Socio-Demographic Perspective. Sociology of Religion.
- Kosmin, Barry A., Ariela Keysar, Ryan T. Cragun, and Juhem Navarro-Rivera. 2009. American Nones: The Profile of the No Religion Population. Hartford, CT: Institute for the Study of Secularism in Society and Culture.
- Lugo, Luis, Alan Cooperman, Cary Funk, and Gregory A. Smith. 2012. Nones on the Rise: One-in-Five Adults Have No Religious Affiliation. Washington, D.C.: The Pew Forum on Religion & Public Life. Retrieved June 3, 2013 (http://www.pewforum.org/Unaffiliated/nones-on-the-rise.aspx).
- McAllister, Ian. 1988. Religious Change and Secularization: The Transmission of Religious Values in Australia. Sociological Analysis 49(3):249-63. http://dx.doi.org/10.2307/3711588
- Norris, Pippa, and Ronald Inglehart. 2004. Sacred and Secular: Religion and Politics Worldwide. Cambridge University Press. http://dx.doi.org/10.1017/CBO9780511791017
- Pew Research Center. 2015. The Future of World Religions: Population Growth Projections, 2010-2050: Why Muslims Are Rising Fastest and the Unaffiliated Are Shrinking as a Share of the World’s Population. Washington DC. http://www.pewforum.org/files/2015/03/PF_15.04.02_ProjectionsFullReport.pdf
- Sherkat, Darren. 2014. Changing Faith: The Dynamics and Consequences of Americans’ Shifting Religious Identities. New York: NYU Press.
- Sherkat, Darren E. 2008. “Beyond Belief: Atheism, Agnosticism, and Theistic Certainty in the United States.” Sociological Spectrum 28(5):438–59. http://dx.doi.org/10.1080/02732170802205932
- Skirbekk, Vegard, Eric Kaufmann, and Anne Goujon. 2010. Secularism, Fundamentalism, or Catholicism? The Religious Composition of the United States to 2043. Journal for the Scientific Study of Religion 49(2):293-310. http://dx.doi.org/10.1111/j.1468-5906.2010.01510.x
- Stark, Rodney and Charles Y. Glock. 1968. American Piety. Berkeley: University of California Press.
Endnotes
[1] These figures come from GSS data. The American Religious Identification Survey (ARIS) data gives roughly the same figures with US nones comprising 8.2% of the population in 1990, 14.1% in 2001 and 15.0% in 2008.
[2] Regression results available upon request.
[3] The simple setup of our model is recommended for reasons beyond tractability and ease-of-use. Many of the factors included in more complicated models may cancel out one another. For example, our model does not include immigration measures or birth rates within different religions. Though these may be important determinants of religious affiliation on their own, it is interesting to note that the percentage of nonreligious legal immigrants in 2003 (and legal immigrants are more likely than illegals to respond to religion surveys) was 16.8%, similar to the resident percentage of 17% that year. In addition, birth rates typically decline for all groups as incomes rise and higher income is associated with lower levels of religiosity.
[4] The positive impact of the leaving rate (conversion rate) for nonreligion (religion) is proven through the partial derivative of the function with respect to s12 (s21),
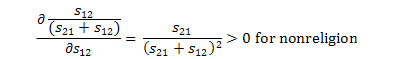
and
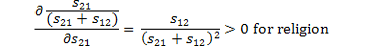
The negative impact of the conversion rate (leaving rate) for nonreligion (religion) is proven in the same manner.
[5] Each final share can also be viewed as positively related to that group’s retention rate, shown for nonreligion (religion) by substituting s21 = 1 – s11 (s12 = 1 – s22) into final share for 2a (2b).
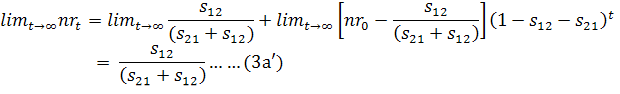
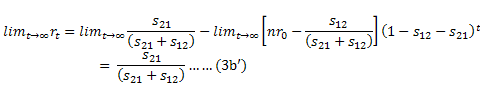
[6] This is shown mathematically by taking the limit of 2a and 2b as t goes to infinity:
[7] The gap adjustment is always less than one and positive for all reasonable parameter values; i.e., 0 < (1 – s12 – s21) < 1.
[8] These questions from the GSS form the standard survey data to project religious trends and affiliation as used in Hout, Greeley, and Wilde (2001), Sherkat (2008), and Skirbekk et al. (2010) among others.
[9] Variants of this equation include

and

and give similar values.
[10] These results are similar to those of Sherkat (2008), and Skirbekk et al. (2010). Sherkat shows nonreligious retention rising for both sample periods and cohorts. The retention rate of the nonreligious rose from 35.8% in the 1973-82 sample (a yearly loss of 9.8% over 10 years) to 43.8% in the 1983-1990 sample (a yearly loss of 9.8% over 8 years), and up to 54.5% in the 1991-98 sample (a yearly loss of 7.3% over 8 years). This comports with the 55.9% retention provided in Skirbekk et al. (2010) for 2000-2006 GSS data (a yearly loss of 8.0% over 7 years). Examining cohorts shows retention rates of 25.1% for those born between 1925-43 to 43.4% for the 1944-55 cohort, to 64.0% for the 1956-80 cohort (though the last cohort is younger and thus has had less time to switch) (Sherkat, Table 1, 2008). Those raised nonreligious rose from 3.2% of market share in the 1973-82 sample (switching raised it to 7.3% of the market) to 3.9% in the 1983-1990 sample (switching raised it to 7.7% of the market) to 5.0% in 1991-98 sample (switching raised it to 10% of the market).
[11] One cannot use (nonreligioust / nonreligoust-1) because this would often lead to proportions exceeding 1 because sample sizes change each year. To counter this, previous year converts are netted out. Variants of this ratio were also tried including [(nonreligoust - convertst)/ nonreligioust-1] and [(nonreligioust-1 - convertst-1)/ nonreligioust-1] and each gave a similar value.
[12] Aggregation conditions requiring s11 + s21 = 1 indicate the percentage of last period’s nonreligious that converted, s21, must be 1 – s11. These conditions imply s21 = 0.825 and 0.93 over the 40-year and 20-year periods, respectively.
To share on other social networks, click on any share button. What are these?