Seasonal Diversity and Distribution Patterns of Birds in Agricultural Landscapes of Gujrat, Pakistan
Seasonal Diversity and Distribution Patterns of Birds in Agricultural Landscapes of Gujrat, Pakistan
Muhammad Umar1*, Mubashar Hussain1 and David C. Lee2
Seasonal species richness (± SE) of feeding guilds in the study area from April 2017 to March 2019.
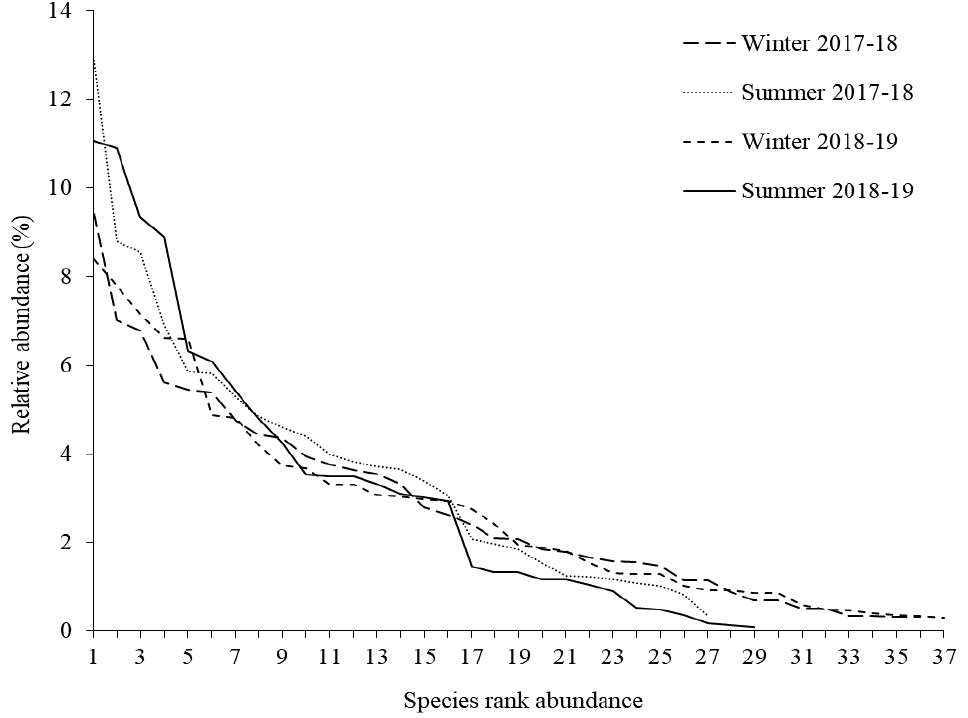
Whittaker plot (rank abundance) of seasonal species’ relative abundances.
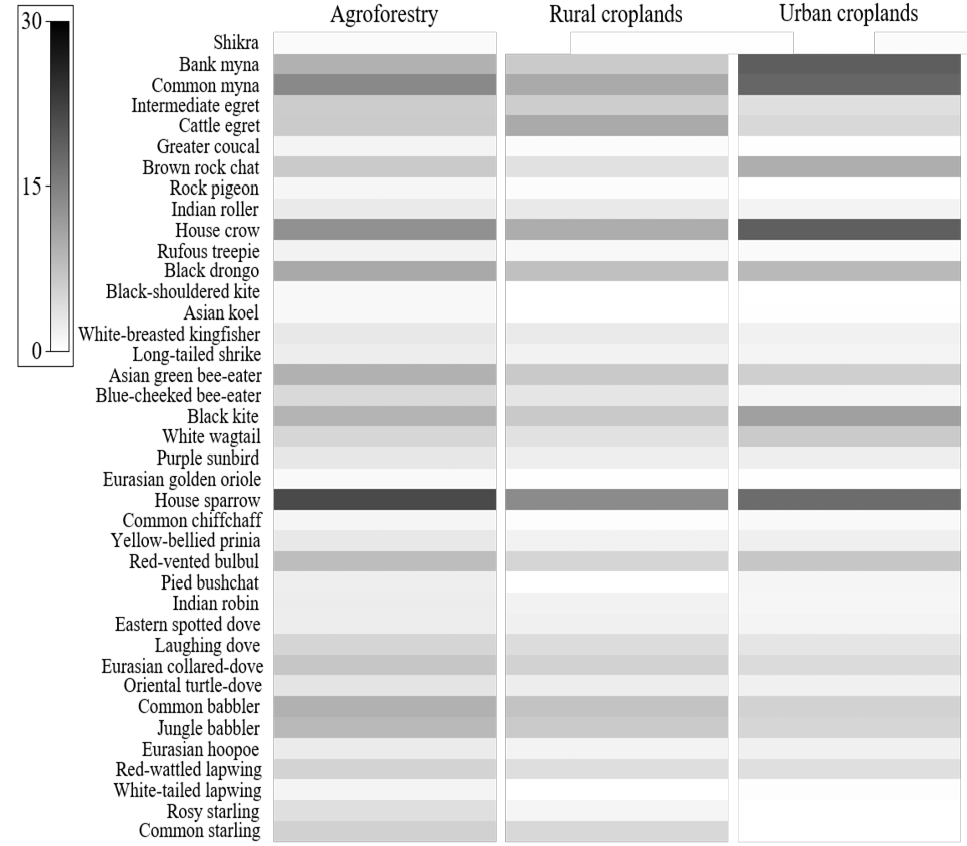
Shade plot of average species abundances from the three different habitat types.
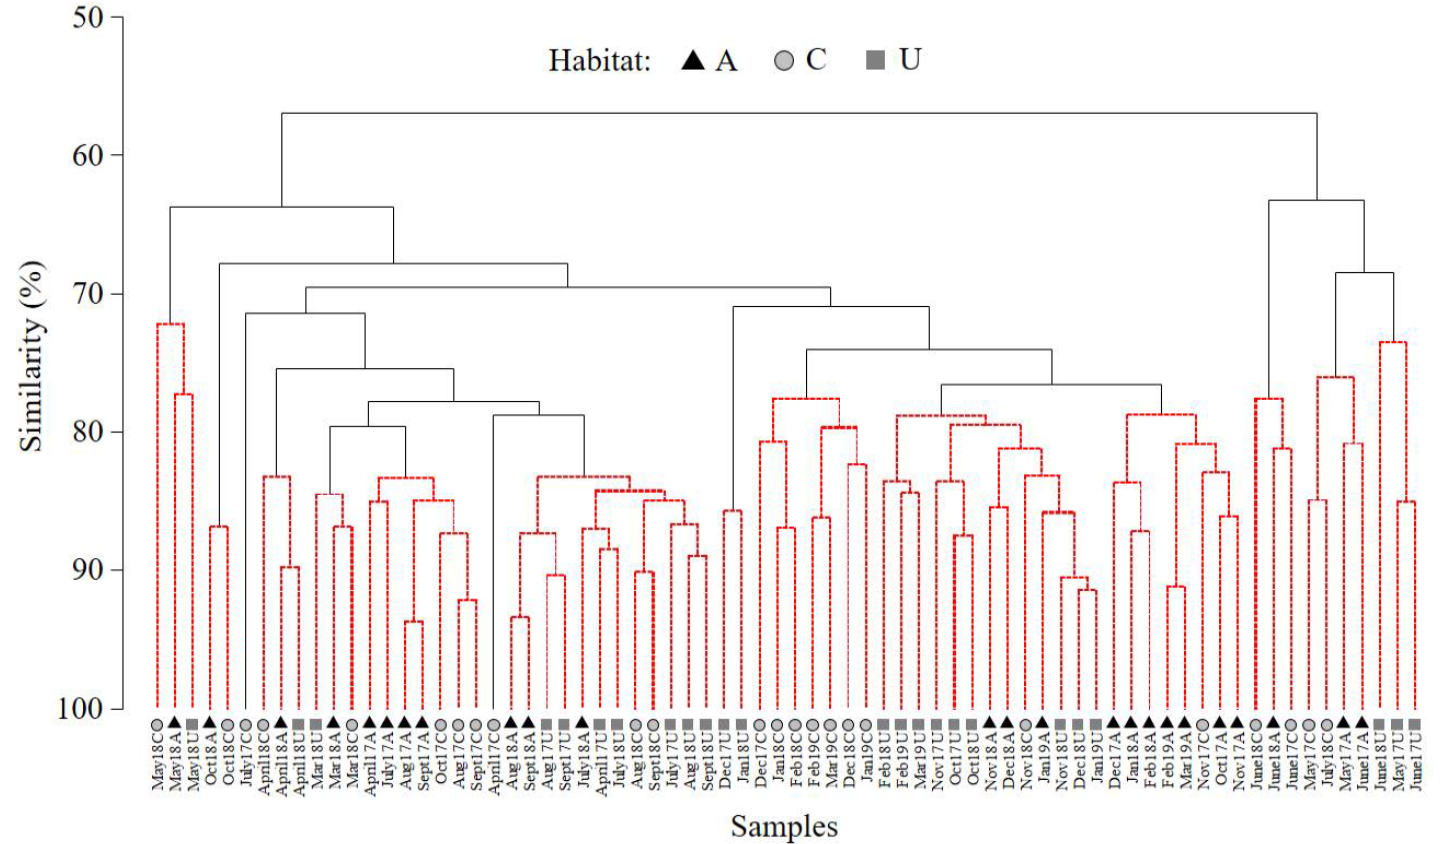
Cluster analysis dendrogram of monthly bird community samples from the three habitats from April 2017 to March 2019. Clusters are based on Bray-Curtis similarities, with distinct sample clusters depicted by black branches.
nMDS ordination of monthly bird community samples from the three habitats from April 2017 to March 2019. Samples are circled based on Bray-Curtis similarities of 40, 60 and 80%. Vectors are included for species with strong correlations (rp > 0.70) with the ordination of bird communities.


