
Revising Fertilizer Subsidy and Taxes Policy for Reducing Cost of Production of Major Crops in Pakistan


Research Article
Revising Fertilizer Subsidy and Taxes Policy for Reducing Cost of Production of Major Crops in Pakistan
Abid Hussain1*, Muhammad Azeem Khan2, Muhammad Anjum Ali Buttar3, Umar Farooq4, Muhmmad Islam5 and Zahid Ullah Khan1
1Social Sciences Research Institute Agricultural Economics Research Institute (SSAERI), National Agricultural Research Centre (NARC), Islamabad, Pakistan; 2National Agricultural Research Centre (NARC)/ Planning Commission of Pakistan, Islamabad, Pakistan; 3Plant Sciences Division (PSD), Pakistan Agricultural Research Council (PARC), Islamabad, Pakistan; 4Social Sciences Division (SSD), Pakistan Agricultural Research Council (PARC), Islamabad, Pakistan; 5National Fertilizer Development Centre (NFDC), Islamabad, Pakistan.
Abstract | Reduction in cost of production to make agriculture profitable is a major challenge and all out efforts have been made by successive government in Pakistan to pass benefits to the farmers by reducing input prices through reduction in GST, providing cash subsidy and supplying inexpensive feed gas for fertilizer industry. Currently, cash subsidy on urea is costing Rs. 12 billion to national exchequer and total tax relief (all products inclusive) costing around Rs. 40 billion to the national exchequer, respectively. Thus, total financial implication of subsidy and tax relief is Rs. 52 billion. In the existing tax regime tax rates vary greatly from 3.55% (SSP) to 11.73% (NPK). Due to these distortions farmers prefer to use higher dosages of Urea and low grade P-based fertilizers. This anomaly is negatively affecting productivity of major crops in general and high value crops in particular. Presently average weighted tax rate on all fertilizers is 5.83 percent. The imposition of uniform tax rate of 5% on all fertilizers, without cash subsidy on urea will reduce financial implication to Rs. 43 billion and at 2% tax rate financial implication will be Rs. 53.7 billion per annum. Imposition of uniform tax rates will result into decrease in market prices of fertilizers, consequently their use will be higher and balance among nutrients application will improve. The Imposition of uniform tax rate of 2% will reduce fertilizer cost for production of major crops by; 18% for wheat, 13% for rice, 20% each for cotton and sugarcane. Modest increase in crop productivity by just 5% could result in additional production of major crops (wheat, rice, cotton, sugarcane and maize) of worth Rs. 111.57 billion. While, existing production levels of major crops can be obtained by reducing area under these crops by 859 thousand hectares, and spared area can be brought into cultivation under high value crops to diversify the cropping systems.
Received | January 25, 2018; Accepted | November 01, 2018; Published | November 23, 2018
*Correspondence | Abid Hussain, Social Sciences Research Institute Agricultural Economics Research Institute (SSAERI), National Agricultural Research Centre (NARC), Islamabad, Pakistan; Email: [email protected]
Citation | Hussain, A., M.A. Khan, M.A.A. Buttar, U. Farooq, M. Islam and Z.U. Khan. 2018. Revising fertilizer subsidy and taxes policy for reducing cost of production of major crops in Pakistan. Sarhad Journal of Agriculture, 34(4): 870-879.
DOI | http://dx.doi.org/10.17582/journal.sja/2018/34.4.870.879
Keywords | Fertilizers, Subsidy, Taxes, Crops, Balanced use, Pakistan
Introduction
With contribution of thirty-seven percent in the agricultural GDP, crop sector is the main pillar of Pakistan’s’ agricultural economy. Livelihood of rural population of country’s approximate 59% of the total population directly or indirectly depends upon the crop farming. Five major crops namely, wheat, rice, maize, sugarcane and cotton share 23.85 percent of the value added in agriculture and 4.66 percent of the GDP. These crops exhibited a growth rate of 3.02 percent during the fiscal year 2016-17. Minor crops share 11.03 of the value added in overall agriculture and 2.15 percent in the GDP. Thus, the sub-sector has significant importance in economic wellbeing of the people (Pakistan Economic Survey, 2016-17). Fertilizers are used to improve soil fertility and have been considered most efficient and cost-effective input to increase crop productivity (Tiwari, 2007). In Pakistan, total fertilizer off-take has increased considerably overtime. It has increased from 2966 thousand nutrient tones in 2000-01 to 3699 thousand nutrient tones in 2015-16, by 24.7 percent. While total fertilizer off-take in the year 2014-15 was the highest in the history of the country (4316 thousand nutrient tones). Thus, a decrease of 14.3% in total off-take occurred in 2015-16 compared to the year 2014-15 (PES, 2016-17). Fertilizer use has a positive and significant relationship with agricultural GDP of the country (Rehman et al., 2016). The government subsidized nitrogen and phosphatic fertilizers under through Kissan Package. Consequently, during 2016-17 nitrogen (N), phosphate (P) and potash (K) take-off jumped by 30.9, and 17.4 and 55.0 percent respectively during fiscal year 2015-16 (Planning Commission of Pakistan, 2017).
In Pakistan use of fertilizers is low relative to the total uptake by plants, hence there is a net depletion of nutrients into the soil. Animal dung is used as fuel, and cow crop straw is used for animal feed instead of ploughing back into the soil, thus soils overtime have become deficient in the organic matter contents that adversely impact crop yields (Afzal and Ahmad, 2009). In addition, due to rain, farm yard manure heaped on the outskirts results in nutrient loss (PILdAT, 2015). In the country, 56% and 44% of the fertilizers are consumed in Rabi and Kharif seasons, respectively. Punjab is the largest consumer of fertilizer (69%), followed by Sindh (23%), KP (5%) and Blaochistan (3%). In the country, about 50% fertilizers are used for wheat crop, whereas rice, cotton, maize and sugarcane shares14, 15, 7 and 8 percent in fertilizers’ use (Afzal and Ahmad, 2009). Urea fertilizer is mainly produced in the country. In the year 2014-15, DAP, Urea and other fertilizers shared 55, 42 and 3 percent total imports of fertilizers (ASP, 2014-15). Fertilizer use of 119 kg per hectare of arable land is the lowest in the region. Fertilizer use in China, Bangladesh and India are 420, 278 and 158 kg per hectare of arable land, respectively (FAI, 2016). Fertilizer consumption in relation to cultivated area in the country is 155 kg per hectare, which is almost half than in Netherland (291 kg per hectare) and one-third than in Egypt (446 kg per hectare), (ASP, 2014-15).
Furthermore, the use of fertilizers is quite highly unbalanced in the country compared to other nations in the world. Average use of N, P and K nutrients in the world is 60, 22 and 18 percent, respectively. While, in Pakistan share of N, P and K nutrients in total off-take is about 72, 27 and even less than one percent, respectively (NFDC, 2016). The knowledge of the farmers about the right fertilizers’ mix and quantities is extremely poor. Phosphatic fertilizer (DAP) is frequently adulterated (PILdAT, 2015). Higher fertilizer prices and depressed commodity prices are the main reasons of low and unbalanced use of fertilizers in the country (Quddus et al., 2008). This resulted in the loss of soil texture, low input use efficiency, reduction in crop yield and farm income. Use of nitrogenous fertilizer is high due to relatively low prices as well as rapid crop response. There is a slow and steady increase in use of phosphatic fertilizers. However, application of potash has been discouragingly low (Wakeel, 2015). Prices of phosphatic fertilizer were kept low until 2007, thereafter prices increased significantly that resulted substantial decrease in the usage of phosphatic fertilizer.
Successive government supported farming community to increase use of fertilizer. The policy measures adopted include supply of inexpensive feed gas for fertilizer industry, provision of cash subsidy and reduction in GST. Pursuant to the announcement in the Federal Budget, 2016-17, the Federal Government decided to maintain prices of Urea up to Rs. 1400 per bag. While, prices of Urea were Rs. 1790 per bag including tax of Rs. 262 per bag (17 % of base price at that time i.e. Rs. 1530 per bag) by the end of financial year 2015-16. In year, 2016-17 tax rate on Urea was reduced to five percent which resulted into tax relief for the farmers of Rs. 184 per bag. Moreover, government announced cash subsidy on the Urea of Rs. 156 per bag. Fertilizer companies also reduced prices of the Urea by Rs. 50 per bag. Thus, market prices of Urea came down by 22 percent (from Rs. 1790 per bag in 2015-16 to Rs. 1400 per bag in year 2016-17) which resulted in increase in use of the fertilizer (NFDC, 2017). Further, increase in use of fertilizers will depend on reduction in absolute or relative price of fertilizer to prices of agricultural produce (Quddus et al., 2008).
During financial year 2016-17, subsidy on phosphate fertilizer was paid to the companies supplying fertilizers after the verification of sale proceeds by the provincial agriculture departments. This mechanism proved time consuming, which resulted in delayed payment of subsidy to fertilizer companies. In the Federal budget 2017-18, subsidy disbursement mechanism was simplified to direct reduction in taxes on DAP, NP, NPK, SSP and CAN fertilizers. While, anomalies arose due to P-based tax exemptions that resulted variant tax rates for different fertilizers having multi-nutrients for crop growth. Low grade fertilizers like SSP became cheaper as tax rate is only 3.55 percent, while high grade fertilizers like NP and NPK remained relatively costly with taxes rates of 9.75% and 11.73%, respectively. Due to these distortions farmers prefer to purchase Urea and low grade P-based fertilizers. They use higher dosages of these fertilizers compared to high grade phosphatic and potash containing fertilizers. This anomaly is negatively affecting yields of major crops in general and high value crops in particular. Presently, average weighted tax rate on all fertilizer products is 5.83 percent. Government is still providing subsidy on Urea fertilizer (Rs. 100 per bag), that equate to government’s financial obligation of Rs. 12.0 billion per annum. The mechanism of providing subsidy after the sale of bagged fertilizer on the basis of sales tax invoice and sales tax returns submitted by the manufacturers to FBR on monthly basis is cumbersome and time consuming. There is urgent need to revisit fertilizer subsidy and taxes policy to substitute subsidies with taxes completely, with a view to reduce input cost and encourage balanced use of fertilizers. In this perspective existing policy has been analyzed in depth with following specific objectives; to find out financial implications of different tax rates on the state revenue collection; to determine prices of fertilizer products at different tax rates; and to study the effect of reduced/ uniform taxes on fertilizer cost of major crops.
Materials and Methods
The study is based on the most recent information compiled from different pertinent sources, including Ministry of National Food Security and Research (Ministry of NFS and R); Ministry of Finance, Revenue and Economic Affairs; National Fertilizer Development Centre (NFDC); Agriculture Policy Institute (API), Federal Board of Revenue (FBR) and Pakistan Bureau of Statistics. First to clearly understand fertilizer subsidy and taxation scheme, product wise details of fertilizer off-take and subsidy for the year 2016-17 based on actual sale proceeds of the fertilizer companies are obtained from Ministry of NFS and R. Information about base prices for 17% General Sales Tax (GST) and sales tax relief (Tr) during fiscal year (2017-18) are acquired from FBR and Fertilizer Industry. Thereafter, values of effective sales tax (Te) current sales tax and it’s in percent terms are determined by the following formula to highlight anomalies in taxation. Where Pb is base price of individual fertilizers.
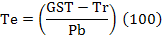 …….(1)
Financial implications of fertilizer subsidy scheme for financial year 2016-17 are estimated. Then, financial implications of existing fertilizer subsidy scheme (2017-18) are figured out and compared with previous year’s fertilizer subsidy scheme. These are based on projected off-take of fertilizers. There is general decrease in fertilizer off-take in current financial year, thus projected figures are considered quite low than that of last financial year. Similarly, financial implication of different uniform tax rates (1% to 5%) for all fertilizer on state revenue collection are estimated based on projected off-take for the year 2017-18. Thereafter, prices of fertilizers with proposed tax rates of 2% and 5% and weighted average tax rate (5.83%) are calculated. Financial implication of fertilizer subsidy scheme for fiscal year 2016-17 and uniform tax rates on the revenue collection are determined by Expression (2). First, fertilizer take-offs by types of fertilizers were converted from million ton to million bags (Ft) by multiplying these by 20, as number of 50 bags weighing 50 kg each in once ton equals to twenty. Then these were multiplied by effective tax rates (Te) and divided by 1000 to determine financial implication or revenue collection (Rev Te) in billion rupees for the year 2016-17. Therefore, to calculate implication of uniform and weighed tax rates on the state revenue collection (Rev Tu) Expression (3) was used. New prices (Pn) of fertilizers at proposed uniform tax rates are determined by Expression (4).

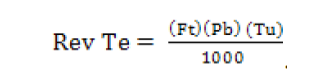
Where; Ft To is take-offs of individual fertilizers; Bp, Pb is base price of individual fertilizers; Tu is uniform weighed tax rates.

Keeping these prices in view, impacts of conversion of subsidy disbursement scheme into tax relief in the Federal budget 2017-18, proposed imposition of uniform tax rates of 2% and 5% on cost of fertilizer use in production of major crops viz. wheat, rice, seed-cotton and sugarcane are determined. Fertilizer cost of major crops per acre (Fc) e are calculated by Expression (5), by multiplying quantity (bags) applied per acre (Uf) with new prices (Pn) to determined effects of reduced / uniform tax rates on cost of production of these crops on per mound (40 kg) basis.

The effect of modest increase in productivity of major crops (5%) on per unit cost of production due to balanced use of fertilizers, that may result with imposition of uniform tax rates on all fertilizer products are estimated. Thereafter, value of additional production of major crops (wheat, rice, cotton, sugarcane and maize) is determined. Finally, few workable recommendations are put forward for policy planning.
Results and Discussion
Table 1 contains detailed data about subsidy on different fertilizer products in year 2016-17, base prices used by FBR for calculations of 17% GST in the year 2017-18, current sale tax exemptions and tax rates. In the year 2016-17, subsidy on different fertilizers was ranged from Rs. 88 (CAN) to Rs. 300 (DAP) per 50 kg bag. In case of Urea there was also a tax relief of Rs. 184 per bag, while sales tax on Urea before 1st July 2017 was Rs. 67 per bag. With effect from 1st July, 2017 subsidy on fertilizers was converted into tax relief. Seventeen percent GST on other fertilizers was ranged from Rs. 186 per bag (CAN) to Rs. 438 (NPK-III). While, when subsidy on P-based fertilizers was converted into tax relief to ease the cumbersome and time consuming mechanism of its distribution, effective sales tax ranged from the lowest of 3.55% (SSP) to the highest of 13.23% (NPK-III). Thus, anomalies resulted into cheap prices for low grade SSP fertilizer, while high grade fertilizes like NP and NPK remained relatively costly with average tax rates of 9.75% and 11.73%. As already stated these prices distortions are negatively affecting crop productivity.
Reduction in cost of production to make agriculture profitable is a major challenge, an all-out effort have been made to pass benefits to the farmers by reduction in input prices through reduction in GST, provision of cash subsidy and inexpensive feed gas for fertilizer industry. This reduction in input prices especially fertilizers have been applauded by the farming community. Therefore, it was decided in the Federal Budget 2016-17 to maintain prices of Urea up to Rs. 1400 per bag. It was advised that fertilizer subsidy scheme will remain a federal government initiative in financial year 2017-18 and Finance Division will issue required notifications to ensure uniformity in domestic pricing. It has been clarified that cash subsidy on urea fertilizer at the rate of Rs. 100 per bag will be provided after the sale of bagged fertilizer on the basis of sales tax invoice and sales tax returns submitted by the manufacturers to FBR on monthly basis.
Financial implication of subsidy scheme for the last financial year (2016-17) based on actual offtake figures of Ministry of NFS and R are presented in Table 2. Budgetary expenditures in the form of cash subsidy during 2016-17 were Rs. 37.76 billion. While, total revenue loss to the state due to sales tax relief on Urea fertilizer at the rate of Rs. 184 per bag were Rs. 23.75 billion. Thus, total financial implications of subsidy scheme for the year 2016-17 were Rs. 61.51 billion, excluding implicit subsidy in the form of cheap feed gas to fertilizer industry.
Similarly, financial implications of subsidy scheme for the year 2017-18 based on projected off-take and keeping in view conversion of cash subsidy into tax relief are presented in Table 3. Presently, along with tax relief on Urea fertilizer, there is also a subsidy of Rs. 100 per bag. Projected off-take for the Urea is 120 million bag. Thus, budgetary expenditures in the form of cash subsidy during current year are Rs. 12.00 billion. While, estimated total revenue loss to the state due to sales tax relief on all fertilizers is Rs. 40.07 billion. Thus, total financial implications of subsidy scheme for the 2017-18 are Rs. 52.07 billion, excluding implicit subsidy in the form of inexpensive feed gas to fertilizer industry.
Financial implications of different tax rates on the state revenue collection in year 2017-18 are presented in
Table 1: Subsidy and sales tax on fertilizers (Rs./ bag).
| Fertilizers | Subsidy during 2016-17 | Base prices for 17% GST | Sales tax before 1st July 2017 |
Sale tax relief during 2017-18 |
Current sales tax | |
| Rs. | % | |||||
| Urea | 156+184* | 1333 | 67** | 160+100*** | 67 | 5.00 |
| DAP | 300 | 2388 | 407 | 307 | 100 | 4.14 |
| NP (22-20) | 130 | 1751 | 298 | 130 | 168 | 9.58 |
| NP (18-18) | 117 | 1655 | 282 | 117 | 165 | 9.93 |
| NPK-I | 110 | 2122 | 361 | 110 | 251 | 11.82 |
| NPK-II | 150 | 2184 | 372 | 150 | 222 | 10.13 |
| NPK-III | 97 | 2575 | 438 | 97 | 341 | 13.23 |
| SSP | 117 | 870 | 148 | 117 | 31 | 3.55 |
| CAN | 88 | 1092 | 186 | 88 | 98 | 8.94 |
Source: FBR (2017), MNFS&R (2016) and Fertilizer Industry (2017); *Tax relief; ** GST @ 5% for Urea & 17% for others; *** Cash subsidy on Urea.
Table 2: Financial implications of subsidy scheme for the year 2016-17 (Rs. billion).
| Fertilizers | Total Offtake | Cash Subsidy (Rs. per bag) |
Sales Tax Relief (Rs. per bag) |
Budgetary Expendi-tures |
Total Revenue Loss |
Total Financial Implication |
|
| Million ton | Million bag | ||||||
| Urea | 6.45 | 129.1 | 156 | 184 | 20.13 | 23.75 | 43.88 |
| DAP | 2.36 | 47.1 | 300 | - | 14.14 | - | 14.14 |
| NP | 0.77 | 15.4 | 124 | - | 1.91 | - | 1.91 |
| NPK | 0.08 | 1.6 | 119 | - | 0.19 | - | 0.19 |
| SSP | 0.02 | 0.4 | 117 | - | 0.05 | - | 0.05 |
| CAN | 0.76 | 15.3 | 88 | - | 1.34 | - | 1.34 |
| Total | 10.44 | 208.8 | - | - | 37.76 | 23.75 | 61.51 |
Source: MNFS and R (2016) and FBR (2017); Note: There was implicit subsidy of Rs. 78 billion in the form of cheap feed gas to fertilizer industry during year 2015-16.
Table 3: Financial Implications of Subsidy Scheme for 2017-18 (Rs. billion).
| Ferti-lizers | Total Off-take (Projected) | Cash Subsidy (Rs. per bag) |
Revenue Loss (Rs. per bag) |
Budget-ary Expendi-tures |
Total Revenue Loss | Financial Implication@ tax rates | |||
| Million ton | Million bag | Current | 5% | 2% | |||||
| Urea | 6.00 | 120.0 | 100 | 160 | 12.00 | 19.20 | 31.20 | 19.20 | 23.99 |
| DAP | 2.33 | 46.6 | 0 | 307 | 0 | 14.31 | 14.31 | 13.35 | 16.69 |
| NP | 0.68 | 13.6 | 0 | 124 | 0 | 1.69 | 1.69 | 2.78 | 3.47 |
| NPK | 0.76 | 15.2 | 0 | 119 | 0 | 1.81 | 1.81 | 4.18 | 5.23 |
| SSP | 0.78 | 15.6 | 0 | 117 | 0 | 1.83 | 1.83 | 1.63 | 2.04 |
| CAN | 0.70 | 14.0 | 0 | 88 | 0 | 1.23 | 1.23 | 1.83 | 2.29 |
| Total | 11.25 | 225.0 | - | - | 12.00 | 40.07 | 52.07 | 42.97 | 53.72 |
Source: NFDC (2017) and FBR (2017); Note: There was implicit subsidy of Rs. 78 billion in the form of cheap feed gas to fertilizer industry during year 2015-16.
Table 4. Total revenue collection by the state is about Rs. 20.88 billion with variant tax rates on fertilizer products. Same amount of revenue can be collected by imposing weight tax rate of 5.83%. While, imposition of tax rates of 5% and 2%, would result into revenue loss of Rs. 2.91 and Rs. 13.69 billion, respectively. Impact of other tax rates of 4%, 3% and 1% on revenue collection from fertilizers are also presented to provide a range of choices to the policy planners.
Cash subsidy on Urea costing Rs. 12 billion to national exchequer and total tax relief (All products inclusive) costing around Rs. 40 billion (Table 5). The financial implication of current subsidy and tax relief
Table 4: Financial implications of different tax rates on the state revenue collection in year 2017-18.
| Ferti-lizers | Total Offtake (Projected) | Existing Tax Rates | Revenue with Tax Rates (Rs. billion) | ||||||||
| Million ton | Million bag | Rs. per bag | % | Tax Rates (%) | |||||||
| Existing | *5.83 | 5 | 4 | 3 | 2 | 1 | |||||
| Urea | 6.00 | 120.0 | 67 | 5.00 | 8.04 | 9.33 | 8.04 | 6.43 | 4.82 | 3.22 | 1.61 |
| DAP | 2.33 | 46.6 | 100 | 4.14 | 4.61 | 6.49 | 5.57 | 4.46 | 3.34 | 2.23 | 1.11 |
| NP | 0.68 | 13.6 | 166 | 9.75 | 2.26 | 1.35 | 1.16 | 0.93 | 0.69 | 0.46 | 0.23 |
| NPK | 0.76 | 15.2 | 271 | 11.73 | 4.12 | 2.03 | 1.76 | 1.40 | 1.05 | 0.70 | 0.35 |
| SSP | 0.78 | 15.6 | 31 | 3.55 | 0.48 | 0.79 | 0.68 | 0.54 | 0.41 | 0.27 | 0.14 |
| CAN | 0.70 | 14.0 | 98 | 8.94 | 1.37 | 0.89 | 0.76 | 0.61 | 0.46 | 0.31 | 0.15 |
| Total | 11.25 | 225.0 | - | - | 20.88 | 20.88 | 17.97 | 14.37 | 10.77 | 7.19 | 3.59 |
| Reduction in Revenue Collection | - | 0.00 | 2.91 | 6.51 | 10.11 | 13.69 | 17.29 | ||||
Source: NFDC (2017) and FBR (2017); * Weighted average tax rate.
Table 5: Comparison of financial implications of fertilizer subsidy schemes during 2016-17, 2017-18, and at proposed uniform tax rates. (Rs. billion).
| Financial Years/ Tax Rates |
Tax Relief/ Revenue Loss |
Cash Subsidy/ Budgetary Expenditures |
Total Financial Implication |
| a. 2016-17 | 23.75 | 37.76 | 61.51 |
| b. 2017-18 (estimated) | 40.07 | 12.00 | 52.07 |
| Difference (b-a) | 16.32 | -25.76 | -9.44 |
| c. 5% uniform tax rate | 42.97 | 0.00 | 42.97 |
| Difference with current rates (c-b) | 2.9 | -12.00 | -9.1 |
| d. 2% uniform tax rate | 53.72 | 0.00 | 53.72 |
| Difference with current rate (d-b) | 13.65 | -12.00 | 1.65 |
Table 6: Existing and new prices of fertilizers with proposed tax rates (Rs./bag).
| Fertilizers | Base prices | Market prices as on 09-11-2017 | New prices at different uniform tax rates | ||
| 5.83%* | 5.0% | 2.0% | |||
| Urea** | 1333 | 1365 | 1411 (-3.4) | 1400 (-2.6) | 1360 (0.4) |
| DAP | 2388 | 2704 | 2527 (6.5) | 2507 (7.3) | 2436 (9.9) |
| NP | 1703 | 1960 | 1802 (8.1) | 1788 (8.8) | 1737 (11.4) |
| NPK | 2293 | 2548 | 2428 (4.7) | 2409 (5.5) | 2340 (8.2) |
| SSP | 870 | 867 | 921 (-6.2) | 914 (-5.4) | 887 (-2.3) |
| CAN | 1092 | 1230 | 1156 (6.0) | 1147 (6.7) | 1114 (9.4) |
Source: FBR (2017) and PBS (2017); * Weighted average tax rate; ** In case of withdrawal of cash subsidy of Rs.100 per bag on Urea, price will increase accordingly; Note: Figures in parenthesis are percentages.
is Rs. 52 billion, that is lower than that of 2016-17 by Rs. 9.44 billion, as the subsidy on fertilizer products was converted into tax relief and increase in tax relief was Rs. 16.32 billion, while decrease in cash subsidy was Rs. 25.76 bilion. The imposition of uniform tax rate of 5% without cash subsidy on urea will reduce financial implication to Rs. 42.97 billion and at 2% tax rate financial implication will be Rs. 53.7 billion per annum.
Existing and expected prices of fertilizers with proposed uniform tax rates of 2 percent, 5 percent and weighted average tax rate of 5.83% are presented in Table 6. Decrease in prices of all fertilizers will occur at proposed tax rates, expect of SSP as tax rate on it is presently very low 3.55%. Though tax rate for DAP is also lower (4.14%) than proposed tax rates; however, its current market prices are higher than expected prices with uniform tax rates. This indicates that imposition of uniform tax rates must also be supported by public sector through maintaining their stocks and
Table 7: Effect of reduced and uniform taxes on fertilizer cost of major crops (Rs. /acre).
| Fertilizers | Average use (bags/ acre) | Before subsidy | At existing Prices | At 5% uniform tax rate | At 2% uniform tax rate | ||||
| Price Rs. per bag | Cost per acre (Rs.) | Price Rs. per bag | Cost per acre (Rs.) | Price Rs. per bag | Cost per acre (Rs.) | Price Rs. per bag | Cost per acre(Rs.) | ||
| I. Wheat | |||||||||
| DAP | 1.090 | 2795 | 3047 | 2704 | 2947 | 2507 | 2733 | 2436 | 2655 |
| Urea | 1.747 | 1790 | 3127 | 1365 | 2385 | 1400 | 2446 | 1360 | 2376 |
| SSP | 0.132 | 1018 | 134 | 867 | 114 | 914 | 121 | 887 | 117 |
| NP | 0.079 | 1993 | 157 | 1960 | 155 | 1788 | 141 | 1737 | 137 |
| CAN | 0.039 | 1270 | 50 | 1230 | 48 | 1147 | 45 | 1114 | 43 |
| SOP | 0.024 | 4100 | 98 | 3650 | 88 | 3650 | 88 | 3650 | 88 |
| Total | - | - | 6613 | - | 5737 | - | 5573 | - | 5417 |
| Reduction | - | 877 (13%) | - | 1041(16%) | - | 1197 (18%) | |||
| Reduction (Rs. / 40 kg) | - | 31 | - | 37 | - | 43 | |||
| II. Rice Basmati Paddy | |||||||||
| DAP | 0.585 | 2795 | 1635 | 2704 | 1582 | 2507 | 1467 | 2436 | 1425 |
| NP | 0.195 | 1993 | 389 | 1960 | 382 | 1788 | 349 | 1737 | 339 |
| Urea | 0.146 | 1790 | 261 | 1365 | 199 | 1400 | 204 | 1360 | 199 |
| Zinc Sulphate | 0.316 | 600 | 190 | 600 | 190 | 600 | 190 | 600 | 190 |
| Total | - | 2475 | - | 2353 | - | 2209 | - | 2152 | |
| Reduction | - | 122 (5%) | - | 265 (11%) | - | 323 (13%) | |||
| Reduction (Rs. / 40 kg) | - | 5 | - | 10 | - | 12 | |||
| III. Seed Cotton | |||||||||
| DAP | 0.812 | 2795 | 2270 | 2704 | 2196 | 2507 | 2036 | 2436 | 1978 |
| SSP | 0.036 | 1018 | 37 | 867 | 31 | 914 | 33 | 887 | 32 |
| SOP | 0.015 | 4100 | 62 | 3650 | 55 | 3650 | 55 | 3650 | 55 |
| NPK | 0.051 | 2683 | 137 | 2548 | 130 | 2408 | 123 | 2339 | 119 |
| Urea | 2.066 | 1790 | 3698 | 1365 | 2820 | 1400 | 2892 | 1360 | 2810 |
| CAN | 0.120 | 1270 | 152 | 1230 | 148 | 1147 | 138 | 1114 | 134 |
| NP | 0.073 | 2515 | 184 | 1960 | 143 | 1788 | 131 | 1737 | 127 |
| Total | - | - | 6539 | - | 5522 | - | 5407 | - | 5254 |
| Reduction | - | 1016(16%) | - | 1132 (17%) | - | 1284 (20%) | |||
| Reduction Rs. / 40 kg | - | 53 | - | 60 | - | 68 | |||
| IV. Sugarcane | |||||||||
| DAP | 1.21 | 2795 | 3382 | 2704 | 3272 | 2507 | 3033 | 2436 | 2948 |
| Urea | 2.44 | 1790 | 4368 | 1365 | 3331 | 1400 | 3416 | 1360 | 3318 |
| NP | 0.35 | 2515 | 880 | 1960 | 686 | 1788 | 626 | 1737 | 608 |
| CAN | 0.13 | 1270 | 165 | 1230 | 160 | 1147 | 149 | 1114 | 145 |
| SOP | 0.05 | 4100 | 205 | 3650 | 183 | 3650 | 183 | 3650 | 183 |
| Gypsum | 0.15 | 200 | 30 | 200 | 30 | 200 | 30 | 200 | 30 |
| Total | - | - | 9030 | 7661 | 7437 | 7231 | |||
| Reduction | - | 1369(15%) | 1593(18%) | 1799(20%) | |||||
| Reduction Rs. / ton | 56 | 65 | 74 | ||||||
Source: API (2014) and PBS (2017).
ensuring timely availability to the farmers at critical crop stages. For example, Urea prices should not go above Rs. 1400 per bag in near future after imposition of uniform tax rates of 5% or 2%. Many researchers
Table 8: Impact of productivity increase on cost of production of major crops.
| Vairables | Wheat | Rice | Cotton | Sugarcane |
| Total cost of production per acre (Rs.) | 37204 | 45449 | 54010 | 91747 |
| Average yield (mounds/acre) | 28 | 26 | 19 | 609 |
| Cost per 40 kg at current productivity level (Rs.) | 1329 | 1748 | 2843 | 151 |
| Yield with 5% productivity increase | 29.4 | 27.3 | 20.0 | 639.5 |
| Cost per 40 kg with 5% productivity increase | 1265 | 1665 | 2707 | 144 |
| Reduction in cost with increase in productivity (Rs./mound) | 64 | 83 | 136 | 7 |
Source: API (2014).
Table 9: Impact of crop productivity increase on national economy.
| Crops |
Current Production (thousand tonnes) |
Production with 5% increase in productivity | Price per 40 kg (Rs.) |
Value (Billion Rs.) |
|
| thousand tonnes | thousand mounds (40 kgs) | ||||
| Wheat | 25633 | 1281.65 | 32041250 | 1300 | 41.65 |
| Rice | 6801 | 340.05 | 8501250 | 4770 | 40.55 |
| Seed Cotton | 1861 | 93.05 | 2326250 | 3000 | 6.98 |
| Sugarcane | 65482 | 3274.1 | 81852500 | 180 | 14.73 |
| Maize | 5271 | 263.55 | 6588750 | 1161 | 7.65 |
| Total | - | - | - | - | 111.57 |
Source: Economic survey of Pakistan, 2015-16 and Agriculture Statistics 2013-14.
including Ahamd and Muhammad (1998) also insisted on implementation of regulatory measures to ensure timely availability of right type of quality fertilizers to the farmers for ensuring sustainability of agriculture.
Prices of all fertilizer products have decreased substantially since 2013-14. Price of urea came down by 25%, from Rs. 1827 to Rs. 1365, while price of DAP decreased by 26% from Rs. 3640 to Rs. 2704. In the Federal budget 2017-18, subsidy disbursement mechanism was simplified to direct reduction in taxes on DAP, NP, NPK, SSP and CAN fertilizers. Fertilizer cost of major crop reduced by 13%, 5% for rice, 16% for seed cotton and 15% for sugarcane as compared to pre subsidy scenario (Table 7). The imposition of uniform tax rate of 2% will afurther reduce fertilizer cost of major crops by 18% for wheat, 13% for rice, 20% each for cotton and sugarcane as compared to pre-subsidy prices.
Increased as well as balanced use of fertilizers with imposition of uniform tax rates will result into better crop productivity. A modest increase in productivity of 5% may result into decrease in cost of production of major crops by Rs. 64 per mound for wheat, Rs. 83 per mound of rice, Rs. 136 per mound of cotton and Rs. 7 per mound of sugarcane (Table 8). This will result in increase in profitability and income for farmers, thus help to and improve their well-being. Modest increase in crop productivity by 5% would result in additional production of major crops (wheat, rice, cotton, sugarcane and maize) of worth Rs. 111.57 billion (Table 9). This will generate economic activities in rural areas and have positive impact on the wellbeing of the people. While, existing production levels of major crops can be obtained by reducing area under these crops by 859 thousand hectare, and spared area can be brought under hi-value crops to diversify the cropping systems.
During March 2011, Government of Pakistan introduced General Sales Tax (GST) at uniform rate of 17%. Until that point, very little GST was fixed for fertilizer. In addition, gas curtailment policy in May 2010 resulted in increase in prices of Urea from Rs. 800 in 2009-10 per bag to Rs. 1719 in 2012 (NDFC, 2013). Price of other phosphate fertilizer also experienced significant increase due to price hike increase in prices in the international markets. This increase in the cost of production is negatively impacting agriculture growth and crop yields. It is interesting to note that regional countries such as India and Bangladesh subsidize two third of the cost of fertilizers, while only one third cost is paid by the farmers. Comparison of prices of agricultural commodities in the country with India revealed that majority of these have almost same prices comparison of agricultural commodities revealed that majority of agricultural commodities of Pakistan and India are about the same, however, fertilizer prices in Pakistan are three times higher than those in India, this leads to an uneven playing field. Thus, government of Pakistan along with the agricultural experts must revise policies relative to fertilizer subsidy to help famers compete in international trade.
Conclusions and Recommendations
In existing tax regime, tax rates on fertilizer products vary greatly. The anomaly of varying tax rates arose due to conversion of subsidies on fertilizers into tax relief. Due to which Urea and low quality phosphorus fertilizers became cheaper than high quality phosphate and potash fertilizers. Production of fertilizers in the country, especially of Urea is highly subsidized. Imposition of reduced uniform tax rate will not only ease subsidy regime, but promote increased and balanced use of fertilizers. Reduced tax rates will result in decrease in prices of fertilizers, hence cost of production of crops will also come down. With imposition of uniform low tax rates crop yields as well as farm income will increase. This will benefit livelihood of people both directly and indirectly associated with agriculture and help improve the well-being of rural communities. Which will have help improve wellbeing of rural people. Following are specific recommendation based on extensive analysis of present fertilizer subsidy and tax policy, and suggested modification in it through imposition of uniform tax rates.
Based on the analysis, it is recommended that tax rate may be reduced to 2% for all fertilizers. This will have additional burden of Rs. 1.65 billion on national exchequer only, as the state would not require to finance subsidy scheme for Urea fertilizer of worth Rs. 12. billion.
FBR should be granted a relief of 13.65 billion in tax collection, which is just 0.39% of total revenue collection targets (3.521 trillion). This policy will facilitate balanced use of fertilizers as well as it will ease cumbersome mechanism of payment of cash subsidy to fertilizer companies based on sale proceeds. Shifting from cash subsidy scheme to tax relief will prevent leakage of financial resources and directly benefit farming community. It will have positive effect on rural economy by increasing crop productivity. Modest increase in crop productivity by 5% would result in additional production of major crops (wheat, rice, cotton, sugarcane and maize) of worth Rs. 111.57 billion. While, existing production levels of major crops can be obtained by reducing area under these crops by 859 thousand hectares, and spared area can be brought under hi-value crops that will help diversify the cropping systems.
Acknowledgements
The minister (NFSR) is highly appreciated for his vigilance on farming issues, intellect and timely direction to suggest workable proposals to address the anomalies in fertilizer subsidy and taxations scheme in terms of varying degree of relief on various products of fertilizer. The Secretary, Ministry of NFSR, Mr. Fazal Abbas Maken is acknowledged for his able guidance during course of technical meetings held in the Ministry of NFS and R to develop consensus on plausible proposals in consultation with the Finance Division and Federal Bureau of Revenue (FBR), for substituting fertilizer subsidies with reduction of taxes with a view to reduce input cost and indicating financial implications for various agricultural products in consultation with the Finance Division and FBR. Furthermore, technical contributions of high level officials of Ministry of NFS and R, Finance Division, FBR National Fertilizer Development Centre (NFDC), Agriculture Policy Institute (API) and Pakistan Agricultural Research Council (PARC) are also recognized.
Authors’ Contribution
Abid Hussain: Developed the research, methodology, analyzed the data, reviewed the literature, prepared draft.
Muhammad Azeem Khan: Materialized the concept into a researchable issue and provided guidance at every step.
Muhammad Anjum Ali Buttar: Spearheaded the research endeavour with his insightful vision.
Umar Farooq: Provided guidence at every step of the research process.
Muhammad Islam: Assisted in data compilation, its analysis and contributed in review of relavnat literature.
Muhammad Zahid Ullah Khan: Assited in data compilation and analysis.
References
Afzal, N. and S. Ahmad. 2009. Agricultural input use efficiency in Pakistan – Key Issues and Reform Areas. Vol. (1), No. (3), NRD, PARC, Islamabad, Pakistan.
Ahmad, N. and T. Muhammad. 1998. Fertiliser, plant nutrietn managment, and slef-reliance in agriculture. Pak. Dev. Rev. 37(4): 217-233.
ASP. 2014-15. Economic wing, ministry of national food security and research, Islamabad.
API. 2014. Annual policy analysis reports on cotton, sugarcane, rice and wheat for 2013-14. Agriculture Policy Institute, Ministry Nat. Food Sec. Res. Islamabad.
FBR. 2017. Finance Act, 2017, Eighth Schedule, Reduced Rates of Taxes. Islamabad, Pakistan: Fed. Board Revenue.
FAI. 2016. India at the bottom of fertilizer usage. Fertilizer Association of India. New Delhi, India.
Fertilizer Industry. 2017. Sale tax proceeds of Fatima Fertilizer Company Limited, Fatima Group., Khayaban-e-Jinnah, Lahore Cantt., Pakistan.
GOI. 2017. Department of Fertilizers, Ministry of Chemicals and Fertilizers, Government of India, New Delhi, India.
NDFC. 2013. Pakistan Fertilizer Statics, Islamabad, Pakistan. National Fertilizer Development Center.
Ministry of NFS and R. 2016. Ministry of National Food Security and Research Notification No. 1-11/2012/DFSC-II/Fertilizer dated 25th June 2016.
NFDC. 2016. Fertilizer Review, 2015-16. Islamabad, Pakistan: Nat. Fert. Dev. Centre.
NFDC. 2017. Fertilizer Review, Mid July, 2017. Islamabad, Pakistan: Nat. Fert. Dev. Centre.
PES. 2015-16. Economic Adviser’s Wing, Finance Division, Gov. Pak. Islamabad.
PES. 2016-17. Economic Adviser’s Wing, Finance Division, Gov. Pak. Islamabad.
PBS. 2017. Average fertilizer retail prices from April 2016 to June 2017. Pak. Bur. Stat. Islamabad.
PILdAT. 2015. Promotion of agriculture in Pakistan (Background Paper). Pak. Inst. Legislative Dev. Trans. Islamabad
Planning Commission of Pakistan, 2017. Food security and agricultural development. Ministry Plann. Dev. Reform, Islamabad.
Tiwari, K.N. 2007. Reassessing the role of fertilizers in maintaining food, nutrition and environmental security. India. J. Fert. 3(1): 33-48 and 51-52.
Quddus, M.A., M.W. Siddiqi and M.M. Riaz. 2008. The demand for nitrogen, phosphorus and potash fertilizer nutrients in Pakistan. Pak. Econ. Soc. Rev. 46 (2): 101-116.
Rehman, A., A.A. Chandio, L. Jingdong and I. Hussain. 2016. Economic perspectives of sugarcane crop in Pakistan: A time series analysis (1970-2015) (Part 4). Int. J. Adv. Biotech. Res. 7 (3): 961-967.
Wakeel, A. 2015. Balanced use of fertilizers in Pakistan: Status and perspectives. Potash Institute (IPI) Switzerland, Univ. Agric. Faisalabad, Pak.
To share on other social networks, click on any share button. What are these?


