

Recovery of Chemotherapy-induced Anemia by Angelica Polysaccharides in C57BL/6N Mice and Elucidation of Underlying Mechanism


Recovery of Chemotherapy-induced Anemia by Angelica Polysaccharides in C57BL/6N Mice and Elucidation of Underlying Mechanism
Tian-Yi Zhao1, Zi-Qing Liu2, Bo Yang1, Qiao Gao1, Hong-Yu Zhang1, Pei-Yu He1, Ming-Hua Duan1* and Yu-Li Yan1*

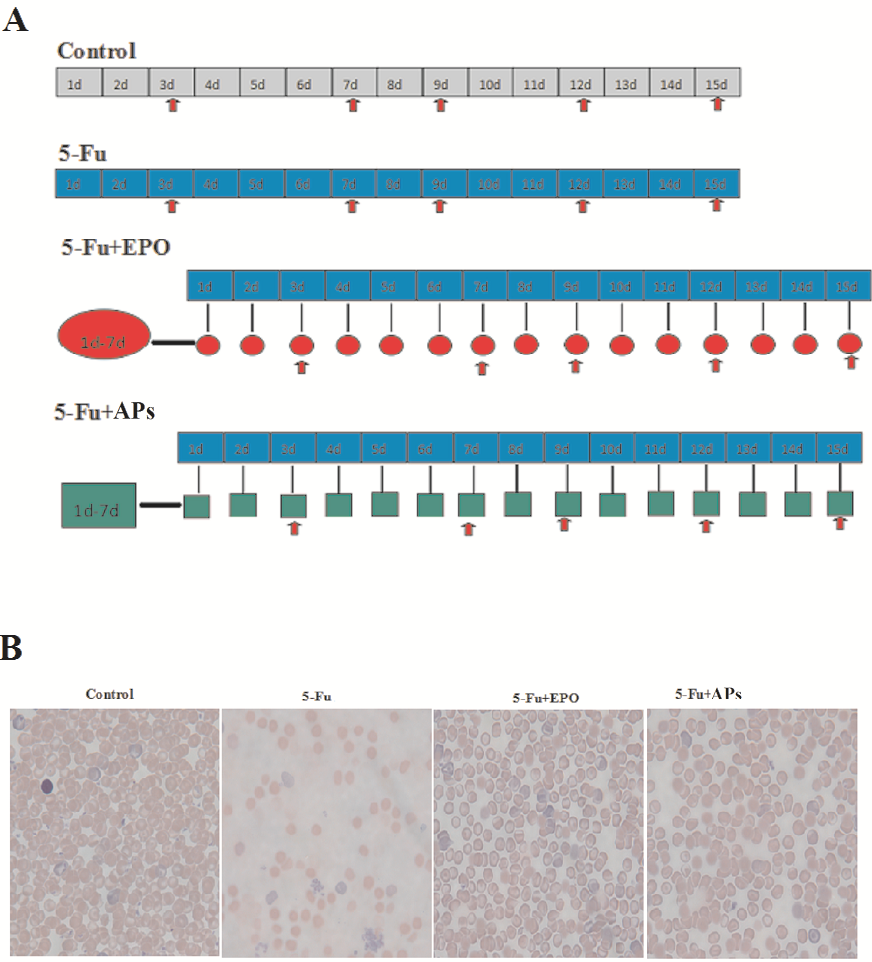
Study design of this research (A) and blood smear with microscopic observation on the 15th day (B).
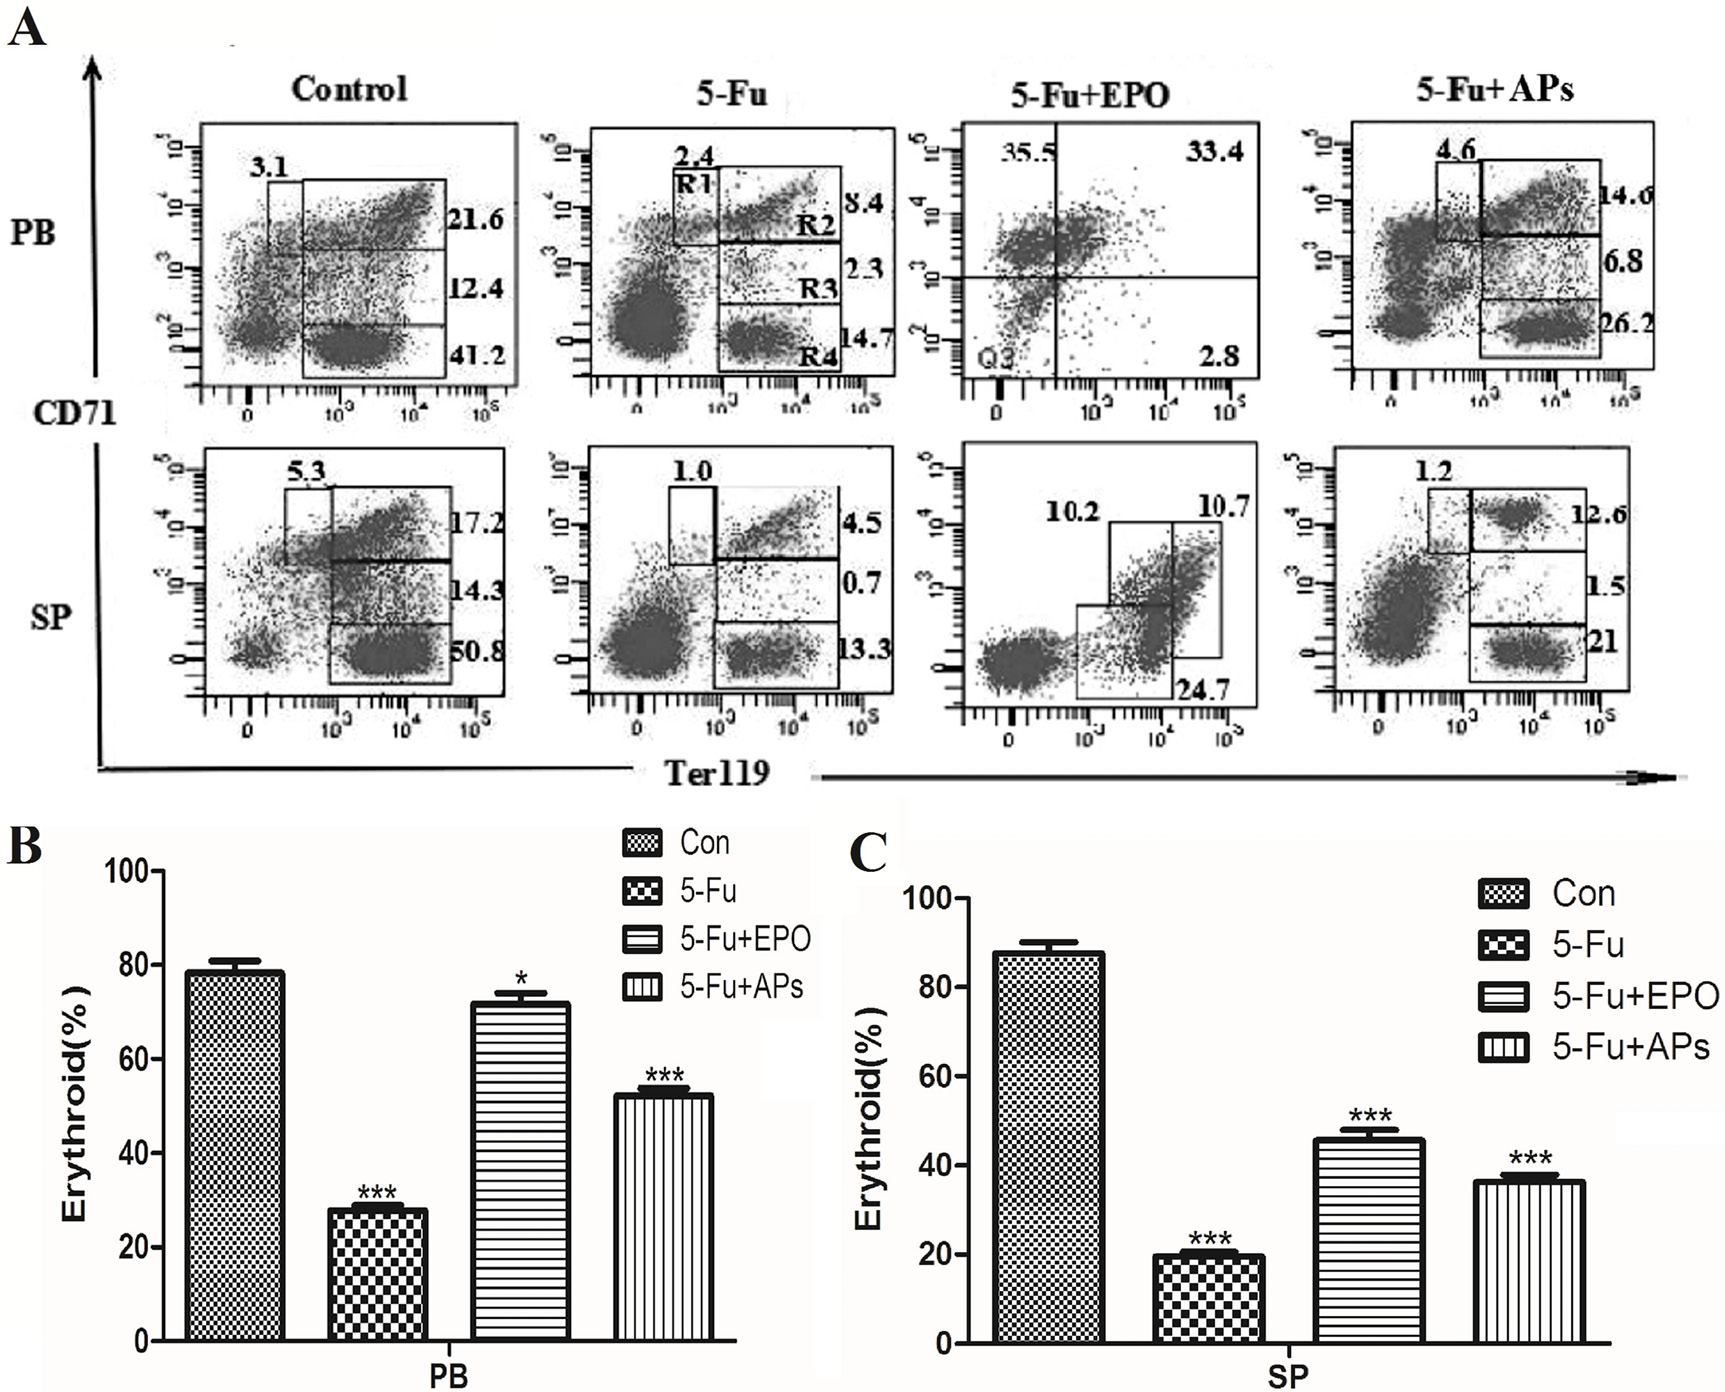
CD71/Ter119-labeled red blood cells in control, 5-Fluorouracil (5-Fu), 5-Fu+EPO and 5-Fu+APs groups. Flow cytometric analysis of red blood cells in the peripheral blood and spleen, CD71 and Ter119 are the red blood cell surface marker protein (A); statistical analysis of CD71/Ter119-labeled red blood cells in peripheral blood (B); statistical analysis of CD71/Ter119-labeled red blood cells in spleen (C). Data are presented as the mean ± standard deviation; ***P < 0.001 versus the control group. PB, peripheral blood; SP, spleen.
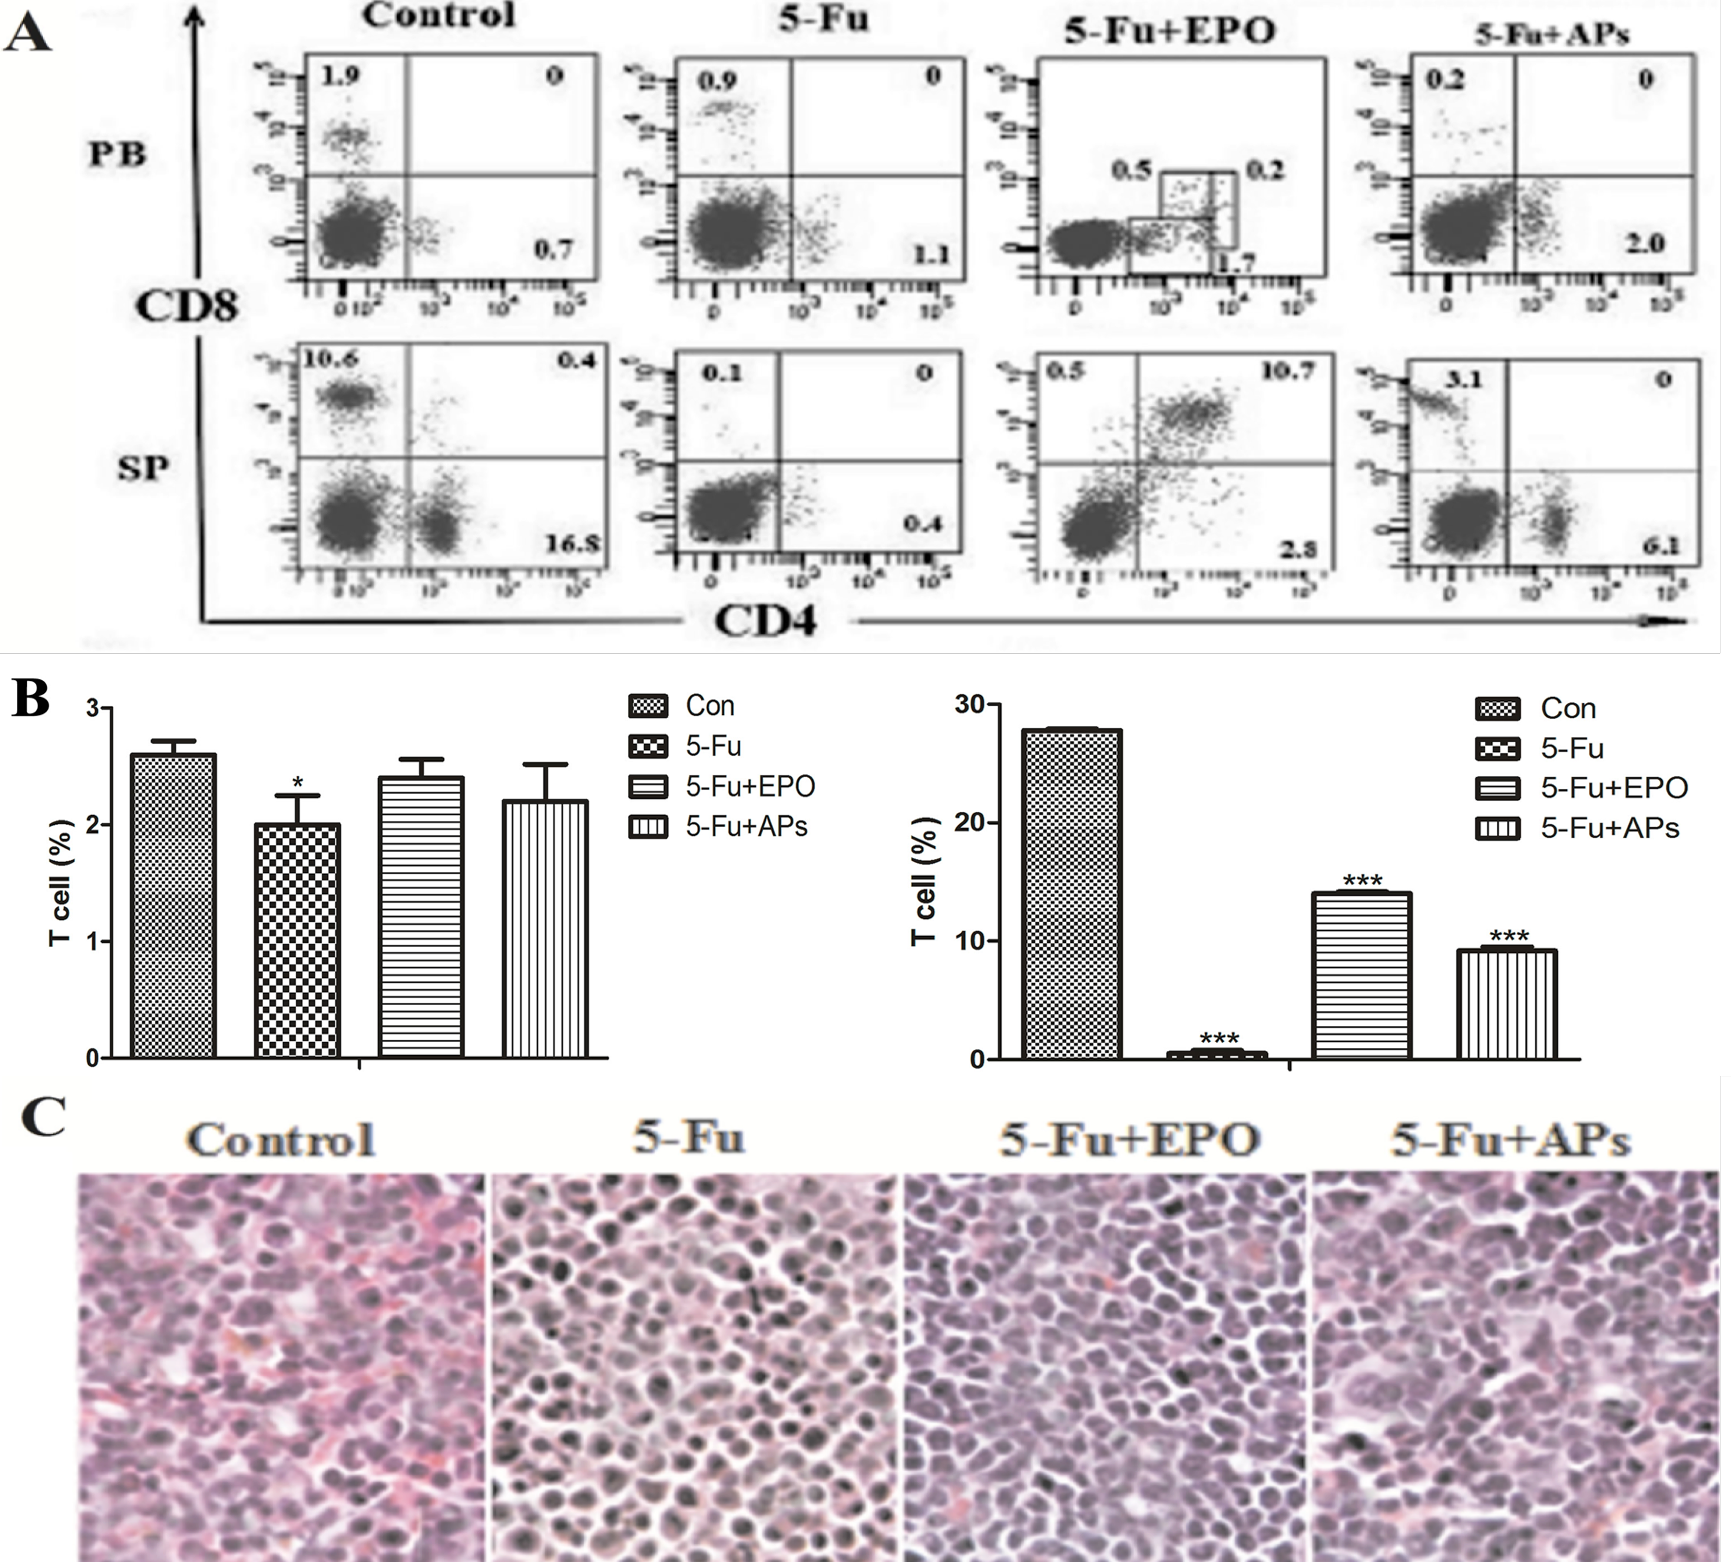
CD4/CD8-labeled T cells in control, 5-Fluorouracil (5-Fu), 5-Fu+EPO and 5-Fu+APs groups. (A) Flow cytometric analysis of T cells in the peripheral blood and spleen. CD4 and CD8 are the T cell surface marker protein; (B) Left: statistical analysis of CD4/CD8-labeled T cells in peripheral blood; Right: statistical analysis of CD4/CD8-labeled T cells in spleen. (C) H&E staining of paraffin-embedded sections of spleen for control group, 5-Fu treatment group, 5-Fu +EPO group,and 5-Fu +APs group. Data are presented as the mean ± standard deviation; ***P < 0.001 versus the control group. PB, peripheral blood; SP, spleen.

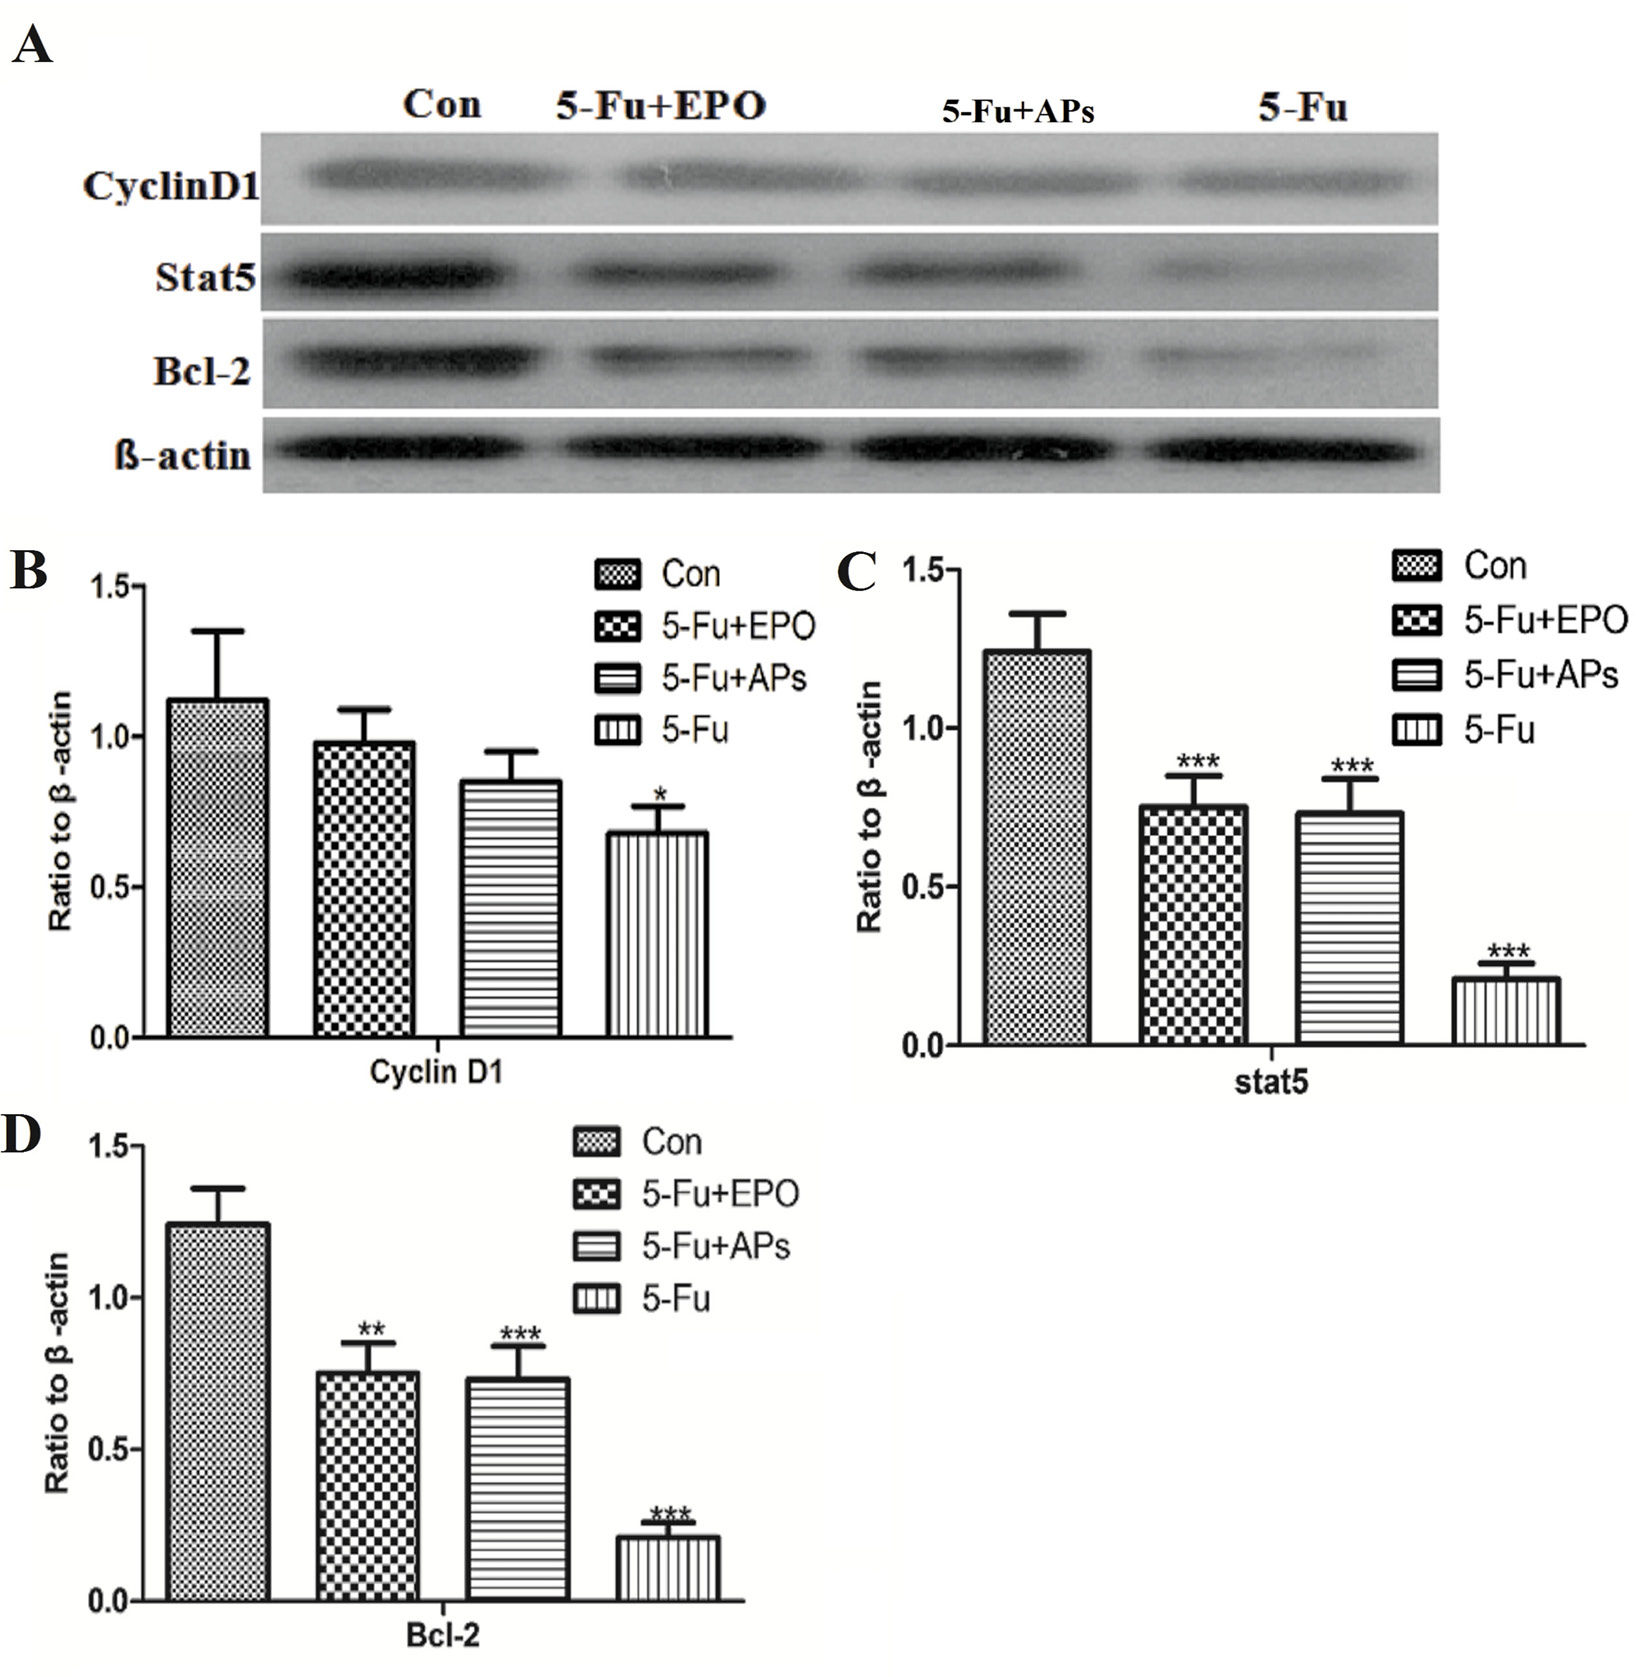
Expression levels of cyclin D1, Stat5, and Bcl-2 in peripheral blood cells. (A) Western blot analysis of the expression of cyclinD1, Stat5, and Bcl-2 in control, 5-Fluorouracil (5-Fu), 5-Fu+EPO and 5-Fu+APs groups. (B-D) β-actin was used as the internal control for grayscale analysis. Data are presented as the mean ± standard deviation; *P < 0.05, **P < 0.01, ***P < 0.001 versus the control group.


