Prospective of Use of Phosphorus and Zinc at Tillering and Booting Stages of Rice
Prospective of Use of Phosphorus and Zinc at Tillering and Booting Stages of Rice
Farah Rasheed1*, Ana Aslam1, Muhammad Aftab1, Ghulam Sarwar2, Raheela Naz1, Hina Nazir3, Sadia Sultana1, Amina Kalsom1, Nisa Mukhtar1, Ifra Saleem1, Qudsia Nazir1, Muhammad Arfan-ul-Haq1, Abid Niaz4, Muhammad Arif1, Aamer Sattar1, Sarfraz Hussain5 and Adnan Rafique6
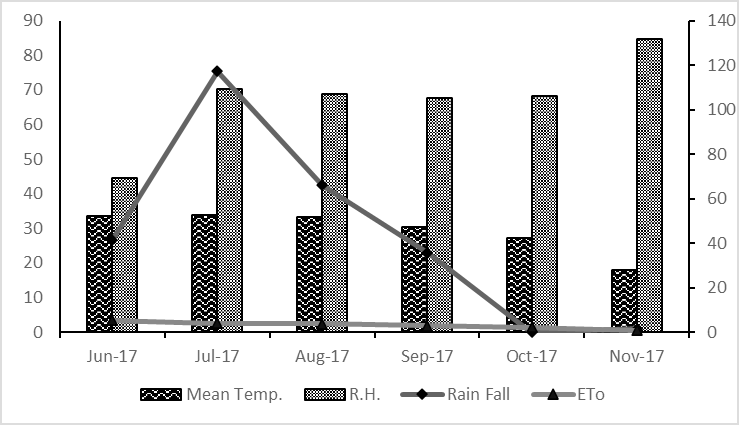
Mean temperature, relative humidity, rainfall and evapotranspiration for growing season of rice.
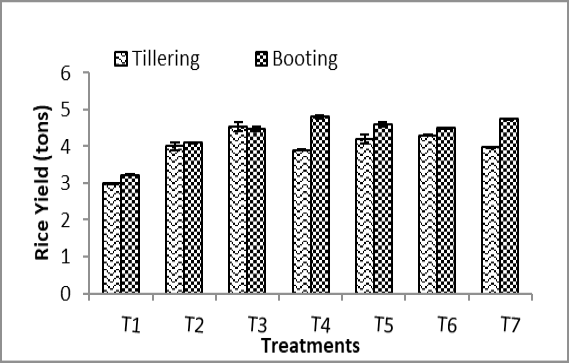
Impact of P and Zn application on rice yield.
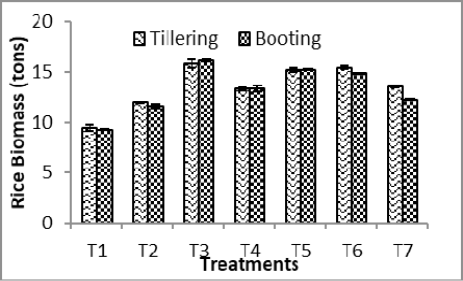
Impact of P and Zn application on rice biomass.
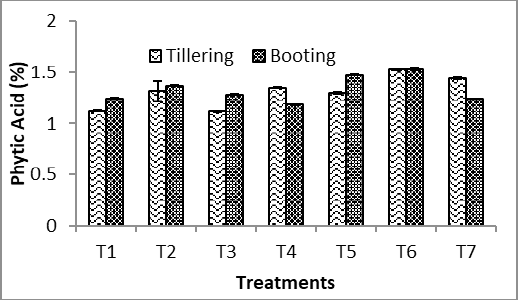
Impact of P and Zn application on rice grain phytic acid (%).
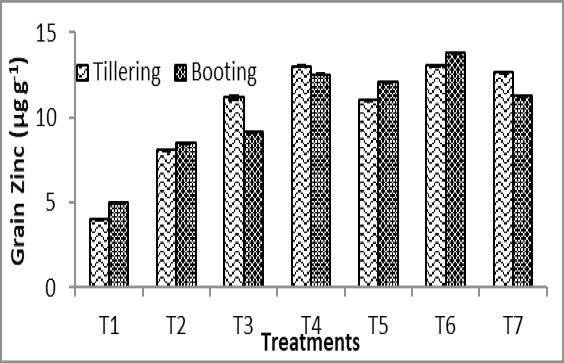
Impact of P and Zn application on rice grain zinc (µg g-1)
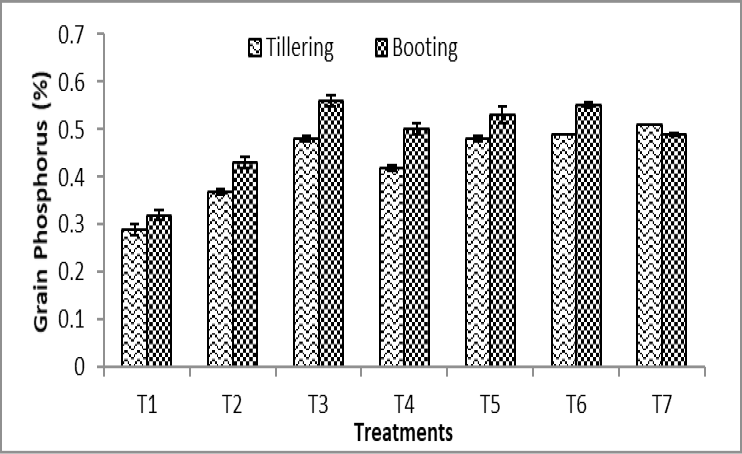
Impact of P and Zn application on rice grain phosphorus (%).
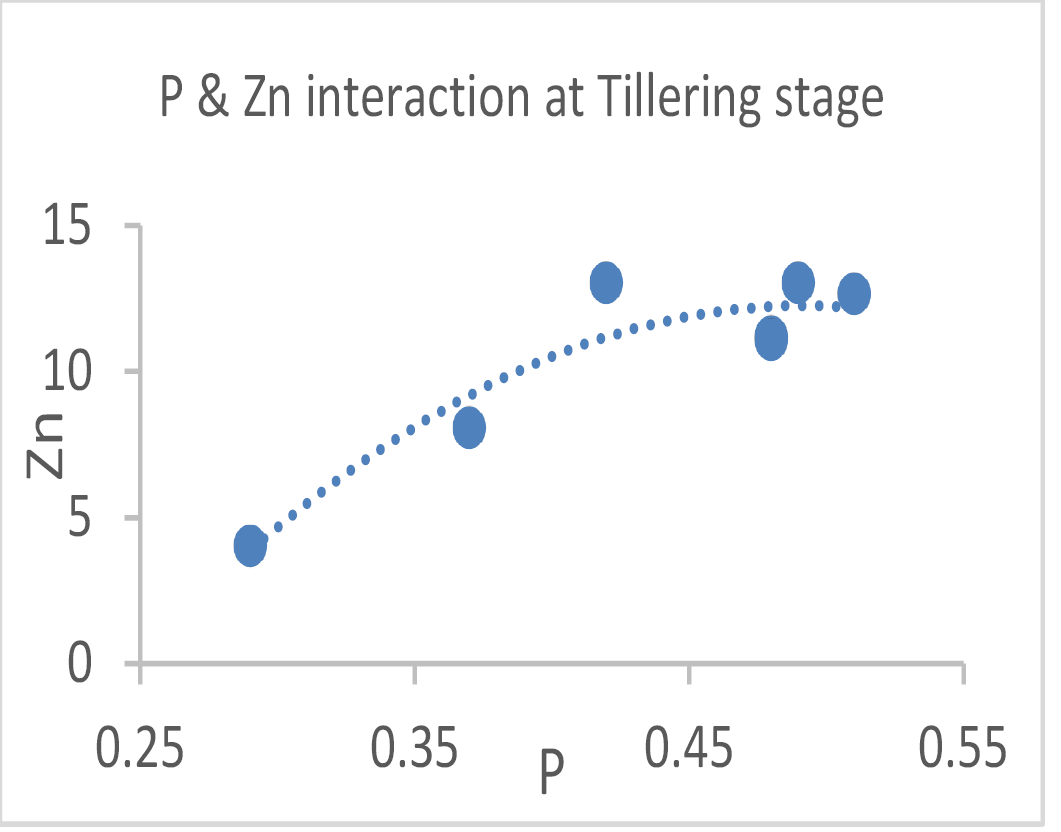
P and Zn interaction at tillering stage.
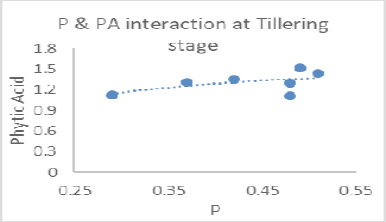
P and PA interaction at tillering stage.
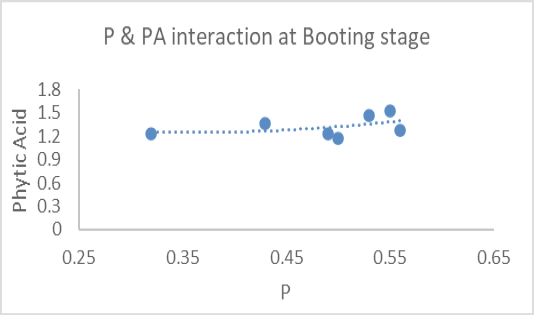
P and PA interaction at booting stage.
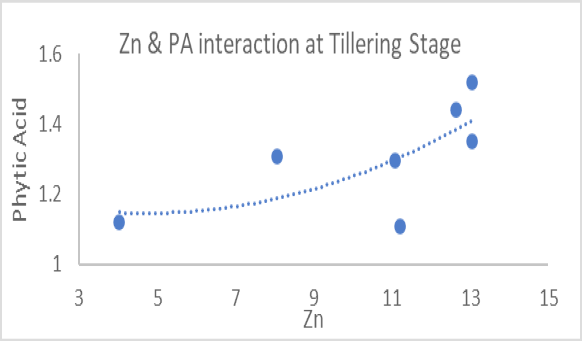
Zn and PA interaction at tillering stage.
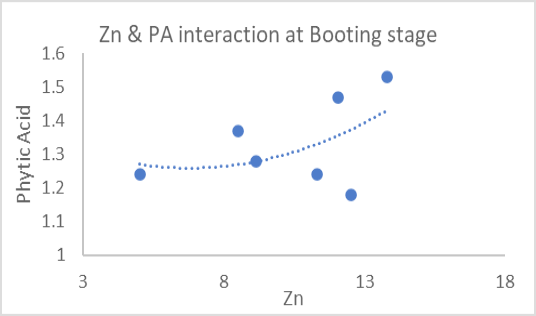
Zn and PA interaction at booting stage.
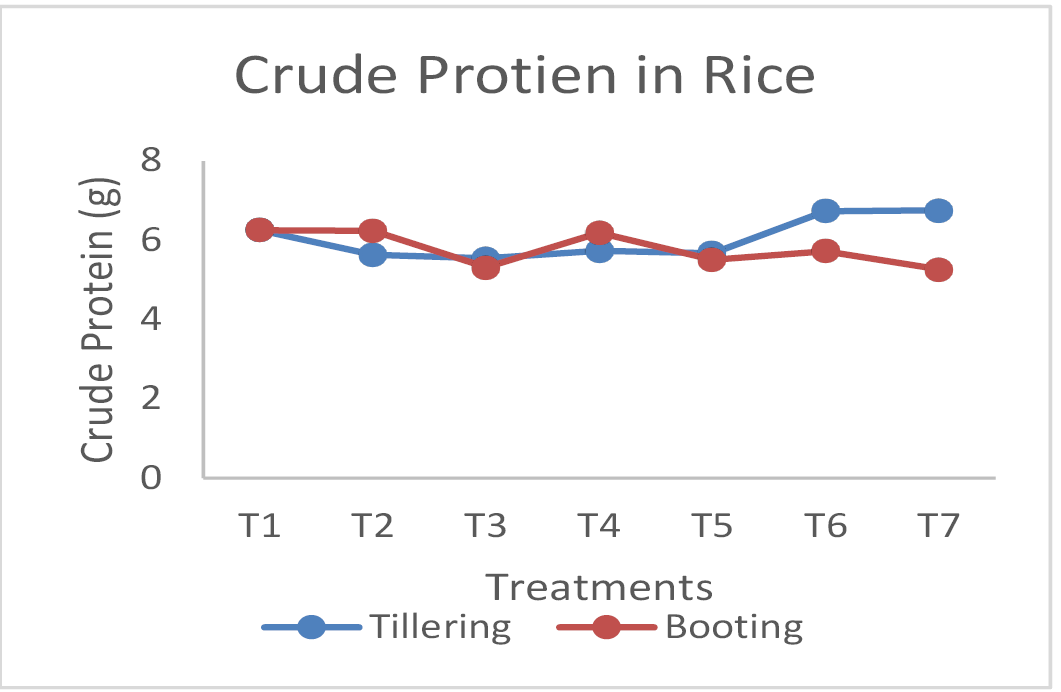
Impact of P and Zn application on rice crude protein (g).
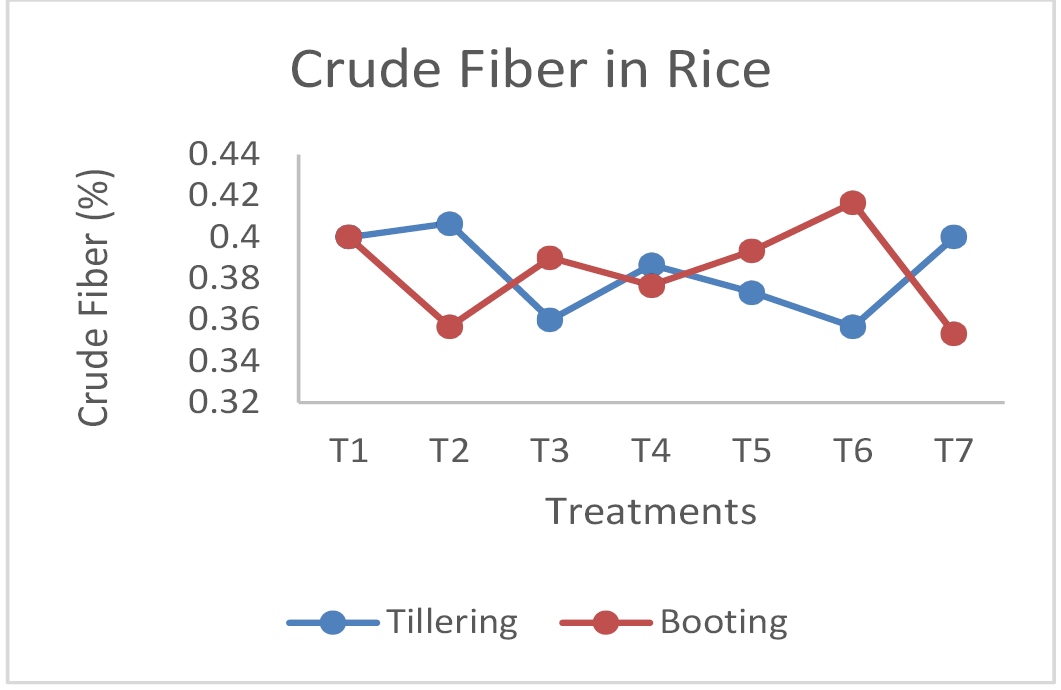
Impact of P and Zn application on rice crude fiber (%).
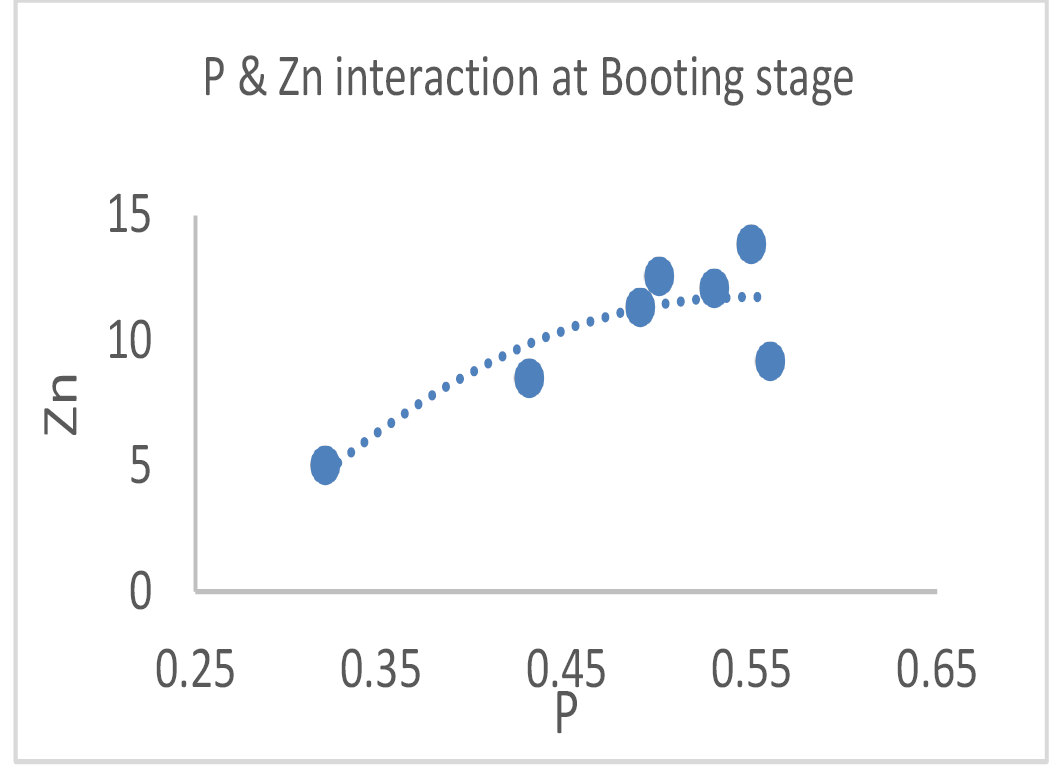
P and Zn interaction at booting stage.


