
Productive and Reproductive Traits and Clinical Epidemiological Measures in Discriminant Analysis between Baladi Buffaloes and Crossbred


Research Article
Productive and Reproductive Traits and Clinical Epidemiological Measures in Discriminant Analysis between Baladi Buffaloes and Crossbred
Ahmed Fathy1, Rania A. Hassan2, Essam S. Soliman3*
1Biostatistics Division, Department of Animal Wealth Development, Faculty of Veterinary Medicine, Suez Canal University, Ismailia 41522, Egypt; 2Animal Production Division, Department of Animal Wealth Development, Faculty of Veterinary Medicine, Suez Canal University, Ismailia 41522, Egypt; 3Department of Veterinary Public Health, Faculty of Veterinary Medicine, Suez Canal University, Ismailia 41522, Egypt.
Abstract | Crossbreeding represents an important procedure that can be used in animal breeding and improvement programs. Clinical epidemiology relay on the collaboration between biostatistics and epidemiology to provide a basis for the veterinary field and clinical care. Since discriminant analysis as a parametric test is more powerful than its non-parametric alternatives, we aimed to evaluate the performance of the single discriminant analysis in classification between Baladi buffaloes and crossbred using clinical epidemiological measures of some productive and reproductive traits such as milk yield (MY/kg), days in milk (DIM/days), age at first calving (AFC/months), calving interval (CI/months), days open (DO/days), dry period (DP/weeks), number of services per conception (SPC rate), and days to first insemination (DFI/days). The raw data on 927 buffaloes (763 crossbred and 164 Baladi buffaloes) were collected from a dairy farm in Al Sharqia governorate- Egypt. The results showed that MY/kg, DIM/days, AFC/months, CI/months, DO/days, DP/weeks, SPC rate, and DFI/days were good discriminators between both buffalo breeds. The discriminant function showed a significant association between the predictor variables and groups of dependent variables. The model explains about 19.2% of the variations in the dependent variables. The individual percentages correctly classified for the analysis, cross-validation, and holdout samples were 83.1, 82.6, and 82.2%, respectively. The three benchmarks used to judge the goodness of the model (Maximum chance = 83.1, proportional chance = 66.2, and press Q = 134.4) showed a model with good predictive power.
Keywords | Baladi buffaloes and crossbred, Canonical Correlation, Clinical Epidemiology, Discriminant Analysis, Productive and Reproductive Traits.
Received | November 20, 2022; Accepted | December 01, 2022; Published | December 20, 2022 ,
*Correspondence | Essam S Soliman, Department of Veterinary Public Health, Faculty of Veterinary Medicine, Suez Canal University, Ismailia 41522, Egypt; Email: soliman.essam@vet.suez.edu.eg
Citation | Fathy A, Hassan RA, Soliman ES (2023). Productive and reproductive traits and clinical epidemiological measures in discriminant analysis between baladi buffaloes and crossbred. Adv. Anim. Vet. Sci. 11(1): 45-56.
DOI | http://dx.doi.org/10.17582/journal.aavs/2023/11.1.45.56
ISSN (Online) | 2307-8316

Copyright: 2023 by the authors. Licensee ResearchersLinks Ltd, England, UK.
This article is an open access article distributed under the terms and conditions of the Creative Commons Attribution (CC BY) license (https://creativecommons.org/licenses/by/4.0/).
INTRODUCTION
Buffaloes are highly resistant animals that can be raised under variable macroclimatic conditions for different purposes, mainly for meat, milk, and their products (Stasio and Brugiapaglia, 2021). Buffalo’s meat in recent years has gained great importance for its high nutritive contents (77.75% moisture, 23.3% protein, 1.4% fat, 1.0% ash, 5.1% water-soluble proteins, and 12.0% hydroxyproline) and its role in satisfying the market demands for animal protein sources (Naveena and Kiran, 2014; Nuraini et al., 2018). Crossbreeding represents an important procedure that can be used in some breeding and improvement programs to harvest a larger number of desirable genes, as well as increase the production and reproduction traits of the crossbred (Hanafi and Iraqi, 2001). Clinical epidemiology is an investigation and control of the distribution and determinants of a certain field case in which quantitative measures are applied in diagnosis, prophylactics, treatment, and risk assessment (Baron et al., 2015; Martinez et al., 2019). These measures rely on the collaboration between biostatistics and epidemiology to provide a basis for the veterinary field and clinical care (Kambri et al., 2016; Lazcano et al., 2019). Clinical epidemiological measures are used to predict the pattern of disease occurrence, as well as develop, validate, and predict unbiased disease outcomes (Cataldo et al., 2019; Estrada et al., 2020).
In different situations, the researchers get confused about the most reliable method and procedures for data analysis. Regression was found to be the best choice for the data analysis if the researchers interested in establishing relationships among variables. For establishing the regression analysis, the dependent variable should be of a continuous level and if this assumption is violated, so the regression analysis will not be the appropriate test of choice (Ramayah et al., 2010). If the dependent variable is of nominal level, so we have to choose between using either discriminant analysis which is a parametric test, or logistic regression for the non-parametric alternatives. But it was found that discriminant analysis as a parametric test is more powerful than its non-parametric alternatives (Ramayah et al., 2004; Ramayah et al., 2006).
Linear discriminant analysis is a multivariate statistical method used for the appraisal of the relationships between different explanatory variables and the corresponding categorical ones. It is widely used in medical and logical sciences (Antonogeorgos et al., 2009). Discriminant analysis is applied to determine which set of predictors or quantitative variables is the best to discriminate between two or more naturally occurring groups of the categorical dependent variables (Cramer, 2003; Ojo et al., 2022). This can be done by the estimation of linear discriminant function which is a linear combination of weightings and scores of the standardized variables (Timm, 2002; Hamid, 2010; González Ariza et al., 2021). Discriminant was found to be of great importance in discrimination of the impacts on milk production and milk products according to consumer’s needs (Mele et al., 2016).
The current study aimed to make use of some clinical epidemiological measures in calculating some productive traits such as milk yield (MY/kg) and days in milk (DIM/days), and some reproductive traits such as age at first calving (AFC/months), calving interval (CI/months), days open (DO/days), dry period (DP/weeks), number of services per conception (SPC rate), and days to the first insemination (DFI/days), and which of these clinical productive and reproductive traits are the best to discriminate between Baladi buffaloes and crossbred using single discriminant analysis.
MATERIALS AND METHODS
Ethical approval
The study design and procedures were approved by the Scientific Research Ethics Committee on animal and poultry research, Faculty of Veterinary Medicine, Suez Canal University, Egypt with approval number (2022044).
Animal study population housing and management
The farm understudy was chosen in a complete randomized pattern from the dairy farms located in Ismailia and Al Sharqia governorate- Egypt. The study animal populations were housed in a milking parlor house system consisting of 1) Animal housing units of a face-to-face double row arrangement with a fully shaded yard which was subdivided by galvanized iron partitions into units for rotational purposes. Each house was supplied with feeding managers and waterers of 1 × 1 × 0.6 m3 for each. 2) Herringbone automated milking parlor for milk harvesting twice daily, in which the animals were supplied with concentrates during a routine milking time of 6 min, povidone-iodine pre-milking teat dipping, and chlorohexidine post-milking teat dipping. 3) Isolation units for sick and suspected animals. 4) Calving units for serving the parturition purposes. 5) Storage units for feed and equipment. The calf-rearing system in the study farm was an indoor system in which calves were allowed to stay with their dams and suckle for a limited period each day.
The animal houses were ventilated using cross-sectional negative ventilation based on ceiling and wall fans and side wall V-shaped windows serving as air inlets and suction fans on the opposite side walls serving as air outlets. The houses were supplied with a continuous lighting regimen of 18 h of lighting and 6 h of darkness using white LED lights following Soliman and Hassan (2019). The farm was supplied with a modified drainage system with 1% slopping toward the gutters and the manure tanks were evacuated monthly, as well as gutters in the animal houses were lined with superphosphate after Soliman et al. (2018) to overcome the humidity in the building, microbial growth, and ammonia volatilization (Soliman and Hassan, 2017). A strict regimen of internal and external biosecurity measures was followed after Soliman and Abdallah (2020) that was based on fly-proof nets and physical means of control using lights and tapes, rodent mechanical control, effective cleaning procedures, proper disinfection regimen using glutaraldehyde (Soliman et al., 2016) and quaternary ammonium compounds, stirring and scratching of the bedding material weekly to destroy the anaerobic condition in the soil, and secure storage areas. The housed microclimatic temperature was optimized at 37°C with halogen (halogen- 4 tubes- 2400 watt heater, Bravo BR-4T Heater 4 halogen Candles) and oil (Oil- 11 blades- 2500 watt heater) heaters after Soliman et al. (2021), and they were attached to higher levels in the animal houses.
The microclimatic temperature and relative humidity were monitored using a digital thermometer (ThermoPro® TP50 Digital LCD Thermometer Hygrometer Temperature Humidity Meter) and thermohygrometer (Digital Thermometer Hygrometer Indoor Outdoor Temperature Meter Humidity Monitor with LCD Alarm Clock, 3M Probe Cord), respectively. The animals were fed on a total mixed ration (TMR) based on a mixture of a concentrate diet and roughage, the concentrate consisted of 30% ground yellow corn, 15% Distiller’s dried grains with solubles (DDGS), 26.5% wheat bran, 10% dried beet pulp, 15% sunflower seed meal, 1.5% ground limestone, 0.6% mineral premix, 0.5% vitamin premix, and 0.9% sodium chloride which was formulated to face the minimal requirement for each animal. The animals were provided ad libitum access to clay-purified water as recommended by Soliman et al. (2021) and it was previously assessed for physicochemical characteristics and residual chlorine after Soliman et al. (2021). The animals were regularly dewormed against internal parasites and vaccinated against brucellosis, foot & mouth virus disease (FMD), coronavirus, rotavirus, and Closteria toxoid, vibriosis, and leptospirosis. The animals were regularly examined for the development of subclinical or clinical mastitis using the California mastitis test and Brucella using the Rose Bengal test.
Data collection and variables studied
Records of 927 buffaloes (763 crossbred and 164 Baladi breed buffaloes) were collected from the farm understudy in Al Sharqia Governorate, Egypt. Productive and reproductive data were calculated using the clinical epidemiological measures by the dairy live herd management software program (Version 5.4.1.0). The data consists of MY/kg and DIM/days as productive measures, and AFC/months, CI/months, DO/days, DP/weeks, SPC rate, and DFI/days as reproductive measures. A designed flowchart in Figure 1 showed the systematic procedures in data manipulation and analysis.
Single discriminant analysis
It is the simplest type of discriminant analysis i.e. two groups only. It determines the association between several explanatory variables and a single categorical variable in a multivariate way and detects which variable could discriminate between these two groups of subjects and deliver a classification for predicting the group membership of new observation ( Tabachnick et al., 2007a; Tabachnick et al., 2007b; Gonzalez-Martinez et al., 2021).
Assumptions
Before the application of the discriminant analysis test, some basic assumptions had to be tested. The independent variables were tested for multivariate normality so that the predictors should of interval or ratio levels. The presence of outliers was tested using Mahalanobis distance versus chi-square. The data also tested for linearity assumption between the outcome variables and explanatory ones using a simple scatter plot (Utts, 2014). The homogeneity of covariance matrices among levels of the dependent variables was tested using Box’s M test according to Hahs-Vaughn (2016) who assumes the significance of the test was at (P < 0.001). The multicollinearity among supposed discriminators was tested using the variance inflation factor (Abdelrahman et al., 2020).
Research problem
The data collected were from productive and reproductive records, to determine which productive and reproductive parameter is the best to discriminate between both Baladi buffaloes and cross-bred. From a management point of view, it is very important to classify individuals between the two breeds of buffaloes correctly. This would improve the financial situation of the farm, as rearing individuals with good productive and reproductive performance will increase the benefits. So, in the current study about eight variables can be identified as possible discriminators for buffaloes breeds- these include MY, DIM, AFC, CI, DO, DP, SPC, and DFI.
Based on the research framework eight hypotheses were established as good classifiers for buffaloe breeds as follows:
H1: Milk yield which is defined as the amount (kg) of milk produced by the buffalo from the beginning of milking until the end of lactation throughout the year. H2: Days in milk which is the time (days) at which cows start milk production after parturition until the time of drying off. H3: Age at first calving which is the period (months) that starts from the birth date of the animal until the first calving. H4: Calving interval which is the interval (months) between two successional calving dates and it is the sum of lactation length and dry period. H5: Days open which is the time (days) elapsed between the calving date and the date at which the buffalo is conceived. H6: Dry period which is the period (weeks) that starts from the drying off date of the buffalo until the beginning of the next lactation season. H7: No. of services per conception which can be defined as the number of services (rate) required by the buffalo to be conceived. H8: Days to the first insemination which is the number of days elapsed from the calving date until the buffalo receive the first service.
Before the analysis of the collected data, the sample was split into two unequal parts; the first is the analysis sample which considers the original one selected to apply the analysis and represents about 65% of the total sample size, the second one represents the unselected portion called holdout sample which used in proving the goodness of the model, it represents about 35% of the total sample size (Ramayah et al., 2010). To compare the goodness of the model using hold-out sample data, three benchmarks were used:
(1) Maximum chance
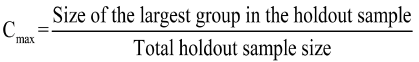 (1)
(1)
(2) Proportional chance
 (2)
(2)
Where: P is the proportion of individuals in group 1 of the hold-out sample. 1-P is the proportion of individuals in group 2 of the hold-out sample.
(3) Press Q
 (3)
(3)
Where: Q is the with 1 degree of freedom, N is the total size of the holdout sample, n is the number of individuals correctly classified, and k is the number of groups in the hold-out sample.
Discriminant function
The number of discriminant functions created by the discriminant analysis can be calculated by the difference between the number of levels of the dependent variable to one or the number of predictor variables, which is smaller (Moawed and Osman, 2017).
In this study, the discriminant analysis used is the simplest type, as the number of categories of the dependent equals two. This means that there is only one discriminant function delivered by the analysis and passes through the means of the two groups (Centroids). For each case, the discriminant coefficient estimated for each independent variable is multiplied by the corresponding score for each predictor, and the products are summed and added to a constant to obtain the composite score, which is the discriminant score for that case. The linear discriminant function is represented as
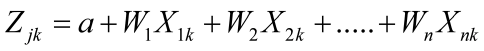 (4)
(4)
Where: Zjk is the discriminant Z score of discriminant function j for the buffaloes’ breed k, a is a constant, Wi is the discriminant coefficient or weighting of the independent variable I, and Xj is the independent variable i (MY and DIM, AFC, CI, DO, DP, SPC, and DFI) for buffaloes’ breed k.
Also, this equation can be written in a standardized form, which allows for comparing variables measured at different scales. This can be done by subtracting the mean value for each independent variable and dividing it by the corresponding standard deviation. The higher the absolute value of the coefficient the greater the discriminating ability of the corresponding variable, as the discriminant coefficient shows the contribution of each independent variable uniquely in the classification of the groups of the dependent variable (Antonogeorgos et al., 2009). All statistical analysis was carried out using SPSS V. 25.0. (IBM Corp, 2017).
Tests of significance
Eigenvalue: It is called characteristic roots, as it is the ratio between explained and unexplained variations in the model. For each discriminant function, there is only one eigenvalue. The higher eigenvalue indicates stronger discriminating power of the function, as it is logical for this model that the ratio between-groups sum of a square and within-groups sum of squares is relatively large and this indicates that the independent variables and the dependent one are related (Panagiotakos, 2006).
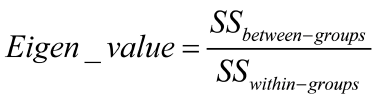 (5)
(5)
Canonical correlation: It is a measure of the degree of association between the levels of the dependent variable and the discriminant function. The higher the correlation coefficient the stronger the association between groups of the dependent variable and discriminant scores (Fouda et al., 2012).
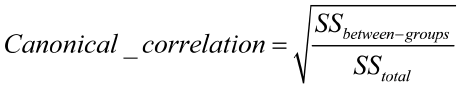 (6)
(6)
Eta-squared statistic (Explained variability): It is a measure of the percent of the variation in the dependent variable accounted by the model. It is the ratio between groups the sum of squares to the total sum of squares (Panagiotakos, 2006).
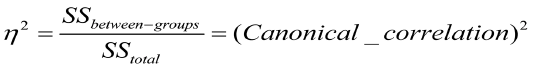 (7)
(7)
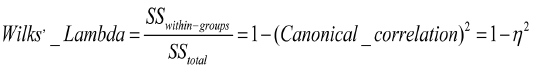
Wilks, Lambda (Unexplained variability): It is a multivariate test that evaluates the discriminating power of the independent variables (i.e. it is a test for the significance of the discriminant function). It is the proportion of total variation in discriminant scores not explained by the difference among groups. It is represented by the ratio of the within groups’ sum of squares to the total sum of squares. Its value ranged from 0-1. The small lambda value indicates a significant discriminant function, which is revealed by the significance of the chi-square (Antonogeorgos et al., 2009).
 (8)
(8)
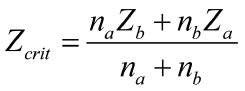
Group centroids and Cutting score: Group centroids are defined as the mean of discriminant scores for each group of the dependent variable in each discriminant function. In the case of two group dependent variables, the centroids are in a unidimensional space, with one center for each group because there is only a single discriminant function. The cutting score is used to create the classification matrix and to classify the two groups uniquely. The optimal cutting score depends on the group size (Ramayah et al., 2010). In case of unequal group size, the formula is shown as follows:
 (9)
(9)
Where: Z crit is the optimal cutting score between groups a and b, Na is the number of individuals in group a, nb is the number of individuals in group b, Za is the centroid of group a, and Zb is the centroid of group b.
Classification rules:- if Z score > Z crit the individual would be classified as in group a.
- if Z score ≤ Z crit the individual would be classified as in group b.
RESULTS
The first step in the analysis of data is testing if there is a violation of assumption or not, the results showed the violation of multivariate normality even with log transformation of data. Duda et al. (2001) mentioned that even with a violation of the normality assumption, the discriminant analysis performs well in the tasks of face and object recognition. The absence of multivariate outliers was shown by Mahalanobis distance (Minimum Mahalanobis = 0.75, and P > 0.05). Scatter plots that were used to test the linearity assumption revealed a linear relationship between the outcome variable and each of the explanatory variables. The homogeneity of covariance matrices between groups of the dependent variable was tested using Box’s M statistic which shows the violation of this assumption (Box’s M = 364.631, F = 9.852, and P < 0.001). the discriminant analysis test is a robust technique that can accommodate the violation of assumptions if the researchers used a large sample size (Moawed and Osman, 2017). The variance of the inflation factor shows the absence of multicollinearity among predictor variables.
The predictive accuracy of the model (or hit ratio which is the percent of individuals correctly classified) for the analysis sample was 83.1%, for the cross-validation sample was 82.6%, and 82.2% for the holdout sample (Tables 1, 2, and 3). The maximum chance value (83.1%) was slightly closer to the hit ratio of the holdout sample (82.2%) but higher than the value of the proportional chance (66.2%), also it was found that the press Q statistic of 134.4 was significa-
Table 1: Hit ratio for cases selected in the analysis.
| Original group | No. of cases | Predicted group membership | |
| Crossbred | Baladi breed | ||
| Crossbred | 763 | 745 | 18 |
| Baladi breed | 164 | 132 | 32 |
Percentage of original grouped cases correctly classified: 83.1%.
Table 2: Hit ratio for cases selected in the analysis.
| Original group | No. of cases | Predicted group membership | |
| Crossbred | Baladi breed | ||
| Crossbred | 763 | 743 | 20 |
| Baladi breed | 164 | 132 | 32 |
Percentage of cross-validated grouped cases correctly classified: 82.6%. Cross-validation is done only for those cases in the analysis. In cross-validation, each case is classified by the functions derived from all cases other than that case.
-nt (Table 4), so that it could be contributed that the model has good predictive power. In Table 5, the univariate analysis showed that five significant variables (AFC, MY, CI, DO, and DFI) carry a positive sign, which means that those variables help in discriminating individuals of cross-breed buffaloes. While days in milk and dry period carry a negative sign and could discriminate individuals in Baladi breed buffaloes. It was obvious that individuals with a suitable time to start calving for the first time, suitable calving interval, days open, days to the first insemination, and higher milk production could be discriminated as cross-breed buffaloes individuals, while those individuals with shorter days in milk, dry period and smaller in the number of services could be discriminated as Baladi breed buffaloes. The unstandardized coefficients are used to create the canonical discriminant function:
Table 3: Hit ratio for cases selected in the holdout sample
| Original group | No. of cases | Predicted group membership | |
| Crossbred | Baladi breed | ||
| Crossbred | 270 | 258 | 12 |
| Baladi breed | 55 | 46 | 9 |
Percentage of unselected original grouped cases correctly classified: 82.2%.
Table 4: Comparison of the goodness of the model developed.
| Measures | Values | Hit ratio for Holdout sample |
| Maximum chance | 83.1 | 82.2 |
| Proportional chance | 66.2 | 82.2 |
|
Comparison with Hair (2009) 1.25 times higher than chance |
0.85 | |
| Press Q table value | 8.929 | |
| Press Q calculated value | 134.4 | |
Table 5: Summary of interpretive measures for discriminant analysis
| Independent variables | Unstandardized canonical discriminant function | Standardized canonical discriminant function | Discriminant loadings (rank) | Univariate F ratio |
| AFC/ months | 0.024 | 0.111 | 0.200 (7) | 5.509* |
| MY /year/ kg | 0.002 | 1.122 | 0.609 (1) | 50.889** |
| DIM/ days | -0.015 | -0.724 | 0.263 (5) | 9.501** |
| CI/ months | 0.142 | 0.371 | 0.478 (4) | 33.281** |
| SPC rate | -0.475 | -0.315 | -0.072 (8) | 0.702 |
| DP/ weeks | -0.060 | -0.158 | 0.255 (6) |
8.894** |
| DO/ days | 0.006 | 0.463 | 0.520 (2) | 37.032** |
| DFI/ days | 0.004 | 0.159 | 0.499 (3) | 34.060** |
| Constant | -4.070 | |||
| Eigen-value | 0.237 | |||
|
Wilks, Lambda |
0.808** | |||
| Canonical correlation | 0.438 | |||
|
(Canonical correlation)2 = ƞ2 |
0.192 | |||
*P < 0.05; **P < 0.01
AFC= Age at first calving/ months, MY= Milk yield/year/kg, DIM= Days in milk/ days, CI= Calving interval/ months, SPC rate= Number of services per conception/ rate, DP= Dry period/ weeks, and DFI= Days to the first insemination/ days.
The canonical discriminant coefficients in the previous discriminant function showed that CI, DP, and AFC have the highest contributions in discriminating between crossbred and Baladi buffaloes. While the no. of services per conception had a non-significant contribution compared to other discriminators and could be excluded from the model. The
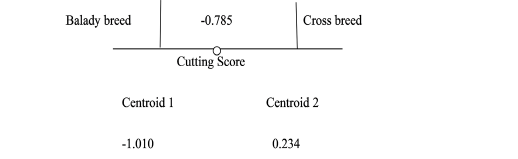
Wilks’ Lambda was significant and showed that the proportion of unexplained variation in the model was 0.808 and this value is smaller than one which means a significant discriminant function. With a canonical correlation equal to 0.438, it was concluded that 19.2% of the variation in the dependent variable was explained by the model (ƞ2). Table 5, showed that the highest loading was for milk yield and the lowest one was for the number of services per conception. The means comparison for independent variables used in this study between groups of the dependent variables showed superiority for crossbred over Baladi buffaloes (Table 6). The mean of discriminant scores for the crossbred equals 0.234, while it was -1.010 for Baladi buffaloes (Table 7).
Table 6: Mean comparison of crossbred and Baladi breed buffaloes.
| Variables | Crossbred | Baladi breed | F-value |
| AFC/ months | 29.1890 | 28.0550 | 5.509* |
| MY /year/ kg | 2253.9066 | 1848.5688 | 50.889** |
| DIM/ days | 250.4076 | 234.0459 | 9.501** |
| CI/ months | 15.0255 | 13.4206 | 33.281** |
| SPC rate | 1.5372 | 1.5963 | 0.702 |
| DP/ weeks | 5.6560 | 4.8241 | 8.894** |
| DO/ days | 190.7856 | 137.1468 | 37.032** |
| DFI/ days | 85.9533 | 63.0550 | 34.060** |
AFC= Age at first calving/ months, MY= Milk yield/year/kg, DIM= Days in milk/ days, CI= Calving interval/ months, SPC rate= Number of services per conception/ rate, DP= Dry period/ weeks, and DFI= Days to the first insemination/ days.
Table 7: Group centroids of crossbred and Baladi breed buffaloes.
| Group Centroids | |
| Crossbred | 0.234 |
| Baladi breed | -1.010 |
Calculation of the cutting score:
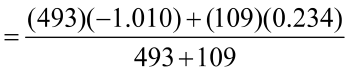 = -0.785
DISCUSSION
Clinical epidemiology is a cornerstone that is designed to provide outlines for improving health outcomes (Bruce et al., 2017), detecting emerging diseases (Motulsky, 2018), incorporating new protocols to understand the health status and evaluate it (Rothman, 2012), analyzing the risk of the associates and influencing factors (Noordzij et al., 2017), provide a guide for scoring of the population performance and reproduction (Brink, 2021), and providing clues for the field of prophylactics and preventive measures in the plans of biosecurity (Szklo and Nieto, 2019; Soliman and Mahmoud, 2021; Mahmoud et al., 2022). Many clinical measures could be calculated and used to score the productive (Xu et al., 2018) and reproductive (Ogino et al., 2012) performance such as milk yield (MY /kg) and days in milk (DIM /days), age at first calving (AFC /months), calving interval (CI /months), days open (DO /days), dry period (DP /weeks), no. of services per conception (SPC /rate), and days to the first insemination (DFI /days) as reported by Wiemken and Kelley (2020).
Buffaloes are known for their high resistance to disease, high adaptability to various macroclimatic conditions, and dietary flexibility (Wanapat and Kang, 2013; Singh et al., 2018; Guerrero-Legarreta et al., 2020). Buffalo meat has gained a lot of importance for reduced fat and cholesterol. Buffalo calves usually weigh up to 24 kg at birth and achieve an adult weight of up to 450-550 kg, their first conception can be carried out at 24-36 months and the first calving at 4 years, as well as they can reproduce up to 18 years (De la Cruz-Cruz et al., 2014; Juárez et al., 2019; Rashad et al., 2019). Buffaloe can be slaughtered with a dressing percentage of up to 55%, less marbling compared to cattle for the lower fat and cholesterol contents, less affection from the low feeding regimen, comparable water holding capacity, tenderness, and firmness to cattle, with good marbling score, and good physicochemical, functional, and nutritional values of their meat (Cruz-Monterrosa et al., 2020).
Human populations are increasing tremendously with increased demands for animal protein sources which is why many countries tend to modify their amount and composition of food consumed and increase the variability of the market animal protein sources (Iqbal et al., 2018; Mello et al., 2018). That is why buffalo meat was the target for the crossbreeding field. To enhance the productive and reproductive functions of buffaloes, it was important to harvest the most important genes responsible for the productivity and reproductivity of buffaloes in the crossbreeding processes (Zardari et al., 2017; Ahmed et al., 2020). Crossbred animals tend to have better growth rates, feed intake, feed conversions, and weight gains, as well as higher reproductive indices and higher meat and milk quality (Li et al., 2018; Huang et al., 2020). Crossbreeding is impacted by numerous environmental factors as reported by Park et al. (2020) and Angrecka et al. (2017).
Crossbreeding increases production levels for breeders in two ways, firstly it combines the desirable traits of two or more breeds, so increasing the performance of the produced crossbred animals. This is called breed complementarity, that the strong points of one breed are covered by the weak points of the other breed. The second benefit of crossbreeding is Heterosis, which is the increasing performance of crossbred animals for certain traits over that of their straight-bred parents (Evans and McPeake, 2017). Heterosis measures the difference in the performance of progeny from the average performance of the straight-bred parents of breeds included in the cross.
Hamid et al. (2017); Hamid (2018) and Rashid et al. (2019) reported that production and reproduction efficiencies in Nilli and Murrah crossbred buffaloes in Bangladesh scored higher in average age, body conditions, body weights, milk production, sexual maturity, estrus cycle length, insemination time, gestation length, first calving age, number of services per conception, calving intervals, and waiting period compared to the local breeds. Uddin et al. (2016); Joele et al. (2017); Mujawar et al. (2019) reported also that extensive and semi-extensive farmed buffaloe crossbreds were able to produce in higher milk quantities compared to local breeds. They also stated that balanced diets and proper management systems contributed to better production in buffalo crossbred. Luz et al. (2017); Ekiz et al. (2018); Panea et al. (2018) reported that buffaloe crossbreds were superior to the local breeds in performance, weight gain, meat quality, and milk production. Kim et al. (2017); Tamburrano et al. (2019); Muroya et al. (2020); Yamada et al. (2020) recorded higher meat quality and better physicochemical characteristics of buffaloe meat from crossbred compared to the local breeds.
This study was carried out to test the ability of single discriminant analysis to differentiate between both cross-breed and Baladi breed buffaloes based on MY (kg) and DIM (days) as a productive measure, and AFC, CI, DO, DP, SPC, and DFI as a reproductive measure. These results revealed that discriminant analysis can perform well in classification between the two buffaloe breeds. This result agreed with this mentioned by Abdelrahman et al. (2020) who reported that linear discriminant analysis is a good tool in discrimination between calving seasons based on 305-days milk yield, fat %, protein %, days open, number of services per conception, and days to the first insemination. The current results declared that the model is of good predictive power for the analysis sample was 83.1%, for the cross-validation sample was 82.6%, and was 82.2% for the holdout sample. The maximum chance value (83.1%) was slightly closer to the hit ratio of the hold-out sample (82.2%) but higher than the value of the proportional chance (66.2%), also it was found that the press Q statistic of 134.4 was significant, so that it could be contributed that the model has good predictive power. These results were found to be similar to that of (Ramayah et al., 2010) who reported that the model was of good predictive power as the hit ratios for the analysis sample, cross-validation sample, and holdout sample were 85.8 %, 85%, and 90.8%, respectively. The hit ratio for the holdout sample of 90.8% exceeds the value of both maximum chance (80%) and proportional chance (68%). The press Q statistic (43.22) was significant. The study results revealed that AFC, MY, DIM, CI, DP, DO and DFI were the most important significant discriminators between crossbred and Baladi breed buffaloes, while No. of services per conception was found to be of non-significant effect. The contribution of CI in the discriminant function was the highest (0.142) followed by DP (-0.060), AFC (0.024), DIM (-0.015), DO (0.006), DFI (0.004), and MY (0.002). Abdelrahman et al. (2020) found that days open followed by the number of services per conception, then 305-day milk yield was the most important predictor in differentiation between calving seasons. While fat % and protein % were found to be non-significant discriminators for calving seasons. The degree of association between the discriminant function and the groups of buffaloe breeds was 0.438, which means that 19.2% of the variance that occurs in the dependent variable is explained by the discriminant function. Ramayah et al. (2010) showed that the canonical correlation was 0.45 so 20.3% of the variance in the dependent variable is explained by the model, which is nearly in the same line as the current study. The study of Fouda et al. (2012) revealed three discriminant functions, the first one explains about 41.9% of variations between breeds with canonical correlation (0.53), the second one explains 19.5% of the variation in the dependent variable with canonical correlation (0.42) and finally, the third one revealed 2.2% of variations in the grouping variable with canonical correlation (0.15).
CONCLUSION and RECOMMENDATIONS
Buffalo crossbreds were superior to the Baladi buffaloes in the productive and reproductive traits that were calculated using some clinical epidemiological measures (MY; kg, DIM; days, AFC; months, CI; months, DO; days, DP; weeks, SPC rate, and DFI; days).
Even with the violation of some assumptions such as multivariate normality and homogeneity of covariance matrices between groups of the dependent variable, the discriminant analysis is still a robust technique that can perform well under that condition with a large sample size. The analysis shows superiority for cross-breed over Baladi breed buffaloes in mean comparison. AFC, MY, CI, DO and DFI variables show significant effects with a positive sign in discriminating individuals of the crossbred group, while DIM and DP variables show significant effects with a negative sign that could discriminate individuals of Baladi buffaloes.
The study recommends the researchers to the importance of using discriminant analysis to discriminate between different groups to overcome the common mistakes that usually occurred while using traditional multivariate analysis and other non-parametric alternatives.
ACKNOWLEDGMENTS
Sincere thanks should be provided to doctor A.A. Wahdan the technical manager at Elanco pharma for helping in obtaining data that was used in the analysis.
COMPETING INTERESTS
The authors declare that they have no known competing financial interests or personal relationships that could have appeared to influence the work reported in this paper.
NOVELTY STATEMENT
The manuscript provided a clue for many researchers on the importance of single discriminant analysis and its reliance on clinical epidemiological measures, as well as the productive and reproductive traits to differentiate between the different breeds and/or the breeds and crossbreds.
AUTHORS’ CONTRIBUTION
AFF participated in designing the study design, collaborated in data collection, conducted the biostatistical analysis of the data, and took part in the writing of the manuscript. RAH participated in data collection, evaluated the productive and reproductive traits, and took part in the writing of the manuscript. ESS participated in designing the study design, participated in data collection, conducted the clinical epidemiological measures calculations, took part in the writing of the manuscript, and reviewed the final edit of the manuscript.
REFERENCES
Abdelrahman HA, Kamel ER, Hassan FA (2020). Application of linear discriminant model to evaluate the association between milk production, reproductive performance, and calving season in dairy cattle. Benha Vet. Med. J., 39(2): 138-141. Https://doi.org/10.21608/bvmj.2020.50592.1300
Ahmed S, Shahzad F, Rahman H, Rajab M (2020). Effects of sugar beet pulp based total mixed ration on growth performance and blood profile status in male Nili Ravi buffalo calves. Turkish J. Vet. Anim. Sci., 44(4): 928–933. Https://doi.org/10.3906/vet-1912-99
Angrecka S, Herbut P, Nawalany G, Sokołowski P (2017). The impact of localization and barn type on insolation of sidewall stalls during summer. J. Ecolog. Engineer., 18(4): 60–66.Https://doi.org/10.12911/22998993/74398
Antonogeorgos G, Panagiotakos DB, Priftis KN, Tzonou A (2009). Logistic regression and linear discriminant analyses in evaluating factors associated with asthma prevalence among 10-to 12-years-old children: Divergence and similarity of the two statistical methods. Int. J. Pediat. 2009. Article ID: 952042. https://doi.org/10.1155/2009/952042
Baron JA, Sørensen HT, Sox HC (2015). Teaching Epidemiology: A guide for teachers in epidemiology, public health and clinical medicine. 4th eds. Chapter 24: Clin. Epidemiol. Pp. 444-462. https://doi.org/10.1093/acprof:oso/9780199685004.003.0024
Brinks R (2021). Illness-Death Model in Chronic Disease Epidemiology: Characteristics of a Related, Differential Equation and an Inverse Problem.
Bruce N, Pope D, Stanistreet D (2017). Quantitative methods for health research: a practical interactive guide to epidemiology and statistics (Second ed.). Hoboken, NJ. p. 16. ISBN 978-1-118-66526-8. OCLC 992438133
Cataldo R, Arancibia M, Stojanova J, Papuzinski C. (2019). General concepts in biostatistics and clinical epidemiology: Observational studies with cross-sectional and ecological designs. Medwave, 19(8): e7698. Https://doi.org/10.5867/medwave.2019.08.7698
Cruz-Monterrosa R, Mota-Rojas D, Ramirez-Bribiesca E, Mora-Medina P, Guerrero-Legarreta I (2020). Scientific Findings on the Quality of River Buffalo Meat and Prospects for Future Studies. J.Buffalo Sci., 9(2020): 170–180. https://doi.org/10.6000/1927-520X.2020.09.18
De la Cruz-Cruz L, Guerrero-Legarreta I, Ramirez-Necoechea R, Roldan-Santiago P (2014). The behaviour and productivity of water buffalo in different breeding systems: A review. Vet. Med., 59(4): 181–193. https://www.agriculturejournals.cz/publicFiles/124484.pdf
Duda, RO, Hart PE, Stork DG (2001). Pattern classification., 2nd ed. New York: Wiley, 2001.
Ekiz B, Yilmaz A, Yalcintan H, Yakan A, Yilmaz I, Soysal I (2018). Carcass and meat quality of male and female water buffaloes finished under an intensive production system. Ann. Anim. Sci., 18(2): 557–574. Https://doi.org/10.1515/aoas-2017-0036
Estrada S, Arancibia M, Stojanova J, Papuzinski C (2020). General concepts in biostatistics and clinical epidemiology: Experimental studies with randomized clinical trial design. Medwave., 20(2): e7869. Https://doi.org/10.5867/medwave.2020.02.7869
Evans J, McPeake (2017). Crossbreeding beef cattle, I. Oklahoma State University Extension. ID: AFS-3150. https://extension.okstate.edu/fact-sheets/crossbreeding-beef-cattle-i.html
González Ariza A, Arando Arbulu A, León Jurado JM, Navas González FJ, Delgado Bermejo JV, Camacho Vallejo ME (2021). Discriminant canonical tool for differential biometric characterization of multivariety endangered hen breeds. Animals, 11(8): 2211. https://doi.org/10.3390/ani11082211
Gonzalez-Martinez A, De-Pablos-Heredero C, González M, Rodriguez J, Barba C, García A (2021). Usefulness of discriminant analysis in the morphometric differentiation of six native freshwater species from Ecuador. Animals., 11(1): 111. https://doi.org/10.3390/ani11010111
Guerrero-Legarreta I, Napolitano F, Cruz-Monterrosa R, Mota-Rojas D, Mora-Medina P, Ramírez-Bribiesca E, Bertoni A, Berdugo-Gutiérrez J, Braghieri A (2020). River Buffalo Meat Production and Quality: Sustainability, Productivity, Nutritional and Sensory Properties. J. Buffalo Sci., 9(2020): 159–169. https://doi.org/10.6000/1927-520X.2020.09.17
Hahs-Vaughn DL (2016). Applied multivariate statistical concepts, 1st ed. New York: Routledge. https://doi.org/10.4324/9781315816685
Hair JF (2009). Multivariate data analysis.
Hamid H (2010). A new approach for classifying large number of mixed variables. World Academy of Science: Int. J. Mathematical, Computational, Physical, Elect. Computer Engineer., 4(10): 1355- 1360. scholar.waset.org/1999.7/14621
Hamid MA (2018). Study on the effect of insemination time on pregnancy rate of Bangladeshi buffalo in intensive farming. SAARC J. Agric., 16(2):143–152. https://doi.org/10.3329/sja.v16i2.40266
Hamid MA, Zaman MA, Rahman A, Hossain KM (2017). Buffalo genetic resources and their conservation in Bangladesh. Research Journal of Veterinary Science, 10:1–13. https://doi.org/10.3923/rjvs.2017.1.13
Huang J, Wu T, Sun X, Zou C, Yang Y, Cao Y, Yang Y, Iqbal MW, Lin B (2020). Effect of replacing conventional feeds with tropical agricultural by-products on the growth performance, nutrient digestibility and ruminal microbiota of water buffaloes. J. Anim. Physiol. Anim. Nutrit., 104(4): 1034–1042. https://doi.org/10.1111/jpn.13358
IBM Corp SPSS (2017). Statistics for windows, version 25.0. J Armonk, NY: IBM Corp.
Iqbal ZM, Abdullah M, Javed K, Jabbar MA, Ditta YA (2018). Evaluating varying levels of concentrate on productive and metabolic performance of Nili-Ravi buffalo heifer calves. J. Anim. Plant Sci., 28(5): 1256–1262.
Joele MR, Lourenço LF, Lourenço Júnior JB, Araújo GS, Budel JC, Garcia AR (2017). Meat quality of buffaloes finished in traditional or silvopastoral system in the Brazilian Eastern Amazon: Meat quality of buffaloes. J. Sci. Food Agricult., 97: 1740-1745. https://doi.org/10.1002/jsfa.7922
Juárez M, López-Campos Ó, Prieto N, Roberts J, Galbraith J, Failla S, Aalhus JL (2019). Carcass characteristics and meat quality of bison, buffalo, and yak. In More than Beef, Pork and Chicken—The Production, Processing, and Quality Traits of Other Sources of Meat for Human Diet; Lorenzo, J.M., Munekata, P.E.S., Barba, F.J., Toldrá, F., Eds.; Springer International Publishing: Cham, Switzerland, 2019; pp. 95–117. Https://doi.org/10.1007/978-3-030-05484-7_5
Kambri EH, Atalie TC, Colin O, Madika B, Preetha B, Charles P, Popat RA (2016). An innovative blended preclinical curriculm in clinical epidemiology and biostatistics: impact on student satisfaction and performance. Acad.Med., 91(5): 696-700. https://doi.org/10.1097/ACM.0000000000001085
Kim H, Do HW, Chung H (2017). A comparison of the essential amino acid content and the retention rate by chicken part according to different cooking methods. Korean J. Food Sci. Anim. Res., 37(5): 626–634. /https://doi.org/10.5851/kosfa.2017.37.5.626
Li Q, Wang Y, Tan L, Leng J, Lu Q, Tian S, Shao S, Duan C, Li W, Mao H (2018). Effects of age on slaughter performance and meat quality of Binlangjang male buffalo. Saudi Journal of Biological Sciences, 25(2): 248–252. https://doi.org/10.1016/j.sjbs.2017.10.001
Luz PAC, Jorge AM, Francisco CL, Mello JLM, Santos CT, Andrighetto C (2017). Chemical-physical characteristics of buffalo (Bubalus bubalis) meat subjected to different aging times. Acta Scientiarum: Animal Science, 39(4): 419-428. /https://doi.org/10.4025/actascianimsci.v39i4.36799
Mahmoud AE, El-Maghraby MM, Eltarabili RM, Soliman ES (2022). Epidemiological investigations on microbial infection and crystals causing
feline lower urinary tract disease in tomcats in Ismailia, Egypt. Open Vet. J., 12(2): 290-302. Https://doi.org/10.5455/OVJ.2022.v12.i2.18
Martínez D, Papuzinski C, Stojanova J, Arancibia M. (2019). General concepts in biostatistics and clinical epidemiology: Observational studies with case-control design. Medwave, 19(10): e7716. Https://doi.org/10.5867/medwave.2019.10.7716
Mele M, Macciotta N, Cecchinato A, Conte G, Schiavon S, Bittante G (2016). Multivariate factor analysis of detailed milk fatty acid profile: Effects of dairy system, feeding, herd, parity, and stage of lactation. J. Dairy Sci., 99(12): 9820-9833. https://doi.org/10.3168/jds.2016-11451
Mello JLM, Rodrigues ABB, Giampietro-Ganeco A, Ferrari FB, Souza RA, Souza PA, Borba H (2018). Characteristics of carcasses and meat from feedlot-finished buffalo and Bos indicus (Nellore) bulls. Anim. Prod. Sci., 58(7): 1366–1374. https://doi.org/10.1071/AN16556
Moawed SA, Osman MM (2017). The robustness of binary logistic regression and linear discriminant analysis for the classification and differentiation between dairy cows and buffaloes. Int. J. Stat. Applicat. 7(6): 304-310. Https://doi.org/10.5923/j.statistics.20170706.05
Motulsky H (2018). Intuitive biostatistics: a nonmathematical guide to statistical thinking (Fourth ed.). New York. p. 266. ISBN 978-0-19-064356-0. OCLC 1006531983
Mujawar AS, Razzaque WAA, Ramteke SS, Patil AD, Ali SS, Bhikane AU, Khan MA, Mogal IR (2019). Estrus induction and fertility response in postpartum anoestrus Marathwadi buffaloes using hormonal protocol along with vitamin E and Selenium. Int. J. Livest. Res., 9(3):289–96. https://doi.org/10.5455/ijlr.2018111307311
Muroya S, Ueda S, Komatsu T, Miyakawa T, Ertbjerg P (2020). MEATabolomics: Muscle and meat metabolomics in domestic animals. Metabolites, 10: 188. Https://doi.org/10.3390/metabo10050188
Naveena BM, Kiran M. (2014). Buffalo meat quality, composition, and processing characteristics: Contribution to the global economy and nutritional security. Anim. Front., 4(4): 18–24. https://doi.org/10.2527/af.2014-0029
Noordzij M, van Diepen M, Caskey FC, Jager KJ (2017). Relative risk versus absolute risk: one cannot be interpreted without the other. Nephrology, Dialysis, Transplantation. 32 (suppl_2): ii13–ii18.
Nuraini H, Lesa Aditia E, Brahmantiyo B (2018). Meat quality of Indonesian local cattle and buffalo. Chapter 5. In Bovine Science: A Key to Sustainable Development; Sadashiv SO, Sharangouda JP, Eds.; IntechOpen: London, UK, 2018. http://dx.doi.org/10.5772/intechopen.79904.
Ogino S, Fuchs CS, Giovannucci E (2012). How many molecular subtypes? Implications of the unique tumor principle in personalized medicine. Expert Rev. Molecul. Diagnost., 12(6): 621–28. Https://doi.org/10.1586/erm.12.46
Ojo T, Oke O, Iyasere O, Wheto M, Durosaro S, Logunleko M, Adekunle OE, Ndubuisi-Ogbonna L, Daramola JO (2022). Discriminant analysis of sperm cryotolerance among different breeds of chickens in hot humid tropical environment. Research Square. March 17: 2022. https://doi.org/10.21203/rs.3.rs-1359976/v1
Panea B, Olleta JL, Sañudo C, del Mar Campo M, Oliver MA, Gispert M, Serra X, Renand G, del Carmen Oliván M, Jabet S, Garcia S, Lopez M, Izquierdo M, García-Cachán MD, Quintanilla R, Piedrafita J (2018). Effects of breed-production system on collagen, textural, and sensory traits of 10 European beef cattle breeds. J. Texture Stud., 49(5): 528–535. https://doi.org/10.1111/jtxs.12350
Park RM, Foster M, Daigle CL (2020). A scoping review: The impact of housing systems and environmental features on beef cattle welfare. Animals, 10(4): 565. https://doi.org/10.3390/ani10040565
Ramayah T, Ahmad NH, Halim HA, Zainal SRM, Lo M-C (2010). Discriminant analysis: An illustrated example. African J. Business Manag., 4(9): 1654-1667. http://www.academicjournals.org/AJBM
Ramayah T, Md-Taib F, Ling KP (2006). Classifying users and non-users of internet banking in northern malaysia. J. Internet Banking Commerce. 11(2): 1-13. http://www.management.usm.my/ramayah/
Rashad AMA, EL-Hedainy DK, Mahdy AE, Badran AE, El-Barbary ASA (2019). Utilization of live body weight, measurements, and eye muscle components to predict carcass performance of fattened Egyptian male buffalo calves. Trop. Anim. Health Prod., 51, 2405–2412. https://doi.org/10.1007/s11250-019-01950-x.
Rashid MH, Sakar AK, Hasan MMI, Hasan M, Juyena NS (2019). Productive, reproductive, and estrus characteristics of different breeds of buffalo cows in Bangladesh. J. Adv. Vet. Anim. Res., 6(4): 553-560. Https://doi.org/10.5455/javar.2019.f382
Rothman KJ (2012). Epidemiology: An Introduction. Oxford University Press. p. 53. ISBN 978-0-19-975455-7.
Soliman ES, Abdallah MS (2020). Assessment of biosecurity measures in broiler’s farms in the Suez Canal area – Egypt using a seasonal prevalence of Salmonellosis. Vet. World, 13(4): 622-632. https://doi.org/10.14202/vetworld.2020.622-632
Soliman ES, Ali AA, Gafaar REM (2021). Impact of Heating Systems on Air and Litter Quality in Broiler Houses, Performance, Behavior, and Immunity in Broiler Chickens. Ad. Anim. Vet. Sci., 9(2): 301-314. https://doi.org/10.17582/journal.aavs/2021/9.2.301.314
Soliman ES, Hamad RT, Hassan RA (2021). Moderations in performance, immunity, tissue architecture, and vaccine viability induced by water magnetization
in broiler farms. Vet. World., 14(6): 1695-1710. https://doi.org/10.14202/vetworld.2021.1695-1710
Soliman ES, Hassan RA (2017). Evaluation of superphosphate and meta-bisulfide efficiency in litter treatment on productive performance and immunity of broilers exposed to ammonia stress. Adv. Anim. Vet. Sci., 5(6): 253-259. Https://doi.org/10.17582/journal.aavs/2017/5.6.253.259
Soliman ES, Hassan RA (2019). Impact of lighting color and duration on productive performance and Newcastle disease vaccination efficiency in broiler chickens. Vet.World, 12(7): 1052-1059. Https://doi.org/10.14202/vetworld.2019.1052-1059
Soliman ES, Hassan RA, Farid DS (2021). The Efficiency of Natural-Ecofriendly Clay Filters on Water Purification for Improving Performance and Immunity in Broiler Chickens. Open Vet. J., 11(3): 483-499. Https://doi.org/10.5455/OVJ.2021.v11.i3.22.
Soliman ES, Mahmoud AE (2021). In-vitro antimicrobial activity and in-vivo prophylactic influence of tulathromycin against respiratory diseases in dairy heifers exposed to cold stress. Adv. Anim. Vet. Sci., 9(8): 1211-1222. http://dx.doi.org/10.17582/journal.aavs/2021/9.8.1211.1222
Soliman ES, Moawed SA, Ziaan AMG (2016). Assessing cleaning and disinfection regime in a slaughterhouse against carcasses contamination. Adv. Anim.Vet. Sci. 4(9): 449-457. Https://doi.org/10.14737/journal.aavs/2016/4.9.449.457
Soliman ES, Sallam NH, Abouelhassan EM (2018). Effectiveness of poultry litter amendments on bacterial survival and Eimeria oocyst sporulation. Veterinary World, 11(8): 1064-1073. Https://doi.org/10.14202/vetworld.2018.1064-1073
Stasio LD, Brugiapaglia A (2021). Current knowledge on river buffalo meat: A critical analysis. Animals, 11(7): 2111. https://doi.org/10.3390/ani11072111
Szklo M, Nieto FJ (2019). Epidemiology: beyond the basics (4th. ed.). Burlington, Massachusetts: Jones & Bartlett Learning. p. 488. ISBN 9781284116595. OCLC 1019839414
Tabachnick BG, Fidell LS, Ullman JB (2007b). Using multivariate statistics.7th ed. LS. Fidell, California State University, Northridge. Pearson Boston, MA. ISBN 0134790545
Tabachnick BG, Fidell LS, Ullman JB (2007a). Using multivariate statistics. 7th ed. BG. Tabachnick, California State University, Northridge. Pearson Boston, MA. ISBN: 9780134790541
Tamburrano A, Tavazzi B, Callà CAM, Amorini AM, Lazzarino G, Vincenti S, Zottola T, Campagna MC, Moscato U, Laurenti P (2019). Biochemical and nutritional characteristics of buffalo meat and potential implications on human health for a personalized nutrition. Italian J. Food Safety, 8(3): 8317. https://doi.org/10.4081/ijfs.2019.8317
Timm NH (2002). Applied multivariate analysis, 2002. 1st ed. Springer-Verlag New York, Inc.: Springer. https://doi.org/10.4324/9780203809532
Uddin MK, Mintoo AA, Awal TM, Kondo M, Kabir A (2016). Characterization of buffalo milk production system in Bangladesh. Bangladesh J. Anim. Sci., 45(1):69–77. https://doi.org/10.3329/bjas.v45i1.27492
Utts JM (2014). Seeing through statistics: 4th ed. Cengage Learning. ISBN: WCN 02-200-322.
Wanapat M, Kang SC (2013). World buffalo production: Challenges in meat and milk production, and mitigation of methane emission. Buffalo Bullet, 32(S1):1–21. http://ibic.lib.ku.ac.th/.../32-sp1.pdf.
Wiemken TL, Kelley RR (2020). Machine Learning in Epidemiology and Health Outcomes Research. Ann. Rev. Pub. Health, 41: 21–36. https://doi.org/ 10.1146/annurev-publhealth-040119-094437
Xu G, Chen Y, Xu L (2018). Introduction to Chinese Culture: Cultural History, Arts, Festivals and Rituals. Springer. p. 70. ISBN 978-9811081569.
Yamada T, Kamiya M, Higuchi M (2020). Gas chromatography-mass spectrometry-based metabolomic analysis of Wagyu and Holstein beef. Metabolites, 10(3): 95. https://doi.org/10.3390/metabo10030095
Zardari MS, Kaleri HA, Kaleri RR, Kaleri A, Jalbani MA, Kaleri AH, Khan MZ, Qadir Z, Ashraf F (2017). Effect of breed on carcass traits of Kundhi and Nili Ravi buffalo. Pure Appl. Biol., 6(1): 267–271. http://dx.doi.org/10.19045/bspab.2017.60023
To share on other social networks, click on any share button. What are these?


