
Prevalence of Eating Disorders in University Going Students of Islamabad/ Rawalpindi

Prevalence of Eating Disorders in University Going Students of Islamabad/ Rawalpindi
Juweria Abid1, Hooria Latif2, Amir Sohail2, Saroosh Fatima Tahir Syed2, Shakeel Ahmad3, Tooba Asif4 and Muhammad Farooq5*
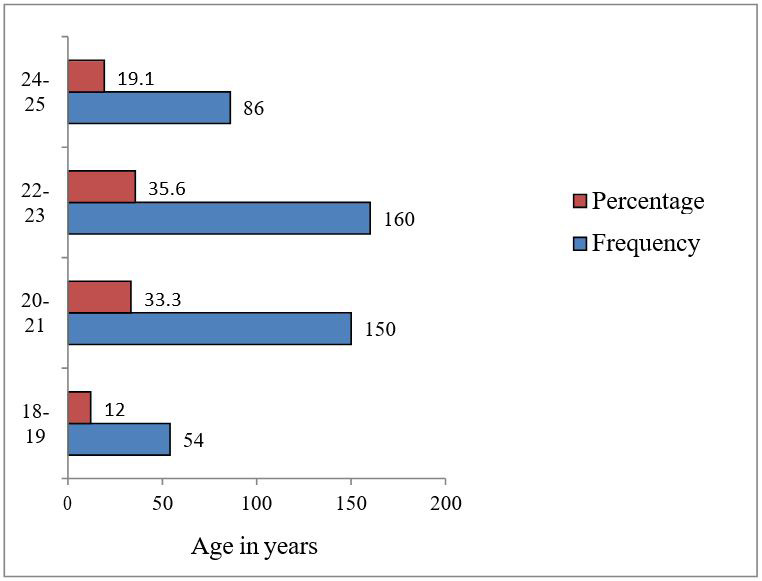
Frequency and percentage of age in years.
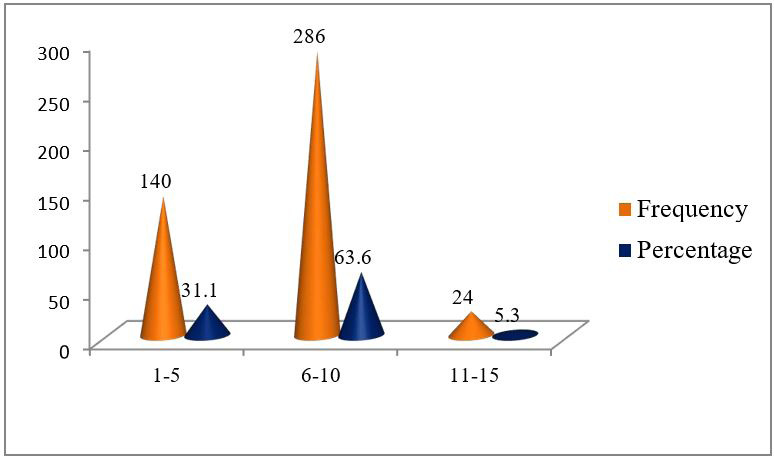
Frequency and percentage of family members.
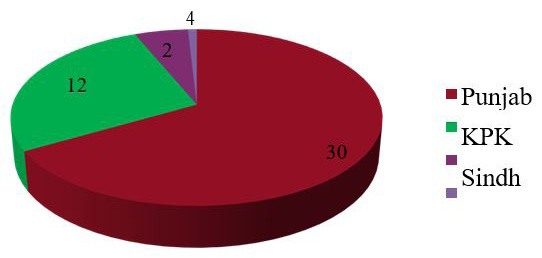
Frequency of ethnicity/origin of university students.

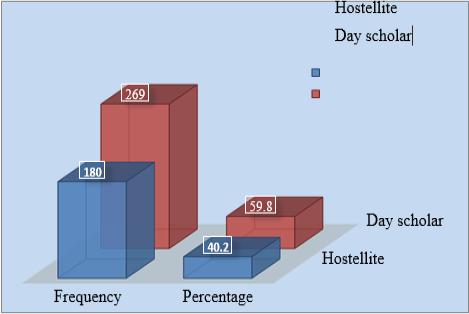
Frequency and percentage of accommodation.

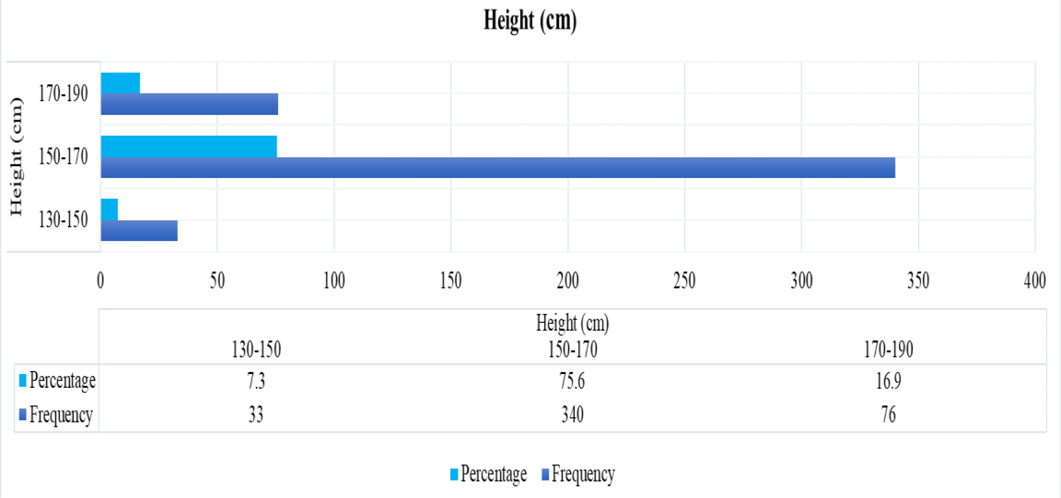
Frequency and percentage of height of university students.

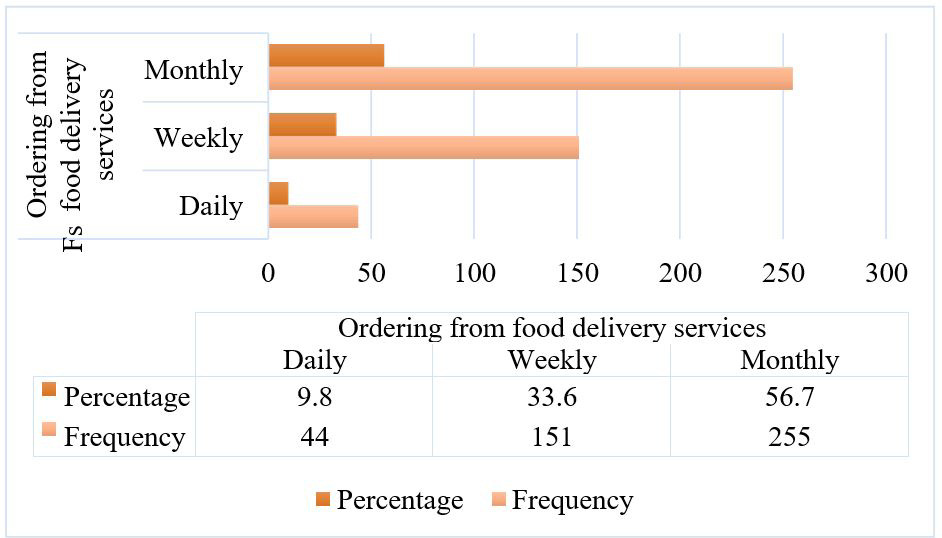
Frequency and percentage of ordering food from food delivery services.
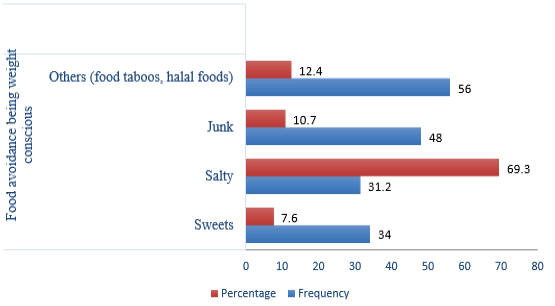
Frequency and percentage of food avoidance being weight conscious.

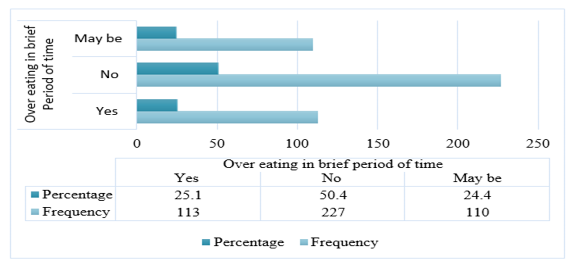
Frequency and percentage of over eating in brief period of time.
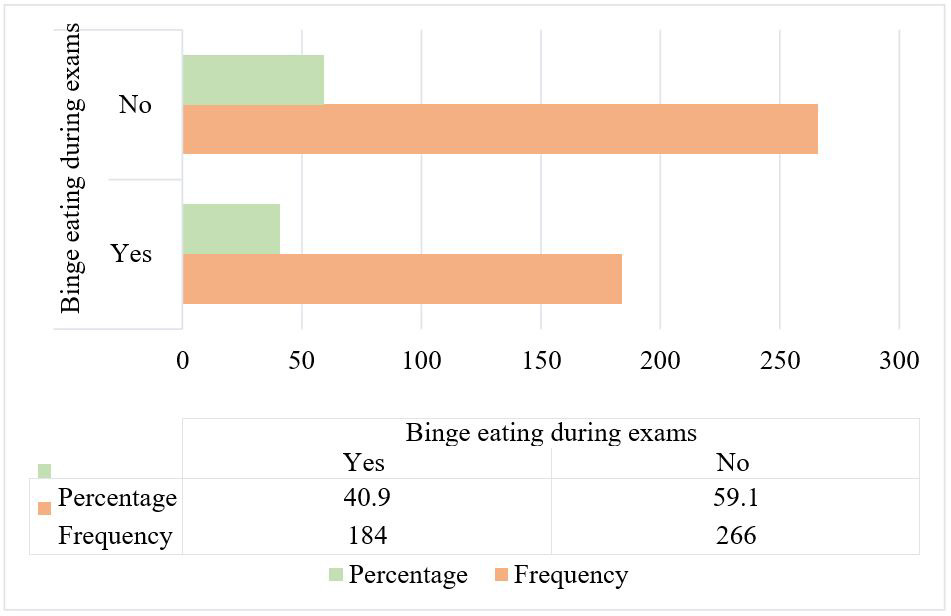
Frequency and percentage of binge eating during exams.

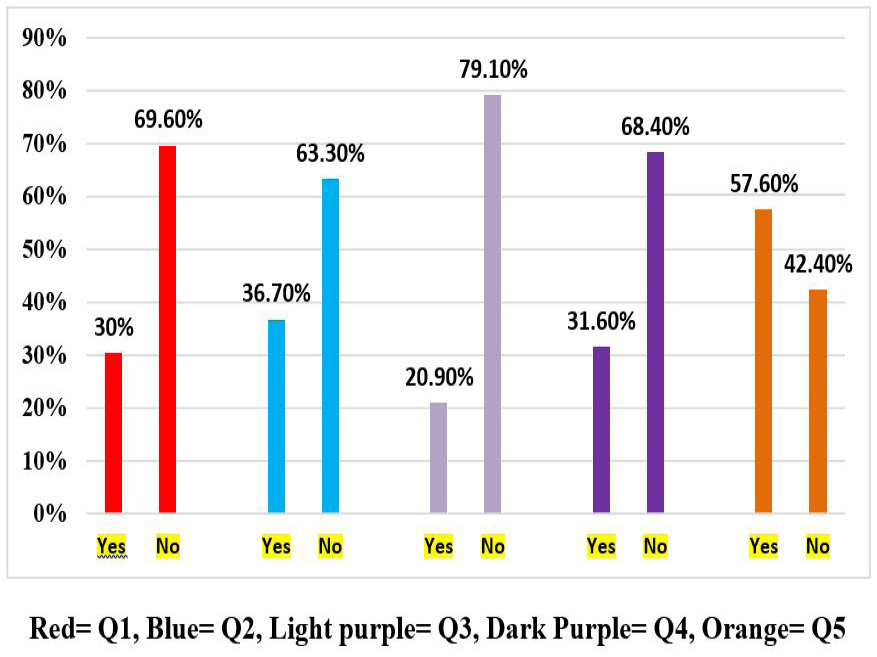
Overall result of SCOFF questionnaire.
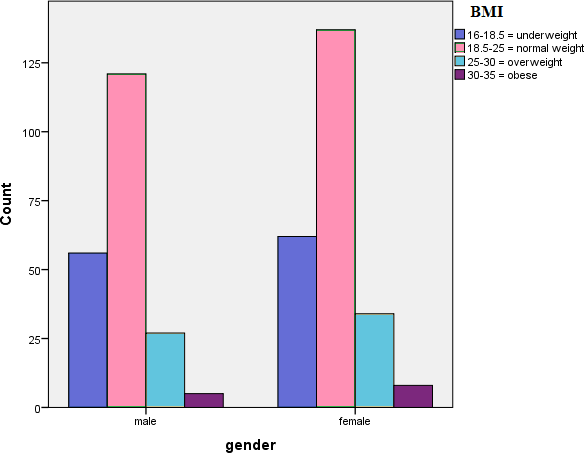
Association of gender with BMI.
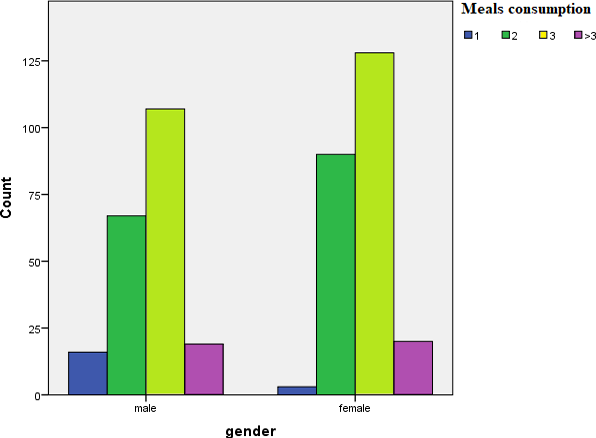
Association of gender with meals consumption.
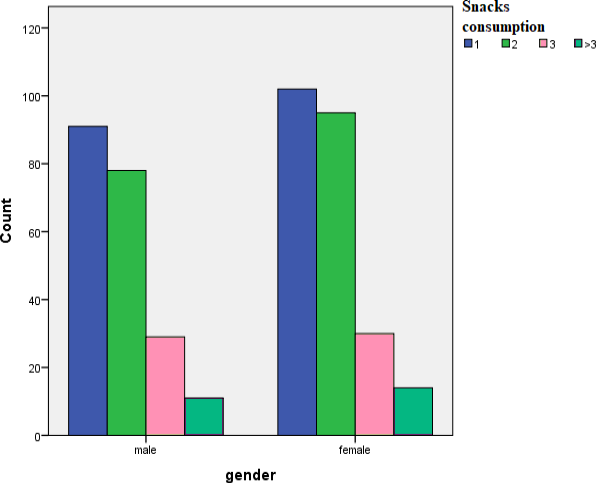
Association of gender with snacks each day.

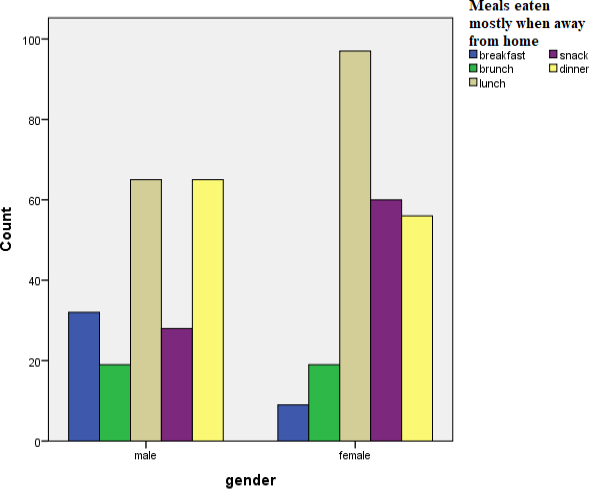
Association of gender with meals eaten away from home.
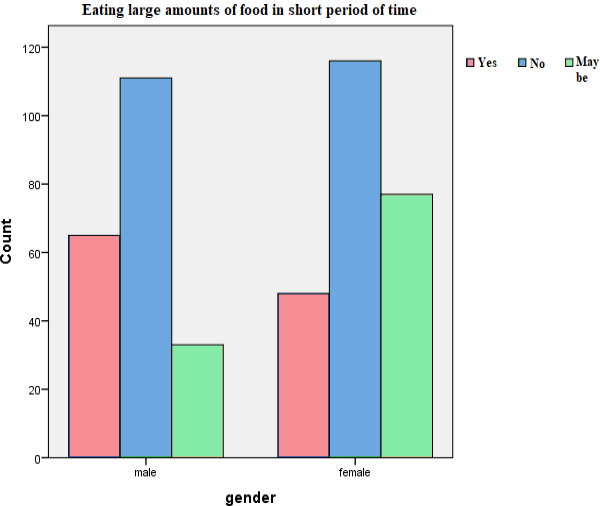
Binge eating in shorter period of time.

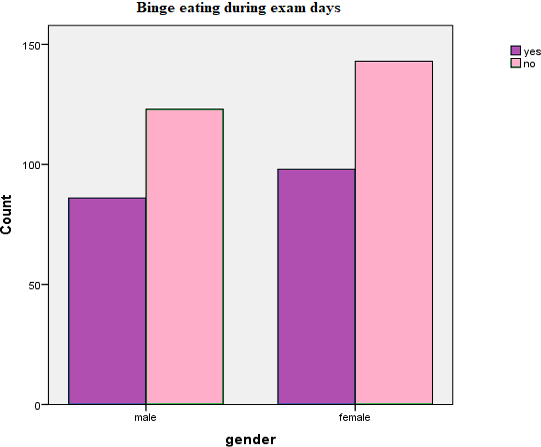
Association of gender with binge eating during exams.

