Preliminary Exploration of Transcriptome Comparative Analysis of Muscle Tissues from Asymptomatic and Diseased Epinephelus fuscoguttatus Infected with Nervous Necrosis Virus
Wei Fang1,2,3, Jiawei Hong1,2,3,4, Zhengyi Fu1,2,3, Jing Hu1,2,3, Gang Yu1,2,3, Zhenhua Ma1,2,3* and Humin Zong5*
1Key Laboratory of South China Sea Fishery Resources Exploitation and Utilization, Ministry of Agriculture and Rural Affairs, Guangzhou 510300, China
2Tropical Aquaculture Research and Development Center, South China Sea Fisheries Research Institute, Chinese Academy of Fishery Sciences, Sanya 572018, China
3Sanya Tropical Fisheries Research Institute, Sanya 572018, China
4State Key Laboratory of Oceanology, College of Marine Sciences, Department of Earth Sciences, Xiamen University, Xiamen 361102, China
5National Marine Environmental Monitoring Center, Dalian 116023, China
* Corresponding author: zhenhua.ma@hotmail.com, hmzong@nmemc.org.cn
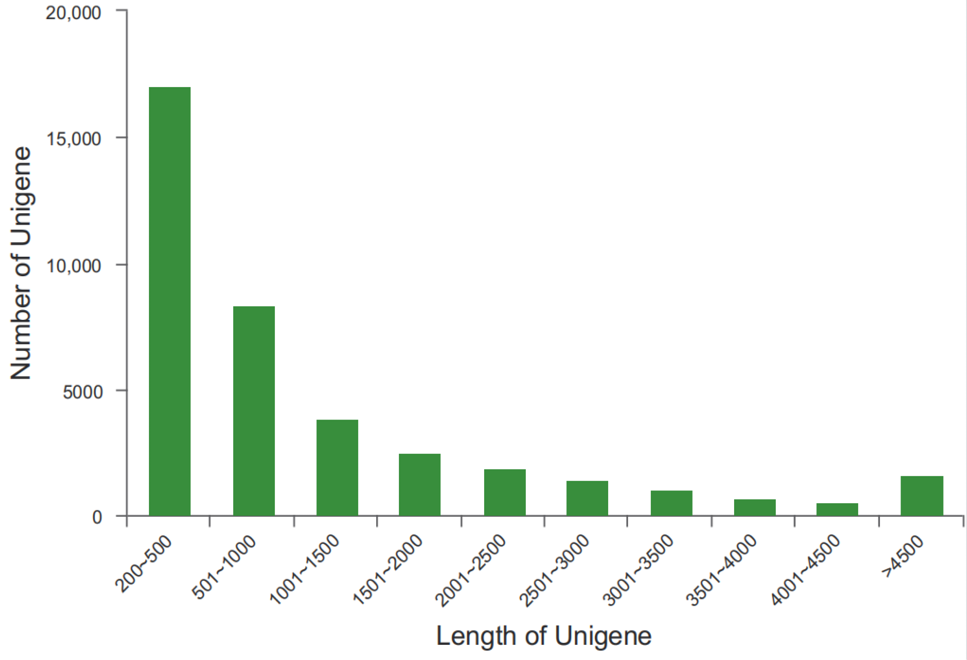
Fig. 1.
Ungene length distribution of E. fuscoguttatus.
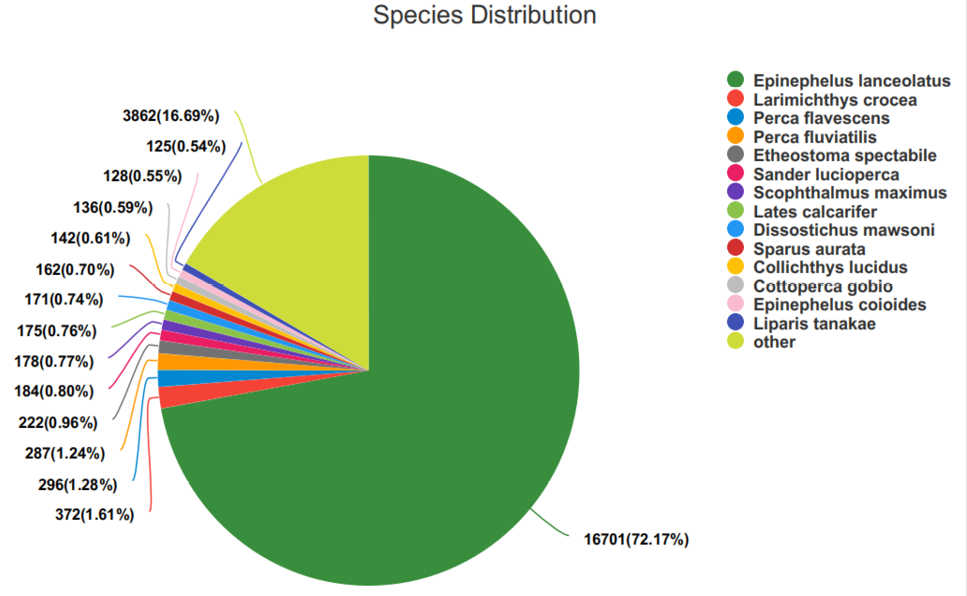
Fig. 2.
Distribution of NR annotated species of E. fuscoguttatus unigene.
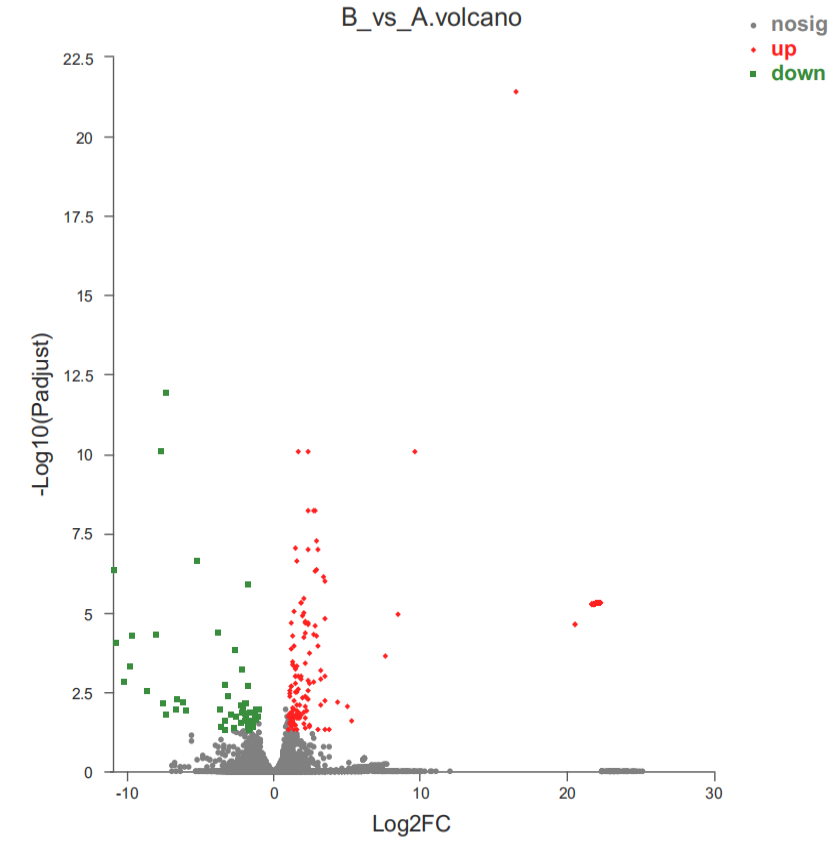
Fig. 3.
Vtricano map of differentially expressed genes in E. fuscoguttatus unigene (asymptomatic vs. diseased).
Note: the upper left side of the dotted line represents significantly down-regulated genes, and the upper right side of the dotted line represents significantly unregulated genes. A stands for asymptomatic; B stands for diseased. Same as below.
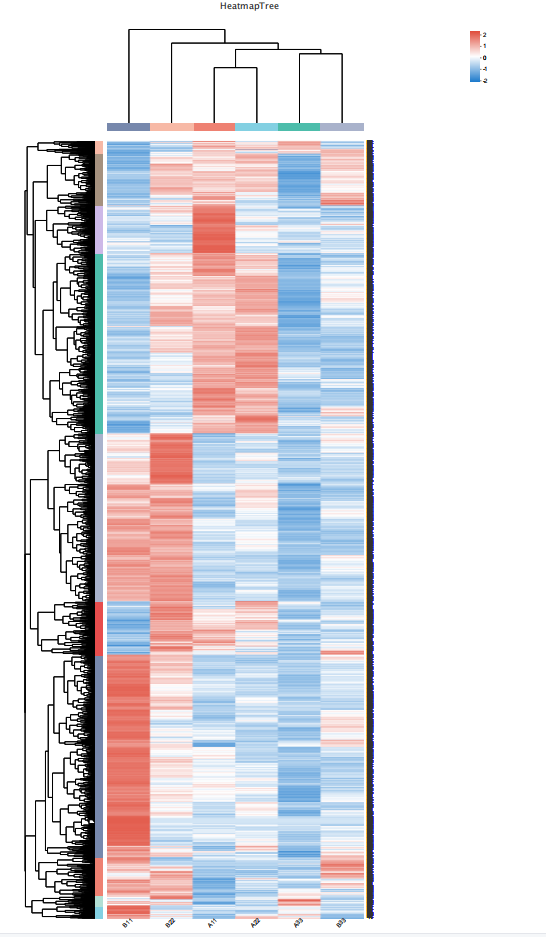
Fig. 4.
Heat map of clustering of differentially expressed genes.
Fig. 5.
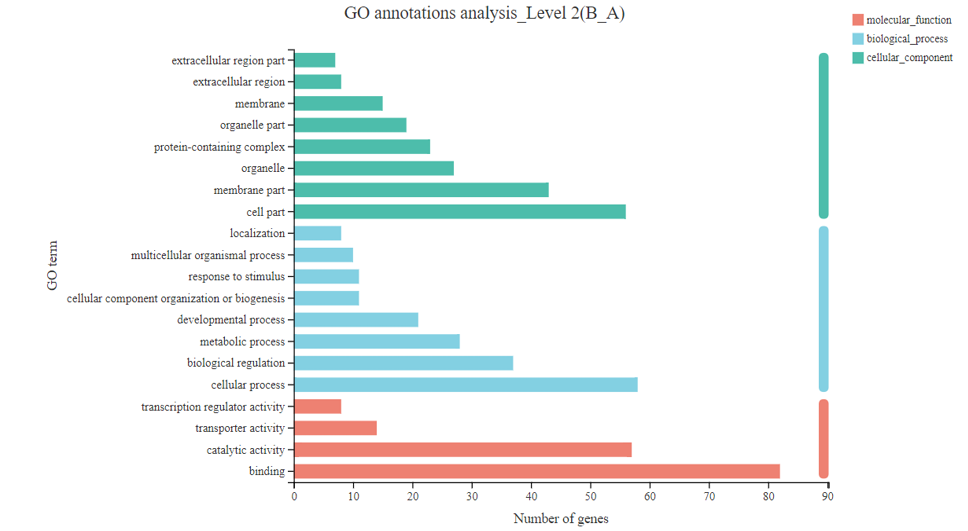
GO functional distribution of differentially expressed genes in E. fuscoguttatus unigene.
Fig. 6.
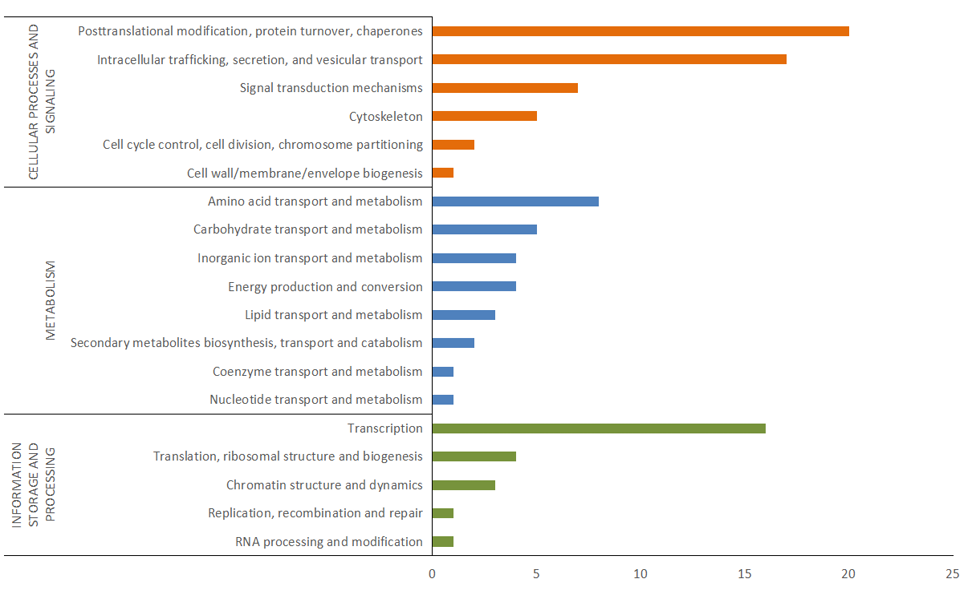
COG functional distribution of differentially expressed genes in E. fuscoguttatus unigene.
Fig. 7.
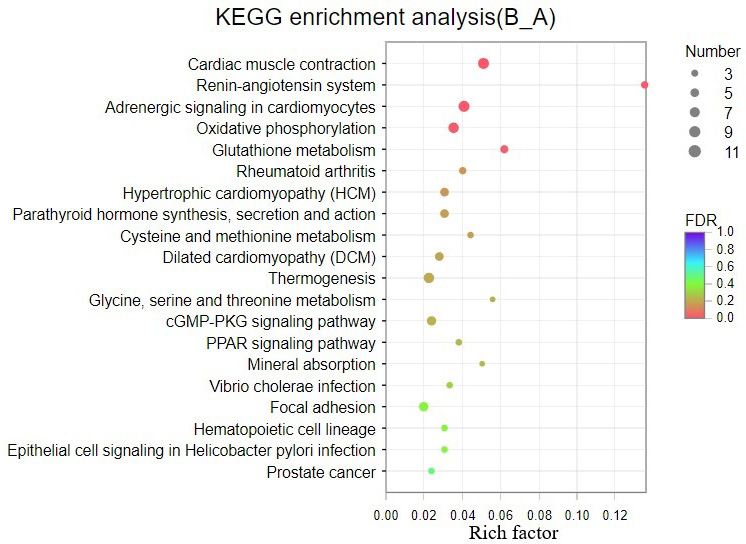
KEGG enrichment analysis of differentially expressed genes in E. fuscoguttatus unigene.
Fig. 8.
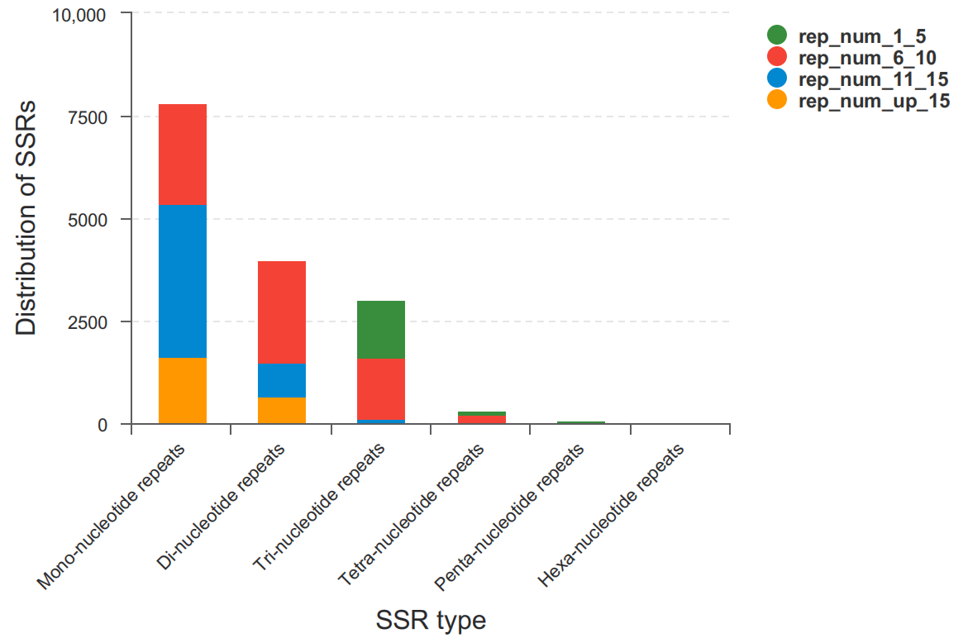
SSR size distribution of E. fuscoguttatus.
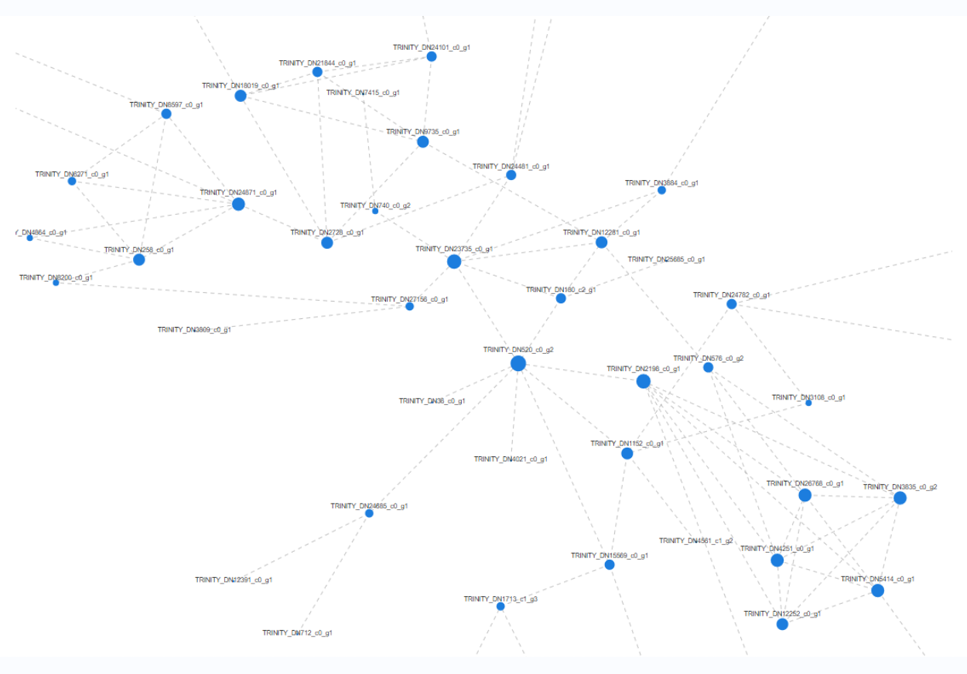
Fig. 9.
Protein-protein network interaction of differentially expressed genes.


