Precise Yield Estimation through Improvised CASA Model by Development of Soil and Atmospheric Constants (Sᵮ) and (Aþ)
Precise Yield Estimation through Improvised CASA Model by Development of Soil and Atmospheric Constants (Sᵮ) and (Aþ)
Rao Mansor Ali Khan* and Syed Amer Mahmood
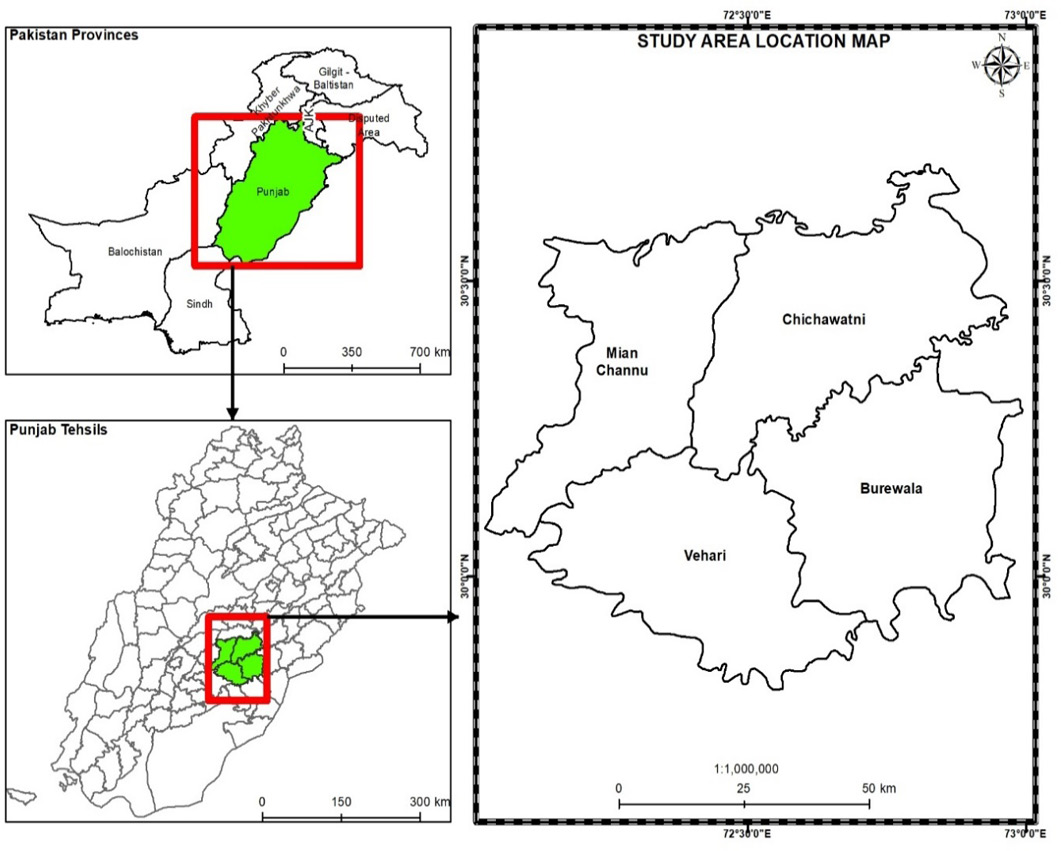
(a) Map of Punjab, Pakistan; (b) Investigation site (c) Spatial extent of the study area.
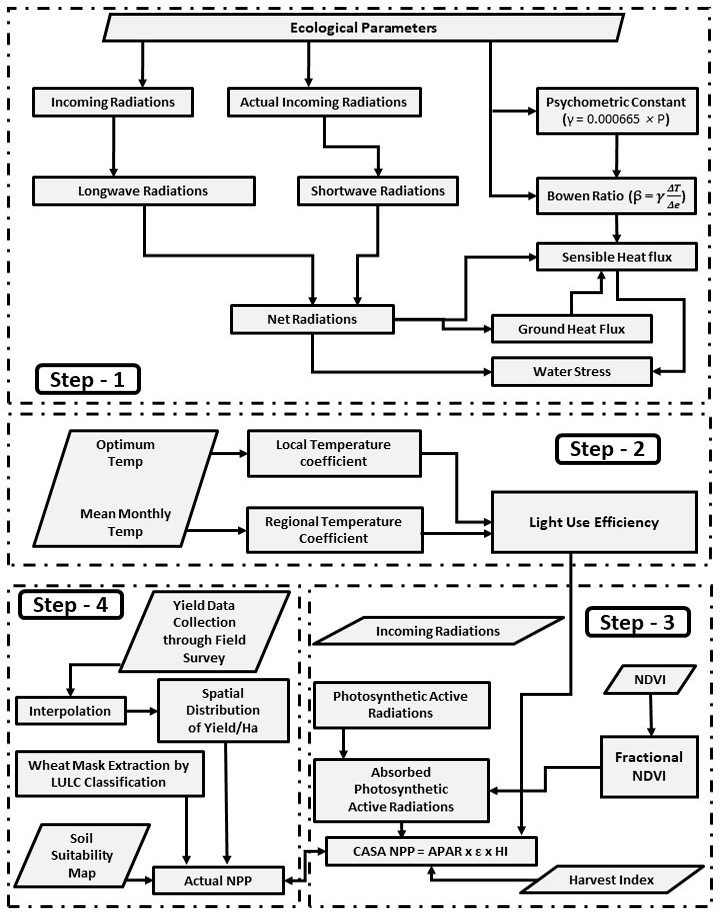
Flowchart of methodology.
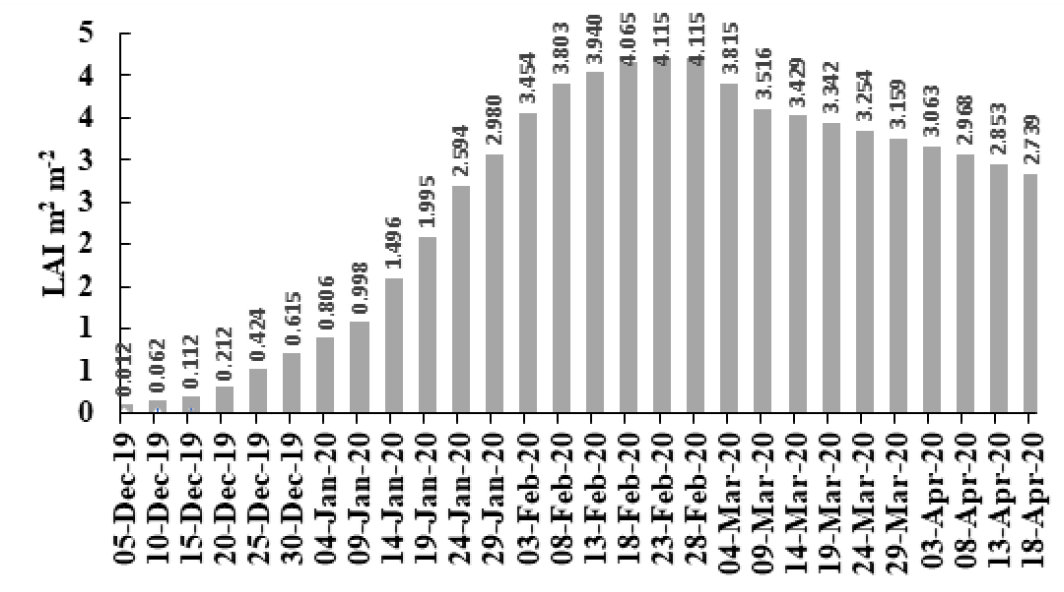
Variations recorded in LAI on various dates with a temporal resolution of five days throughout the WGP.
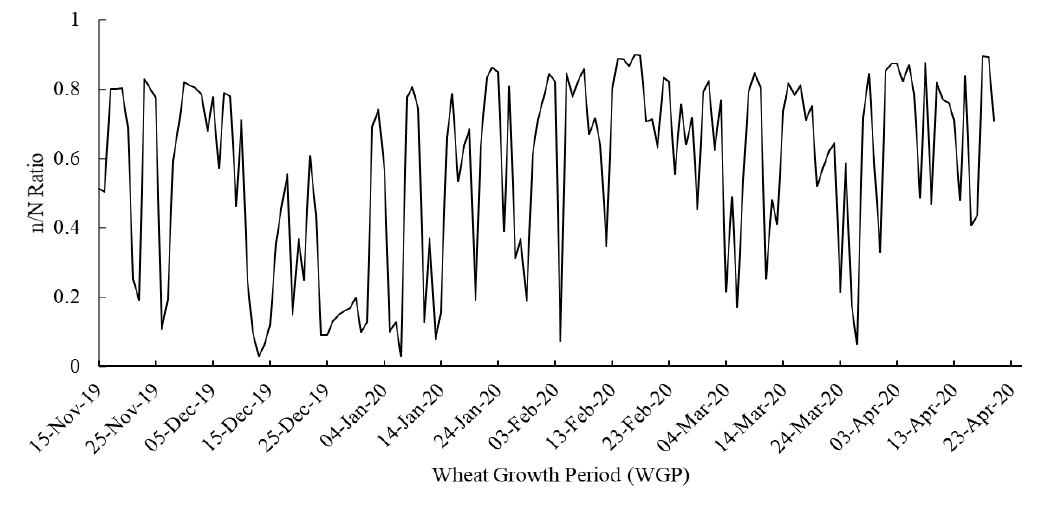
Variations in (n/N) throughout the WGP.
Variations in Go for the complete WGP.
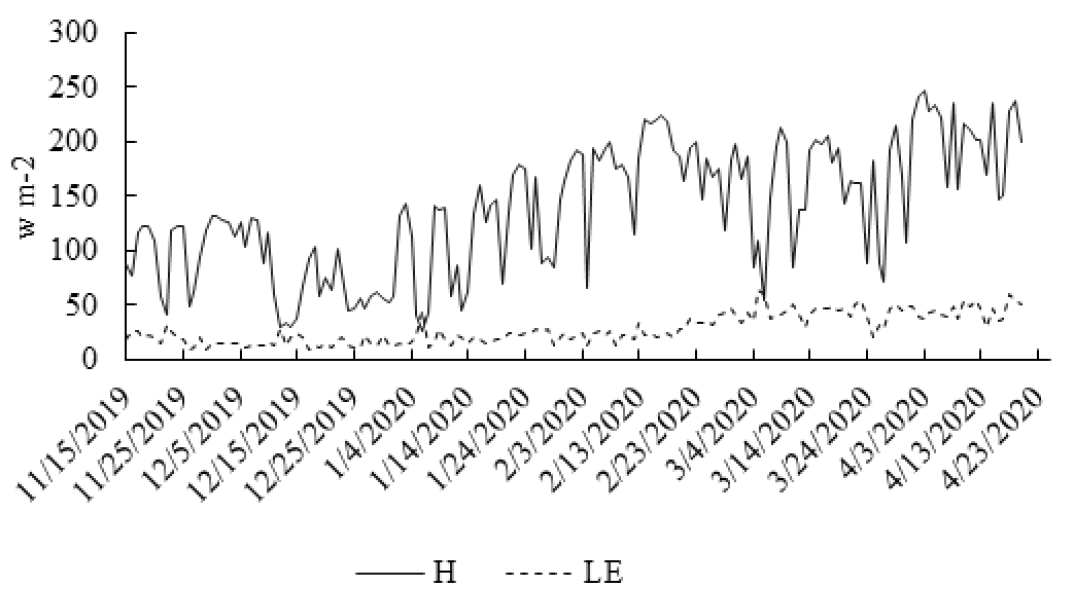
Variation in λE and H throughout WGP.
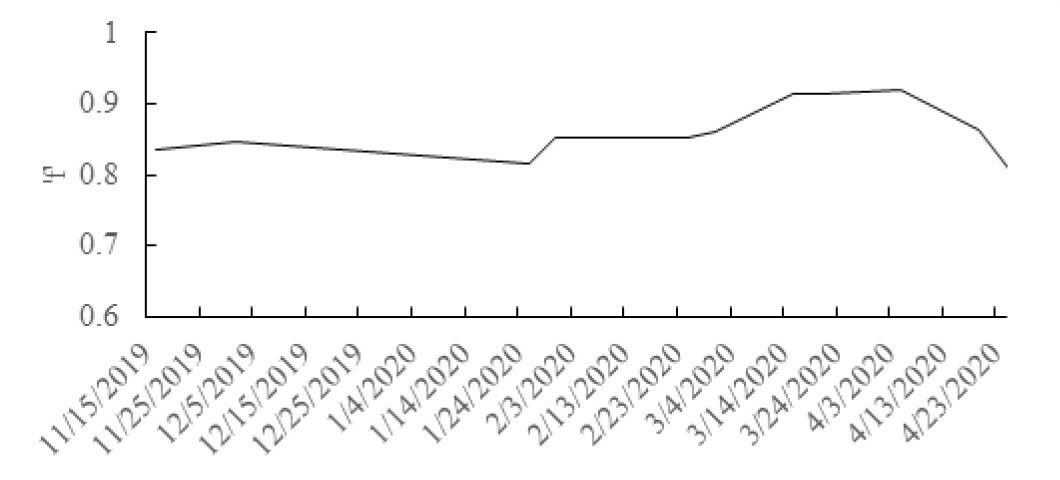
Variations in ‘f’ throughout the WGP.
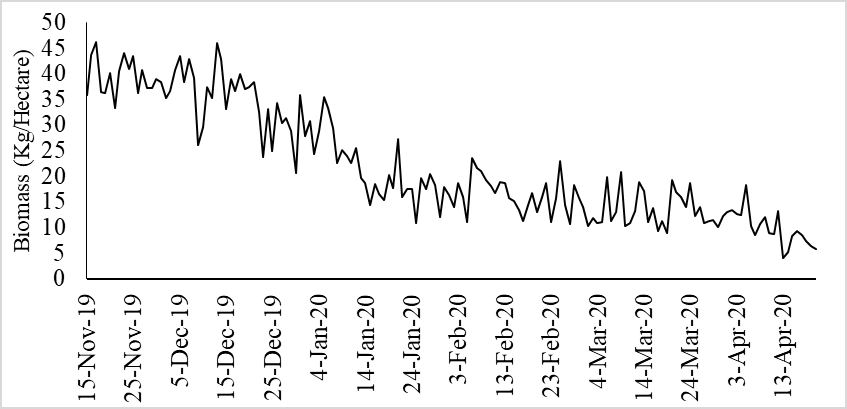
Variation in biomass throughout the WGP.
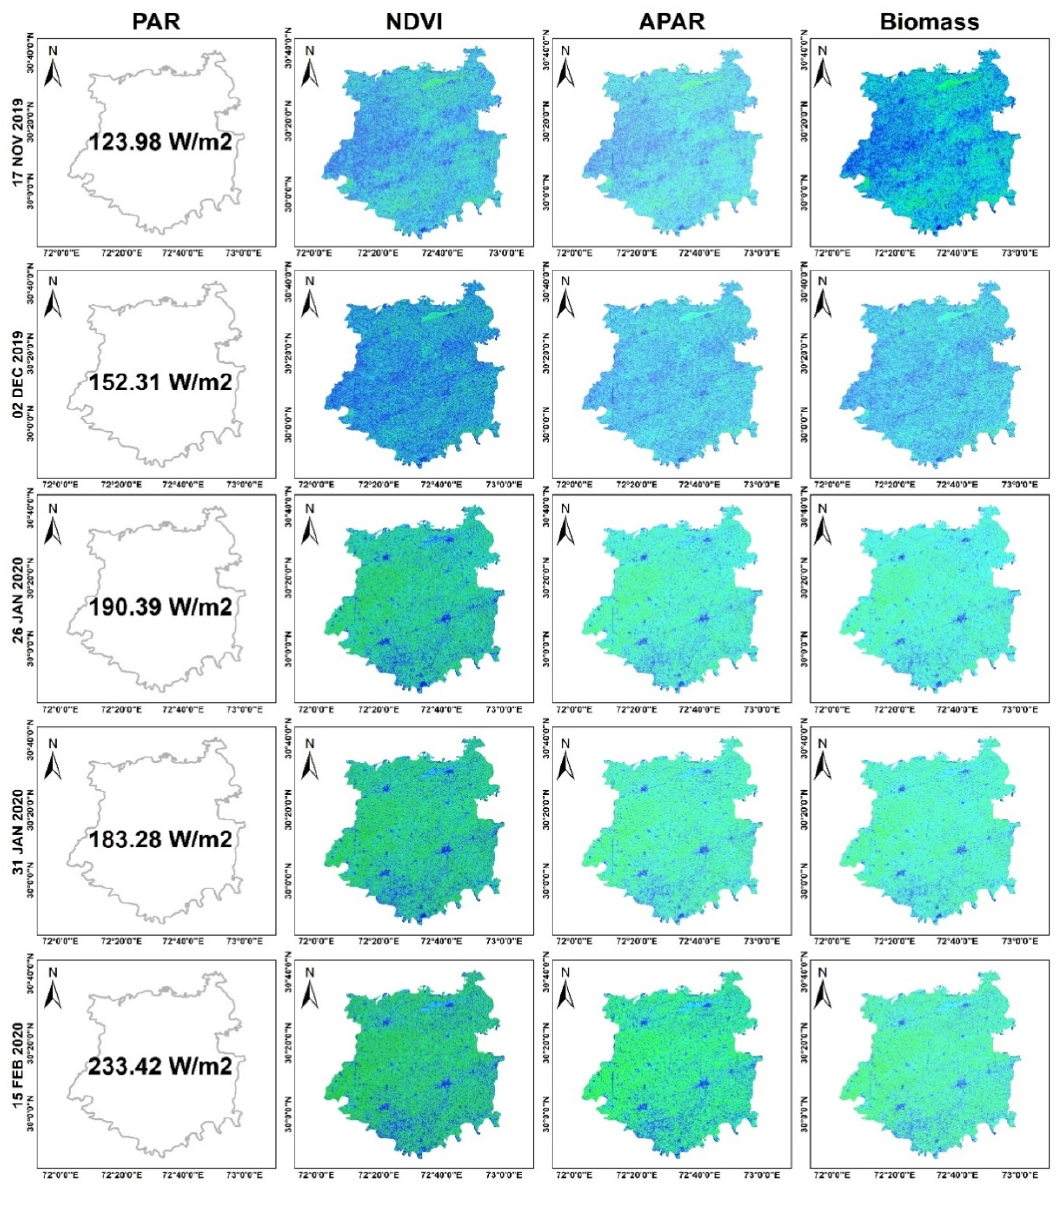
Spatio temporal variations in PAR (Wm−2), NDVI, APAR (Wm−2) and biomass generation (g/m2).
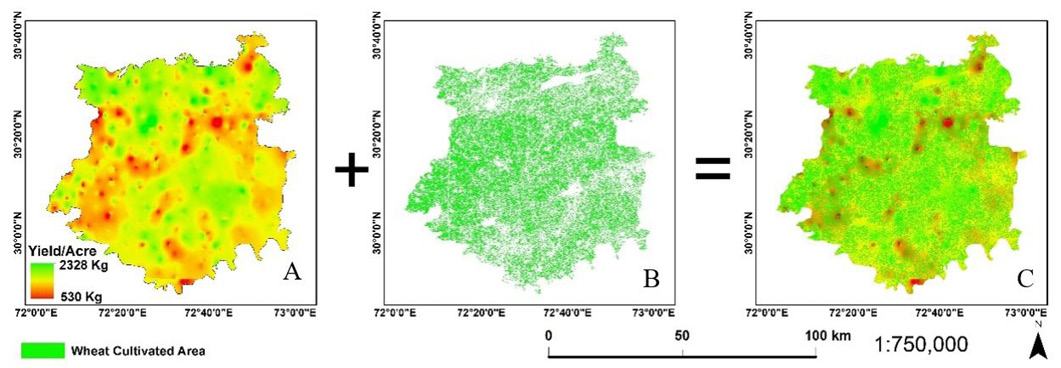
(A) Wheat yields spatial distribution; (B) Wheat cultivation mask; (C) Integration of yield distribution with wheat cultivation mask.
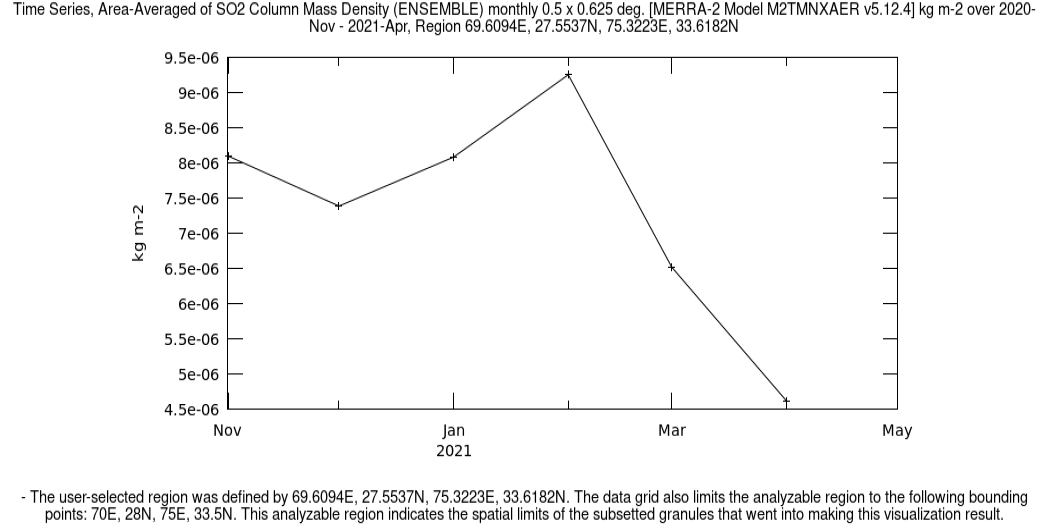
Variation in SO2 values throughout WGP.


