

Population Parameters and Exploitation Status of Clown Knifefish Notopterus chitala (Hamliton, 1822) from Indus River, Pakistan


Population Parameters and Exploitation Status of Clown Knifefish Notopterus chitala (Hamliton, 1822) from Indus River, Pakistan
Khadim Hussain Memon1,*, Amir Mahmood Memon2, Tahira Jabeen Ursani3, Abdul Manan Shaikh1 and Sapna Waheed Memon1
1Department of Zoology, Faculty of Natural Sciences, Shah Abdul Latif University, Khairpur, Sindh
2Fisheries Department, Government of Sindh, Karachi
3Department of Zoology, University of Sindh, Jamshoro
ABSTRACT
This study on the population parameters and exploitation status of Clown Knifefish N. chitala (Hamliton, 1822) was conducted from Indus River at Sukkur Barrage, Pakistan. A total of 718 specimens were collected from October 2015 to March 2016. The total length (TL) was ranged from 14-78 cm and average total length was 31±12.266 cm with CV=0.390. The total weight was ranged from 41 to 4939 g and average weight was 434±772.064 g with CV= 1.777 for the combined data. The pooled length weight relationship was estimated as a= 0.0126, b2.8968 R2= 0.984. Length frequency of combined data was used in FISAT-II software which incorporates both von Bertalanffy growth function and ELEFAN-I methods to estimate the growth parameters. The asymptotic length (L∞) and the growth rate (K) were 82.95 cm and 0.390/year, respectively, wherein the hypothetical age at zero length (t0) and goodness of fit or score (Rn) -0.495 year and 0.561 were also estimated correspondingly. The annual total mortality (Z) was 1.03/year, natural mortality (M) was 0.635/year at mean annual surface water temperature of Indus River 21°C, fishing mortality (F) was 0.395/year and exploitation rate (E) was estimated at 0.384/year. The growth performances indices phi prime (Φ’) 3.429 was computed accordingly. The present fishing mortality 0.395/year was smaller than the target biological reference points (Fopt= 0.635/year, Fmax= 1.05/year and F0.1= 0.90/year). These results revealed and confirmed that the stock of N. chitala is not being over-fished. The analysis of current exploitation rate E= 0.384/year was also indicative the sustainable fishery stock in the Indus River as it was lower than current fishing mortality.
Article Information
Received 15 June 2020
Revised 30 July 2020
Accepted 08 August 2020
Available online 21 April 2021
(early access)
Published 25 January 2022
Authors’ Contribution
KHM supervised, designed and executed the experimental work, analyzed the data and wrote the article. AMM, TJU, AMS and SWM helped the first author.
Key words
Growth, Mortality, Biological reference points, N. chitala, Indus River, Pakistan.
DOI: https://dx.doi.org/10.17582/journal.pjz/20200615120649
* Corresponding author: khadim.memon@salu.edu.pk
0030-9923/2022/0002-0889 $ 9.00/0
Copyright 2022 Zoological Society of Pakistan
Introduction
Water is definitely the most precious natural resource present on our planet. Approximately 39,900 vertebrate animals are recorded in almost all aquatic environments in the world, with half of them (21,723) being allocated to fish, 8,411 freshwater species and 11,650 species of marine water bodies (Shinde et al., 2009). According to the information provided by the Food and Agriculture Organization, the global fishery production volume of catch fishery and aquaculture fishery was 91.3 tons and 158 tons in 2012, respectively. Inland capture fishery supplies 11.6 tons of fish throughout the world, and inland fishery farming is 41.9 tons fishing worldwide. Asia has made a significant contribution to the world’s capture fisheries production, with total production of 7.2 tons (62%) in 2012. About 84% people were engaged in thefishery and aquaculture sector from Asia in 2012 (FAO, 2014).
Pakistan is the part of south Asia, located between 23°42’ and 36°55’ N and 60°45’ and 75°20’ E (FAO, 2009). It has border with China in the far northeast, Afghanistan in north and northwest, Iran in the west and India in the east. This coastline can be divided into two maritime fishing areas i.e. Sindh to the east and Baluchistan (Makran) to the west (Hornby et al., 2014). Fresh water resources of Pakistan are dominated by Indus River system which flows into the Arabian Sea through the Indus delta (Bashir, 1992). At least 180 species of fish are reported to exist in Pakistan freshwaters. A total production of 133,000 MT tons of fish was recorded from inland waters of Pakistan during 2015-2016 (GoP, 2016).
According to Agricultural Statistics of Pakistan (GoP, 2012) the total fish production of Pakistan was 725.0 metric tones (MT). Inland fisheries 235.0 MT (32%) and Marine fisheries 490.0 MT (68%) was estimated in 2012. The Sindh province awesomely generated 481.0 MT (66%) to the total production of fisheries in Pakistan. The share of inland fisheries of Sindh province was 136.0 MT (58%) of the total capture fisheries in 2012. While the estimated total fishing crafts 34,906 were registered in Pakistan during the year 2012. Out of which the inland fishing crafts 12,495 (36%) and 22, 411 (64%) of marine waters were registered in Pakistan during 2012. The share of Sindh province in fishing craft was 59% (20,519 No. of boats). The number of sail and row boats of 4570 (37%) were registered in Sindh and 15,949 (71%) were in marine waters.
The family Notopteridae is represented by 10 species in 4 genera (Eschmeyer and Fong, 2017) in freshwater bodies of the world. This teleostean group is exclusively freshwater fishes and most important constituents of Ichthyofauna of many freshwater bodies. In Pakistan this family is represented by two species in one genus, Notopterus (Mirza, 1975). This genus Notopterus is represented in Pakistani freshwater bodies by only two species N. notopterus (Pallas, 1769) and N. chitala (Hamilton, 1822) (Mirza, 1975). Both of them are oriental species and are found in Indus Plain.
This is a primary freshwater (Nelson, 1984), demersal and tropical fish having pH range from 6.0-8.0; dH range from 5-19 at 24°C-28°C (Baensch and Riehl, 1985). This group includes exclusively ray-finned fish species means they possess lepidotrichia or bony fin rays, and generally referred as modern bony fishes (Mirza, 1975; Ali and Narejo, 2009). Its English name is clown knifefish and locally called as chital or gundan (Ali, 1999). These fishes inhabit particularly larger rivers and flood plains. These are also found in stagnant backwaters. Usually, the species of this genus are found in India, Pakistan, Bangladesh, Burma, Thailand, Malaya and Indonesia while three genera are found in tropical Africa and East Asia. N. chitala spawns once a year during May to August (Ukkatawewat, 1999). It is carnivorous and predator in nature (Rahman, 1989) and maximum length reported is 120 cm in Bangladesh (Day, 1878). It also feeds on aquatic insects, mollusks, shrimp, and small fishes and takes insects and tender roots of aquatic plants during its earlier stage of life (Bhuiyan, 1964). Fish can attain maximum length up to 122 cm with maximum body weight of 14 kg (Chonder, 1999; Sarkar et al., 2006).
The study of length-weight relationship is highly significant to assess the growth of various fish species in a versatile environment (Hussain et al., 2015). Previously, length-weight relationship of various fish species has been described from Pakistani waters (Naeem et al., 2017; Memon et al., 2017; Mehak et al., 2017a, b). Therefore, it is necessary to evaluate the population dynamics parameters of N. chitala for its proper management and conservation in its natural environment i.e. Indus River. Prior to this study, no published work was available from the Indus River to estimate the population parameters of this commercially important species.
The aim of this study is to provide information on population dynamics parameters of N. chitala from natural habitat. Furthermore, the current study was carried out to assess the current stock status of this important fish in terms of asymptotic length (L∞), the growth coefficient (K), the total mortality rate (Z), the natural mortality rate (M), the fishing mortality rate (F) and the exploitation ratio (E). The current project will shed light on the biology of the stock status and growth of fish in natural bodies of water, and this work will be useful for fisheries biologists and environmental agencies and organization for the successful development, management, production, and preservation of N. chitala in the Indus River.
Materials and methods
The study was conducted from October 2015 to March 2016. Length-frequency and length-weight data were collected from commercial fishing trawlers at Sukkur Barrage (Fig. 1) immediately after return from trips and research vessels within the Pakistani waters. The total of 718 samples length-weight pooled data of N. chitala was measured. Total length from the tip of the notch to the tip of the tail of 718 specimens was measured on board immediately after the catch as well as in the landing center. The individuals were measured in total length to the nearest of 1.0 cm and the weight to the nearest 1.0 g. Length frequency data used for population dynamics analysis are given in Table I. Sampling were done monthly and all length-frequency data for each month were compiled in a excel sheet. After that the present study was carried out by using FiSAT-II computer software package (Gayanilo et al., 2005).
The length-weight relationship was described by the equation of Le Cren (1951), W= aLb and power function was performed for the estimation of the length-weight relationship for N. chitala, where W is signifying the total weight g, L is the total length cm, a is symbolic of the intercept and b is indicating the slope.
The von Bertalanffy growth function parameters of N. chitala were assessed by using the method ELEFAN-I (electronic length frequency analysis) in this study. The von Bertalanffy equation for growth in length according to Haddon (2011) is: Lt = L∞ (1–exp (-K (t– t0))), where Lt is the length at the predicted time t, L∞ is the asymptotic length, K is the growth coefficient and t0 is the hypothetical age or time where length was equal to zero. Additional estimated value of t0 was obtained by the empirical equation by Pauly (1983) as: log10 (-t0) = -0.3922 – 0.275 log10 L∞ - 1.038 log10 K.
For the estimation of instantaneous total mortality (Z) the length converted catch curve method by Pauly (1983) was used. Additional parameters of M and F (natural mortality and fishing mortality) were also calculated. The regression formula for Z is: Ln (Nt) =Ln (N0) – Zt, where Nt is the population size at age t and N0 is population size at 0 (Pauly, 1980). The equation by Pauly (1980) was used for natural mortality (M) from log10 M= 0.0066 – 0.279 log10 L∞ + 0.654 log10 K + 0.4634 log10 T. Where T= 21oC was average annual surface temperature of the Pakistani waters in which the stock of N. chitala occurs. The F (Fishing mortality) was estimated by using the relationship of subtracting F= Z-M. The exploitation ratio (E) was obtained by the relationship of Gulland (1971): E = F/Z = F/ (F+M).
According to Sparre and Venema (1992), the length structured virtual population analysis of N. chitala was carried out with the input values of length weight relationship parameters intercept (a), slope (b) and growth parameters values of asymptotic length (L∞) growth coefficient (K) and mortality parameters values of natural mortality (M) and fishing mortality (F) to estimate the fishing mortalities per length class. The t0 value was taken as zero.
According to Gulland (1969), the optimal fishing mortality rate Fopt = M was determined as the limit biological reference points for N. chitala in the Pakistani waters.
Using the model of Beverton and Holt (1957) incorporated into the FAO FiSAT-II program (Gayanilo et al., 2005) with the following formula, relative yield per recruitment (Y/R) values as a function of exploitation ratio (E) of N. chitala were estimated.
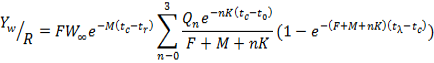
Where, Yw/R is yield per recruit, tc is the average age of first capture, tr is the age of recruitment, tλ is the asymptotically ages, Ǫn is the constant and equal to 1, -3,3 and -1 when n is 0, 1, 2 and 3 correspondingly (Pitcher and Hart, 1982).
Table I.- Monthly length frequency size distribution of Notopterus chitala was arranged at 5 cm interval from Indus River at Sukkur Barrage during the period October 2015 to March 2016.
|
Length (cm) |
October |
November |
December |
January |
February |
March |
Total |
% |
|
Fre |
Fre |
Fre |
Fre |
Fre |
Fre |
|||
|
10-14 |
2 |
10 |
12 |
1.671 |
||||
|
15-19 |
10 |
10 |
6 |
11 |
18 |
8 |
63 |
8.774 |
|
20-24 |
40 |
40 |
18 |
26 |
24 |
29 |
177 |
24.652 |
|
25-29 |
11 |
24 |
18 |
18 |
42 |
20 |
133 |
18.524 |
|
30-34 |
12 |
9 |
6 |
12 |
21 |
25 |
85 |
11.838 |
|
35-39 |
18 |
17 |
10 |
6 |
21 |
72 |
10.028 |
|
|
40-44 |
6 |
19 |
18 |
18 |
9 |
6 |
76 |
10.585 |
|
45-49 |
17 |
12 |
16 |
16 |
6 |
67 |
9.331 |
|
|
50-54 |
6 |
5 |
11 |
1.532 |
||||
|
55-59 |
3 |
3 |
0.418 |
|||||
|
60-64 |
0.000 |
|||||||
|
65-69 |
0.000 |
|||||||
|
70-74 |
6 |
6 |
0.836 |
|||||
|
75-79 |
|
|
6 |
7 |
13 |
1.811 |
||
|
Sum |
99 |
146 |
90 |
132 |
136 |
115 |
718 |
100.000 |
|
% |
13.788 |
20.334 |
12.535 |
18.384 |
18.942 |
16.017 |
100.000 |
The estimated growth parameters values of L∞ (asymptotic length) and K (growth constant) were used to compute the growth performance index (Phi prime Φ’). Following equations by Pauly and Munro (1984) Φ’= log10 K + 2 log10 L∞ and Φ= log10 K + 2/3 log10 W∞ were used.
The total annual stock size, average standing stock size, and maximum sustainable yield (MSY) of N. chitala were estimated. For this purpose, at first the exploitation rate (U) was estimated using the equation given by Beverton and Holt (1957) and Ricker (1975) as:
U = F/Z *(1-e-z)
To estimate the annual catch (Y), the landing data of N. chitala were collected from different landing sites (or total catch of fishes on that year). Then, by using the values of U, F and Y the total annual stock (P=Y/U) and average standing stock (B=Y/F) were determined. The approximate MSY was then calculated using the relationship proposed by Gulland (1979):
MSY = Zt*0.5*Bt
Where, Zt is the instantaneous total mortality in the year t and Bt is the standing stock size in that year.
Results
A total of 718 specimen (n= 718) of N. chitala were collected from Indus River at Sukkur Barrage during the period October 2015 to March 2016, weighing the total weight of 311903 kg. The total length and total weight ranged between 14 to 78 cm at average 31±12.266 cm with CV= 0.390 and 41 to 4939 g with an average 434±772.064 g with CV=1.777 accordingly. The length-weight relationship parameters a, b for N. chitala were described by the power equation as: W= 0.0126 L2.896, R2= 0.984 for pooled data, respectively. The dominant size group of fish contemplated from 19 to 25 cm and the lowest was observed from 50-74 cm (Fig. 2). Dominant weight ranged for pooled data were between 50 and 200 g (Fig. 3).
The procedure of K-scan was computed to estimate the L∞ (asymptotic length) and K (growth coefficient) through the method of ELEFAN-I. Monthly length frequency size distribution of N. chitala was arranged at 5 cm interval shown in Table I. The estimated values of L∞ and K were obtained for pooled data as L∞= 82.95 cm and K= 0.390/year simultaneously. The von Bertalanffy equation for growth in length of N. chitala in present study was designed from Lt = L∞ (1– exp (- K (t – t0))) according to Haddon (2011). The score or goodness of fit index of the ELEFAN-I routine Rn= 0.561 was constructed by the total sum of observation in this function, whereas hypothetical age at zero length t0= -0.495 year was estimated for the pooled data by the below equation described by Pauly (1983): log10 (-t0) = - 0.3922 – 0.275 log10 L∞ - 1.038 log10 K. The graphical representations of these outputs VBGF curves are shown in Figure 4.
The values of instantaneous total mortality for pooled data of N. chitala from the Sukkur Barrage on the Indus River Z= 1.03/year of CI95% 0.58-1.49 (r2= 0.698) was constructed from the input values of VBGF growth parameters (L∞ and K) in the length converted catch curve model described by Pauly (1983) (Fig. 5). Whereas, the value of natural mortalities M= 0.635/year for pooled data at the mean annual surface water temperature of Indus River 21°C was estimated by the significant equation by Pauly (1980): Log10 M = 0.0066 – 0.279 log10 L∞ + 0.654 log10 K + 0.4634 log10 T. Fishing mortality for pooled data F= 0.395/year was obtained by the subtracting Z from M, respectively, and the exploitation level E= 0.384 for pooled data was achieved from the Gulland (1971): E = 0.395/1.03 = 0.395/ (0.395+0.635) accordingly.
Input values of von Bertalanffy growth function of the growth parameters (L∞= 82.95 cm and K= 0.390/year), mortality parameters (M=0.635/year and F=0.395/year) and length weight relationship parameters (a= 0.012 and b= 2.896) were used to build the length structured virtual population analysis (LSVPA) for the N. chitala in the Indus River. Cohort analysis was used to output graphics for LSVPA was done by FiSAT-II for N. chitala in Indus River (Fig. 7). The length of the high fishing mortality was observed in 70.0 to 78.0 cm range for pooled data, while lowest fishing mortality was found between the length ranges of 56.0 to 68.0 cm.
The relative yield per recruitment of N. chitala was analyzed by the model of Beverton-Holt yield per recruit selecting the knife edge in FiSAT-II (Fig. 8). When tc was to be at 1 the Fmax was estimated at 1.05/year and F0.1 to 0.90/year for pooled data. Since the current age at the first capture was approximately 1 year and Fcurrent was 0.395/year for pooled data. The Fcurrent (0.395/year) was smaller than the biological reference point according to Gulland (1969) Fopt was equal to M = 0.635/year, showing that stock of this species is not over-fished in Indus River.
Asymptotic length (Φ’= 3.429) for pooled sexes value was derived as results of the input values of von Bertalanffy growth L∞ = 82.95 cm and K = 0.390/year, respectively. They were used for the estimation of growth performance indices (phi prime or index Φ’) for N. chitala at Sukkur Barrage on Indus River using the below equation of Pauly and Munro (1984):
Φ’ = log10 K + 2 log10 L∞ and Φ = log10 K + 2 log10 W∞
The total annual stock size, average standing stock and Maximum sustainable yield (MSY) of N. chitala from the Sukkur Barrage was estimated as 790 MT, 790 MT, and 407 MT, respectively. It was revealed from the above results that the stock of this species in Sukkur Barrage is not overfished, because the current MSY was lower than the annual standing stock.
Discussion
In fishery science, significance of length-weight relationships cannot be neglected as they are the basic indicators because they provide the knowledge about the seasonal changes in their specific environment, the physical well-being of the fish. It also determines the growth of the fish whether it is isometric or allometric because the information about the growth of the fish is considered to be an important aspect of the study of the fish population dynamics (Abdurahiman et al., 2004). These relationships have several advantages such as by using them we can estimate various other important fishery parameters e.g. gonad development, metamorphosis and fish feeding rate can be determined with their use (Le Cren, 1951). Values of a and b, as indicated earlier, are very important in fishery science. The value of letter parameters tells about the growth performance of the fish. Such as if the value of b is grater or small than three it means allometric growth pattern in fish species whereas if it equals to three it indicates isometric growth in fish species.
Table II.- Estimated population dynamics parameters of Notopterus chitala from the Sukkur Barrage.
|
Population parameters |
Notopterus chitala (Indus River) |
|
Intercept (a) |
0.012 |
|
Exponent (b) |
2.896 |
|
Coefficient of determination (R2) |
0.984 |
|
Asymptotic length (L∞) |
82.95 cm |
|
Growth coefficient (K) |
0.390/year |
|
Theoretical age (t) at zero length (t0) |
-0.495year |
|
Goodness of fit (Rn) |
0.561 |
|
Total mortality (Z) |
1.03/year at CI95%= 0.58-1.49 |
|
Mean annual water temperature of Indus River |
21oC |
|
Natural mortality (M) |
0.635/year |
|
Fishing mortality (F) F= Z – M |
0.395/year |
|
Exploitation rate (E) E= F / Z |
0.384 |
|
GPI Φ' (L∞) |
3.429 |
|
Fmax |
1.05 |
|
F0.1 |
0.90 |
|
Length range (cm) |
14-78 cm |
|
Sample number (n) |
718 |
In this study we obtained the value of b as 2.896 (Fig. 2; Table II) which indicates allometric growth pattern in this fish species. The only former described scientific work on length-weight relationship of N. chitala is from Delray Beach, Florida (IGFA, 2009). It also documents isometric growth in this fish species because the value of b estimated in this study is three. Other species of this genus i.e. Chitala exhibited isometric growth pattern such as in Chitala ornate and Chitala blanci (IGFA, 2001, 2009). Actually, the value of b varies from location to location due to several factors. Therefore, computed value of b is different from different regions. The factors which affect value of b include feeding conditions, local environment, gonad development, physical and chemical characters of the local environment etc. (Biswas, 1993; Froese, 2006).
We estimated values of L∞ and K in this research work as 82.95 cm and 0.390/year correspondingly (Table II). No previous study documents values of L∞ and K for this fish species or other species under Chitala genus. Previous studies conclude that parameters L∞ and K are inversely correlated. It means that when the value of one parameter increases the value of the other parameter decreases and vice versa (Pauly and Moragn, 1987). The value of these parameters also exhibit variation. This variation is the result of variation in the local ecological patterns, sampling techniques and variation in the life history of the fish (Adam, 1980).
Computed parameters viz. L∞ and K can be used to estimate the value of t0. These parameters indicate the growth of the juvenile. For example, if its value is negative it means fast growth rate in the juveniles as compared to the adults whereas positive value of t0 represents slower growth in juveniles than in adults (King, 2013; Sparre and Venema, 1998). Computed value of t0 in this research work is -0.495 per year which means juveniles grow faster than adults. Generally, R2 is used in statistical analysis to determine the goodness of fit and its values ranges between zeros to one. In ELEFAN method goodness of fit is indicated by Rn value. In this study we computed Rn value as 0.561 (Table II). Generally, it is assumed that the value of Rn indicates fitting of the data. Moreover, another feature of FiSAT-II is that it has the ability to estimate the parameters Z by using confidence intervals. But it must be taken into consideration that FiSAT-II does not use confidence intervals for the estimation of the parameters related to the growth of the fish.
It is assumed that the data used in this study i.e. length frequency data encompass all the age classes found in the fish species which is the basic requirement of the ELEFAN method. Thus, we suppose that our data satisfy this requirement. ELEFAN is a scientific method usually referred to as adhoc method or sometimes also called as non-parametric method. This specialty of these methods is that these methods does not use cohort distribution shapes during the estimation of various important parameters. By using this method we estimated growth rates through VBGF. In addition to ELEFAN method we also used Bertalanffy model of growth. Thus, both of these tools are perfect to study growth (Pitcher, 2002). The obvious variation in the asymptotic length depends upon many factors such as physical and chemical characters of the local environment and sampling methods (Biswas, 1993).
The computed mortality parameters in present study were compared with the mortality results for N. notopterus of Mustafa et al. (2014) from Bangladesh. The obtained results in present study of Z= 1.03/year, M= 0.635/year, F= 0.395/year (Table II) for N. chitala were similar to the mortality results of total mortality (Z) =1.19/year, natural mortality (M) =0.91/year and fishing mortality (F) =0.28/year for N. notopterus from Bangladesh. Meantime the results of exploitation ratio (E= 0.384/year) were also similar to the results of exploitation ratio (0.24/year) for N. notopterus from Bangladesh. The results of mortality rates and exploitation ratio indicated the sustainability of the species in the region.
However published literature does not document these parameter estimates for this species of N. chitala. It has been found that the value of the mortality is different from different locations. The probable reasons for these deviations include a rising trend in capture fisheries and changes in the ecology. Beverton and Holt (1957) method is used for the estimation of growths (Issac, 1990; Sparre, 1990; Pauly et al., 1995). This method needs the selections of three reading at minimum. By using this method we have assumed that a negligible portion of the fish population was vulnerable to the gears used during fishing. Furthermore, it is assumed that in the data set we used in this study there is a small portion of the adult fish stock.
Numerous factors affect mortality in the fish such as pollution, disease, predation, capture and old fish’s death (Nikolsky, 1969). Among all of these listed factors, usually, the predation is the number one factor responsible for fishing mortality (Brandt et al., 1987; Laevastu and Favorite, 1988). It is found that the deaths in the fishery stock due to predation are much more as compared to their natural deaths which cannot be witnessed (Quinn and Deriso, 1999). In general, fishing mortality relates with capture fishery. Higher is the capture obviously higher is the fishing mortality and likewise.
The exploitation of the fishery stock is indicated by the exploitation rate. If its value is larger than 0.5 it is supposed that the fishery stock is over harvested (Gulland, 1971). On the other hand, if the value of this parameter is smaller than 0.5 then the fishery stock is supposed to be in a safe condition. In present study the obtained results of exploitation ratio were (0.384/year) which were smaller than the standard values of 0.5/year, which indicates that the fishery of the studied species was at a sustainable level. However, there is a conflict of scientists regarding the reference point of 0.5. Some scientists say 0.4 is the reference point for over-exploitation state (Patterson, 1992). Therefore, generally, exploitation value is compared to biological reference point before considering the final stock status.
In fisheries science various reference points are used to describe the state of the fishery. Scientists use these reference points to draft policies regarding fisheries management. Among these reference points, F0.1 and Fmax are the two reference points used. The former reference point denotes 10% rise in yield per recruit whereas the latter one indicates mortality of the fish at the maximum yield per recruit (Deriso, 1987; Hilborn and Walters, 1992; Caddy, 1998). Meantime precocity and miniaturization in marine commercial fishes has aroused increasing levels of concern, and can be used as an indicator of overfishing (Zhang et al., 2020).
Yield per recruit analysis estimates for various parameters as Fmax= 1.05/year and F0.1= 0.90/year (Table II). The lower value of F0.1 than Fmax is an indicator that shows that the fishery stock is in safe condition. According to Gulland (1971), M is equal to Fopt and Fopt= 0.68. As value of fishing mortality is smaller when compared to BRP of Gulland which also speaks that the fishery is in safe condition.
Table III.- Monthly data used in the length converted catch curve analysis for Notopterus chitala to estimate mortality rates from Sukkur Barrage during 2015-16.
|
Sampling month |
Z |
M |
F |
E |
r2 |
|
October |
1.620 |
0.635 |
0.985 |
0.608 |
0.675 |
|
November |
3.530 |
0.635 |
2.895 |
0.82 |
0.982 |
|
December |
1.060 |
0.635 |
0.425 |
0.401 |
0.798 |
|
January |
1.100 |
0.635 |
0.465 |
0.423 |
0.883 |
|
February |
4.110 |
0.635 |
3.475 |
0.846 |
0.985 |
|
March |
1.600 |
0.635 |
0.965 |
0.603 |
0.867 |
Length structured virtual population analysis method used in this study suppose stable rate of fishing mortality and recruitment (Gulland and Rosenberg, 1992). This method is very significant and reliable on which management advice can be given (Hoggarth et al., 2006). We used LSVPA method to know about the catch composition of the fishery stock. Moreover, relationship between spawning fish biomass and recruitment pattern is also explored (Hoggarth et al., 2006; Wakeford et al., 2004). In this study we have found that when cohort length increases the mortality of the fish also increases. Another important point to consider is that despite of diminished losses due to natural losses the fishing mortality is raising. It means aging is operating this phenomenon. But the focus should be put on the harvest of this creature which must not be increased rather remain at current level.
Conclusion
The present study concludes that the fishery of the studied species were at a sustainable level because the obtained results of fishing mortality (0.395/year) were smaller than the obtained values (0.635/year) of target biological reference points, meantime the obtained results of exploitation ratio (0.384/year) were also smaller than the standard values (0.5/year) of exploitation ratio.
Acknowledgement
The first author is thankful to Higher Education of Pakistan (HEC), Islamabad, for funding this project. This work is supported by the special research fund of Higher Education of Pakistan, Islamabad (Project No. 597).
Statement of conflict of interest
The authors have declared no conflict of interests.
References
Abdurahiman, K.P., Nayak, T.H., Zacharia, P.U. and Mohamed, K.S., 2004. Length-weight relationship of commercially important marine fishes and shellfishes of the Southern Coast of Karnataka, India. NAGA WorldFish Center Quart., 27: 9-14.
Adam, P.B., 1980. Life history pattern in marine fishes and their consequences for fisheries management. Fish. Bull., 78: 1-12.
Ali, S.S. and Narejo, N.T., 2009. Fundamentals of ichthyology. Naseem Book Depot, Hyderabad, Sindh, Pakistan, pp. 1-168.
Ali, S.S., 1999. Freshwater fishery biology. Naseem Book Depot, Hyderabad, Sindh, Pakistan, pp. 1-330.
Baensch, H.A. and Riehl, R., 1985. Aquarien atlas. Band 2. Mergus. Verlag für Natur-und Heimtierkunde GmbH, Melle, Germany, pp. 1216
Beverton, R.J.H. and Holt, S.J., 1957. On the dynamics of exploited fish populations. Fishery investigation series II. Ministry of Agriculture, Fisheries and Food, London, pp. 553.
Bhuiyan, A.I., 1964. Fishes of Dacca. Asiat. Soc. Pakistan, Pub. 1, No. 13, Dacca, pp. 15-16.
Biswas, S.P., 1993. Manual of methods in fish biology. South Asia Publishers, New Delhi, India.
Brandt, S.B., Mason, D.M., Macneill, D.B., Coates, T. and Gannon, J.E., 1987. Predation by alewives on larvae of yellow perch in Lake Ontario. Trans. Am. Fish. Soc., 116: 641-645. https://doi.org/10.1577/1548-8659(1987)116<641:PBAOLO>2.0.CO;2
Caddy, J., 1998. A short review of precautionary reference points and some proposals for their use in data-poor situations. FAO Fisheries Technical Paper, FAO, Rome, Italy, pp. 379.
Chonder, S.L., 1999. Biology of finfish and shell fish. SCSC Publishers, India.
Day, F., 1878. The fishes of India, being a natural history of the fishes known to inhabit the seas and freshwater of India, Burma and Ceylon. Biodiversity Heritage Library, pp. 730-745. https://doi.org/10.5962/bhl.title.62705
Deriso, R.B., 1987. Optimal F 0.1 criteria and their relationship to maximum sustainable yield. Canadian J. Fish. aquat. Sci., 44: 339-348. https://doi.org/10.1139/f87-335
Eschmeyer, W.N. and Fong, J.D., 2017. Species by family/subfamily in the catalog of fishes. Institute for Biodiversity of Science and Sustainability, California Academy of Sciences.
FID-/CP/PAK/FAO, 2009. Fishery and aquaculture country profile. FAO’s Fishery Department, Rome, Italy, pp. 1-18.
FAO, 2014. The state of World fisheries and aquaculture, opportunities and challenges. Food and Agricultural Organization of United Nations, Rome, Italy, pp. 1-243.
Froese, R., 2006. Cube law, condition factor and weight-length relationships history, meta-analysis and recommendations. J. appl. Ichthyol., 22: 241-253.
Gayanilo, F.C., Sparre, P. and Pauly, D., 2005. The FAOICLARM stock assessment tool (FiSAT) user’s guide. Worldfish Center No. 7, FAO Computerized Information Series (Fisheries), FAO, Rome, pp. 168.
GoP, 2012. Agricultural statistics of Pakistan 2011-12. Ministry of National Food Security and Research (Economic Wing), Islamabad, Government of Pakistan, pp. 1-315. http://www.irispunjab.gov.pk/StatisticalReportSTICS%20OF%202011-12.pdf
GoP, 2016. Economic survey of Pakistan 2015-2016. Ministry of Finance, Islamabad, Pakistan, pp. 44. Available at: http://www.finance.gov.pk/survey_1516.html (accessed on 03 Sep, 2020)
Gulland, J.A., 1969. Manual of methods for fish stock assessment, Part 1. Fish population analysis. FAO Man. Fish. Sci., 4: 154.
Gulland, J.A., 1971. Fish resources of the ocean. FAO Fisheries Technical Paper No. 97. West Byfleet, Survey, Fishing News Books Ltd., pp. 425.
Gulland, J.A., 1979. Report of the FAO/UNDP workshop on the fishery resources of the Western Indian Ocean south of the Equator. DEV. REP. Indian Ocean Programme. pp. 102.
Gulland, J.A. and Rosenberg, A.A., 1992. A review of the length based approaches to assessing fish stocks. FAO Fisheries Technical Paper No. 323. FAO, Rome, Italy, pp. 100.
Haddon, M., 2011. Modelling and quantitative methods in fisheries. Chapman and Hall / CRC Press, London, pp. 449.
Hamilton, F., 1822. An account of the fishes found in the river Ganges and its branches. A. Constable and Company Edinburg/Hurst, Robinson and Company, London, pp. 1-39.
Hilborn, R. and Walters, C.J., 1992. Quantitative fisheries stock assessment: Choice, dynamics and uncertainty. Rev. Fish Biol. Fish., 2: 177-178.
Hoggarth, D.D., Abeyasekera, S., Arthur, R.I., Beddington, J.R., Burn, R.W., Halls, A.S., Kirkwood, G.P., McAllister, M., Medley, P., Mees, C.C., Parkes, G.B., Pilling, G.M., Wakeford, R.C. and Welcomme, R.L., 2006. Stock assessment for fishery management-a framework guide to the stock assessment tools of the fisheries management science programme. FAO Fisheries Technical Paper 487, FAO, Rome, Italy, pp. 261.
Hornby, C., Muhammad M.K., Kyrstn, Z. and Dirk, Z., 2014. Reconstruction of Pakistan’s marine fisheries catches 1950-2010. Working Paper 6T (1Z4), Fisheries Centre, University of British Columbia, Vancouver, Canada.
Hussain, H.A., Shakir, S.A. and Qazi, J.I., 2015. Growth coefficient and fecundity of Chitala chitala (Osteoglossiformes: Notopteridae) from the River Ravi, Pakistan. J. Anim. Pl. Sci., 25: 401-405.
IGFA, 2001. Database of IGFA angling records until 2001. IGFA, Fort Lauderdale, USA.
IGFA, 2009. Database of IGFA angling records until 2009. IGFA, Fort Lauderdale, USA.
Issac, V.J., 1990. The accuracy of some length-based methods for fish population studies. ICLARM Tech. Rep., 27: 81.
King, M., 2013. Fisheries biology, assessment and management. John Wiley and Sons, London, UK.
Laevastu, T. and Favorite, F., 1988. Fishing and stock fluctuations. Fishing News Books, London, UK.
Le-Cren, E.D., 1951. The length-weight relationship and seasonal cycle in gonad weight and condition in the Perch (Perca fluviatilis). J. Anim. Ecol., 20: 201-219.
Mehak, A., Mu,Y., Mohsin, M., and Noman, M. and Nazir, K., 2017a. Population dynamics of Nile tilapia (Orechromis niloticus) at Chashma Barrage, Pakistan. Indian J. Geo-Mar. Sci., 46: 206-210.
Mehak, A., Mu, Y., Mohsin, M. and Noman, M., 2017b. Length-weight relationship of three fish species collected from Chashma Barrage on the Indus River, Pakistan. Indian J. Geo-Mar. Sci., 46: 211-212.
Memon, A.M., Liu, Q., Baloch, W.A., Soomro, A.N., Mohsin, M., Noman, M. and Karim, E., 2017. Population parameters of siluroid catfish (Eutropiichthys vacha) from Indus river, Pakistan. Int. J. Agric. Biol., 19: 751-760.
Mirza, M.R., 1975. Freshwater fishes and zoogeography of Pakistan. Bijdr. Dierk., 45: 143-180.
Mustafa, G.M., Singha, S., Islam, M.R. and Mallick, N., 2014. Population dynamics of Notopterus notopterus (Pallas, 1769) from the Kaptai reservoir of Bangladesh. SAARC J. Agric., 12: 112-122.
Naeem, M., Abidi, S.Z.A., Khan, M., Ishtiaq, A. and Naeem, Z., 2017. Length–weight, length-length and condition factor relationships of Labeo gonius (Hamilton) from Taunsa Barrage, River Indus, Pakistan. Int. J. Fish. aquat. Stud., 5: 15-19.
Nelson, J.S., 1984. Fishes of the world, 2nd edition. John Wiley and Sons, Inc., New York, pp. 523.
Nikolsky, G.V., 1969. Theory of fish population dynamics as the background for rational exploitation and management of fishery resources. Oliver and Boyd, Edinburgh, UK.
Pallas, P.S., 1769. Spicilegia Zoologica quibus novae imprimis et obscurae animalium species iconibus, descriptionibus atque commentariis illustrantur. Berolini, Gottl. August, Lange, 1: 1-42.
Patterson, K., 1992. Fisheries for small pelagic species: An empirical approach to management targets. Rev. Fish Biol. Fish., 2: 321-338.
Pauly, D., 1980. On the interrelationships between natural mortality, growth parameters and mean environment temperature in 175 fish stocks. J. Cons. Int. Explor. Mer., 39: 175-192.
Pauly, D., 1983. Some simple methods for the assessment of tropical fish stocks. Fisheries Technical Paper No. 234, FAO, Rome, Italy, pp. 52.
Pauly, D. and Munro J.I., 1984. Once more on the comparison of growth in fish and invertebrates. FishByte, 2: 21-23.
Pauly, D. and Morgan, G.R., 1987. Length-based methods in fisheries research. WorldFish, Manila, Philippines.
Pauly, D., Moreau, J. and Abad, N., 1995. Comparison of age-structured and length-converted catch curves of brown trout Salmo trutta in 2 French rivers. Fish. Res., 22: 197-204.
Pitcher, T.J. and Hart, P.J., 1982. Fisheries ecology. Chapman and Hall, London, pp. 414.
Pitcher, T.J., 2002. A bumpy old road: size-base methods in fisheries assessment. In: Handbook of fish biology and fisheries (eds. P.J.B. Hart and J.D. Reynold), Vol. 2. Blackwell Publishing, Oxford, UK, pp. 189-210.
Quinn, T.I.I. and Deriso, R.B., 1999. Quantitative fish dynamics. Oxford University Press, New York, pp. 542.
Rahman, A.K.A., 1989. Freshwater fishes of Bangladesh. Zoological Society of Bangladesh, pp. 364.
Ricker, W.E., 1975. Computation and interpretation of biological statistics of fish populations. Bull. Fish. Res. Bd. Canada, 191: 379-382.
Sarkar, U.K., Deepak, P.K., Negi, R.S., Singh, S.P. and Kapoor, D., 2006. Captive breeding of endangered fish Chitala chitala (Hamilton-Buchanan) for species conservation and sustainable utilization. Biodiv. Conserv. 15: 3579-3589.
Shinde, S.E., Pathan, T.S., Bhandare, R.Y. and Sonawane, D.L., 2009. Ichthyofaunal diversity of Harsool Savangi Dam, District Aurangabad (MS) India. World J. Fish mar. Sci., 1: 141-143.
Sparre, P., 1990. Can we use traditional length-based fish stock assessment when growth seasonal? Fishbyte, 8: 29-32.
Sparre, P. and Venema, S.C., 1992. Introduction to tropical fish stock assessment, Part 1-Manual. FAO Fisheries Technical Paper 306/1, FAO, Rome, Italy, pp. 376.
Sparre, P. and Venema, S.C., 1998. Introduction to tropical fish stock assessment, Part 1. Fisheries Technical Paper No. 306, FAO, Rome, Italy..
Syed, M.N., Ali, T.S., Abid, A.B., Sarah, J., Mahparah, R., Zaman, S. Salman, H. and Zaidi, M., 1999. First national report of Pakistan to the convention on biological diversity. Monitor. Environ., 122:13.
Ukkatawewat, S., 1999. The taxonomic characters and biology of some important freshwater fishes in Thailand. National Inland Fisheries Institute, Department of Fisheries, Ministry of Agriculture, Bangkok, Thailand, pp. 55.
Wakeford, R.C., Pilling, G.M., O’Neill, C.J. and Hine, A., 2004. Investigations of the implications of different reef fish life history strategies on fisheries management. Final Technical Report, FMSP Project R7835. MRAG, London, pp. 123.
Zhang, K., Cai, Y., Liao, B., Jiang, Y., Sun, M., Su, Li. and Chen, Z., 2020. Population dynamics of threadfin porgy Evynnis cardinalis, an endangered species on IUCN red list in the Beibu Gulf, South China Sea. J. Fish Biol., 97: 479-489.
To share on other social networks, click on any share button. What are these?


