Population Dynamics and Stock Appraisal of Talang Queenfish (Scomberoides commersonnianus) from Balochistan Coast, Pakistan
Population Dynamics and Stock Appraisal of Talang Queenfish (Scomberoides commersonnianus) from Balochistan Coast, Pakistan
Zahid Ali1,2, Muhsan Ali Kalhoro1*, Nazeer Ahmed1,3, Muhammad Shafi1, Faisal Saeed1 and Abdul Majeed1
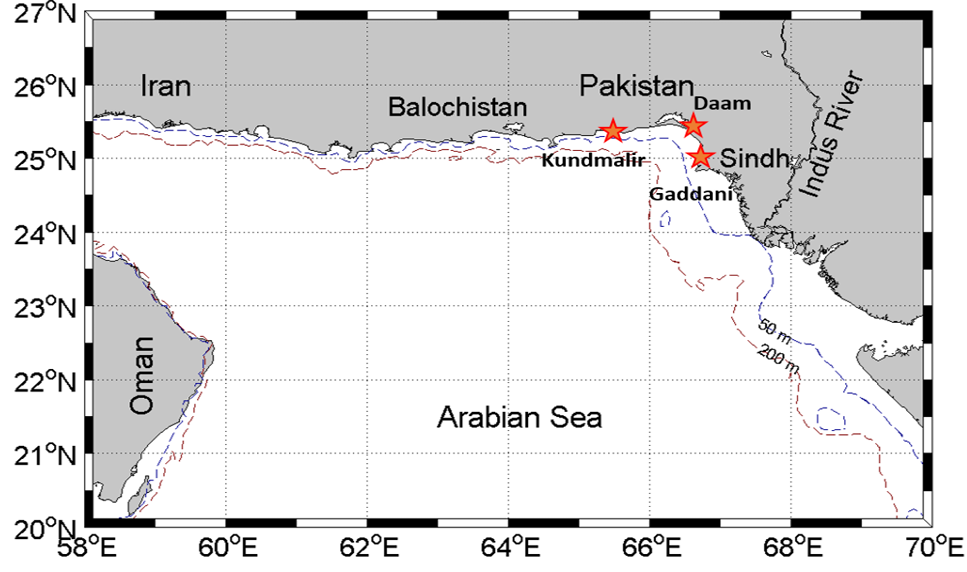
Pakistan coastline showing Sindh and Balochistan coast, (*) stars indicating sampling sites with exclusive economic zone.
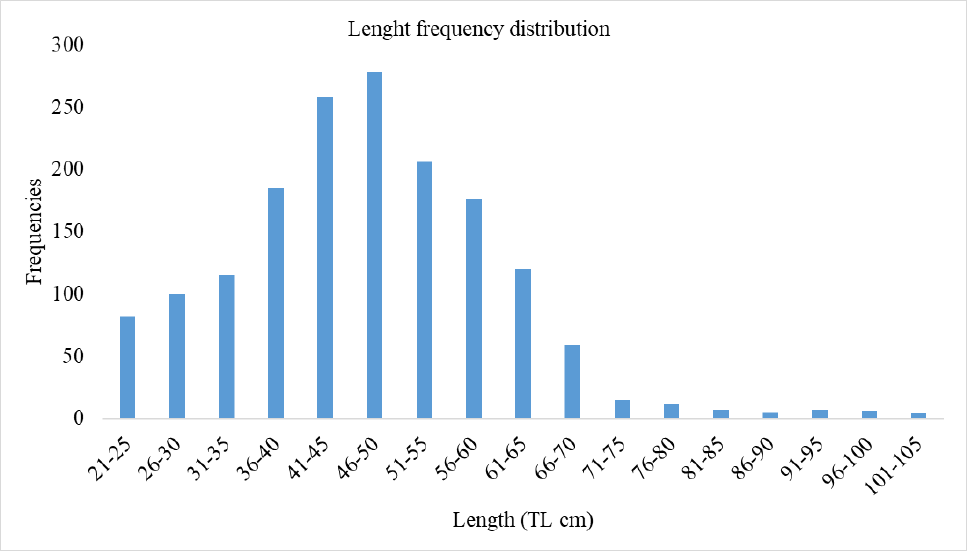
Length frequency distribution with 5 cm (TL) length interval of Talang queenfish from Balochistan, Pakistan during 2022.
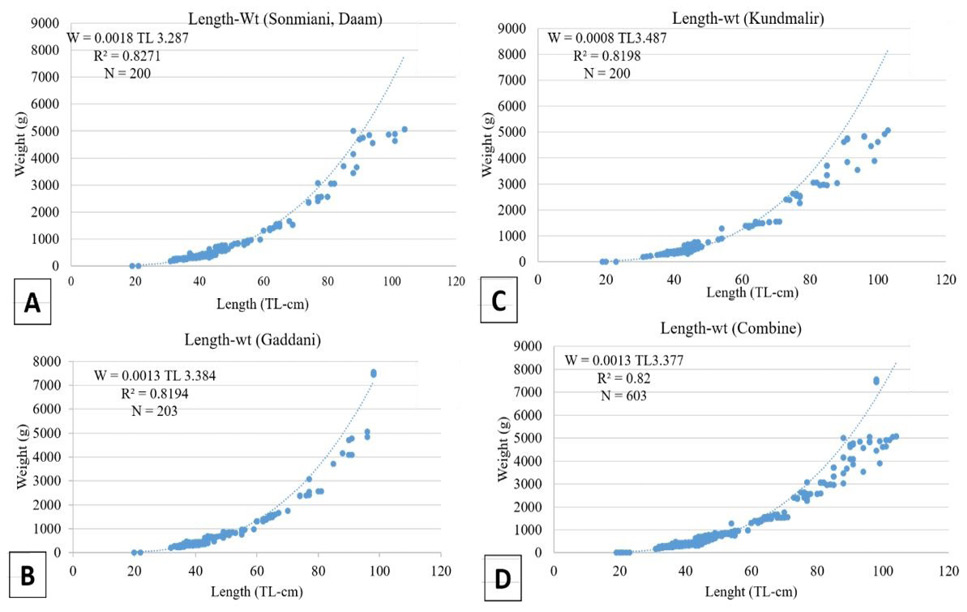
a, b, c, d. Length-weight relationship from Sonmiani Daam (A); W = 0.0018 TL3.287 (R2 = 0.827) (B); Gaddani was W = 0.0013 TL3.384 (R2=0.819), (C) Kundmalir, W = 0.0008 TL3.487 (R2=0.819), (D); Combine, W = 0.0013 TL3.377 (R2=0.82) from Balochistan during 2022.
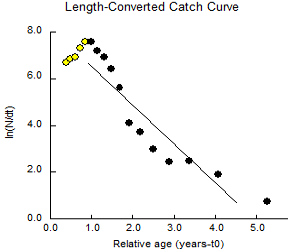
Length converted catch method used to estimate total mortality (Z=1.65yr-1 with confidential interval =1.18 to 2.13), the black dots were selected to calculate mortality though, yellow dots indicating small size fishes and those were excluded from estimation from Balochistan coast, Pakistan during 2022.
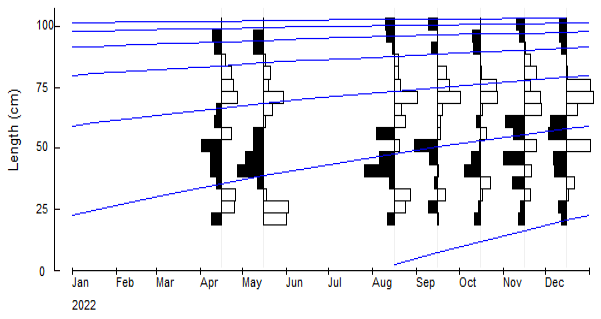
Growth parameters using electronic length frequency analysis (L∞=106.05 yr-1, K = 0.58 yr-1), the black and white bars showing positive and negative deviation of length ranges (length measured and length predicted by software) and curves signify the fish length over time from Balochistan coast, Pakistan during 2022.


