Population Analysis Based on Mito-nuclear Sequences: Implication of Dugesia japonica Decline in Taihang Mountains, China
Population Analysis Based on Mito-nuclear Sequences: Implication of Dugesia japonica Decline in Taihang Mountains, China
He-Cai Zhang, Tian-Ge Hu, Chang-Ying Shi, Guang-Wen Chen* and De-Zeng Liu
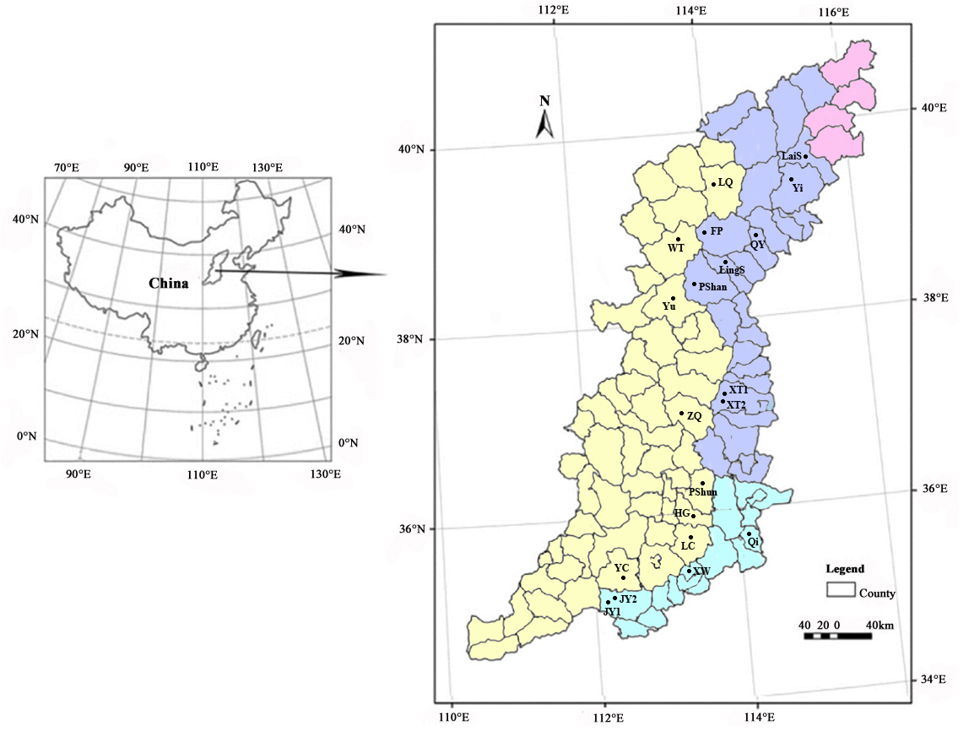
Distribution map of D. japonica populations studied in Taihang Mountains. The red, blue, yellow and green areas represent Beijing Municipality, Hebei, Shanxi and Henan provinces, respectively.
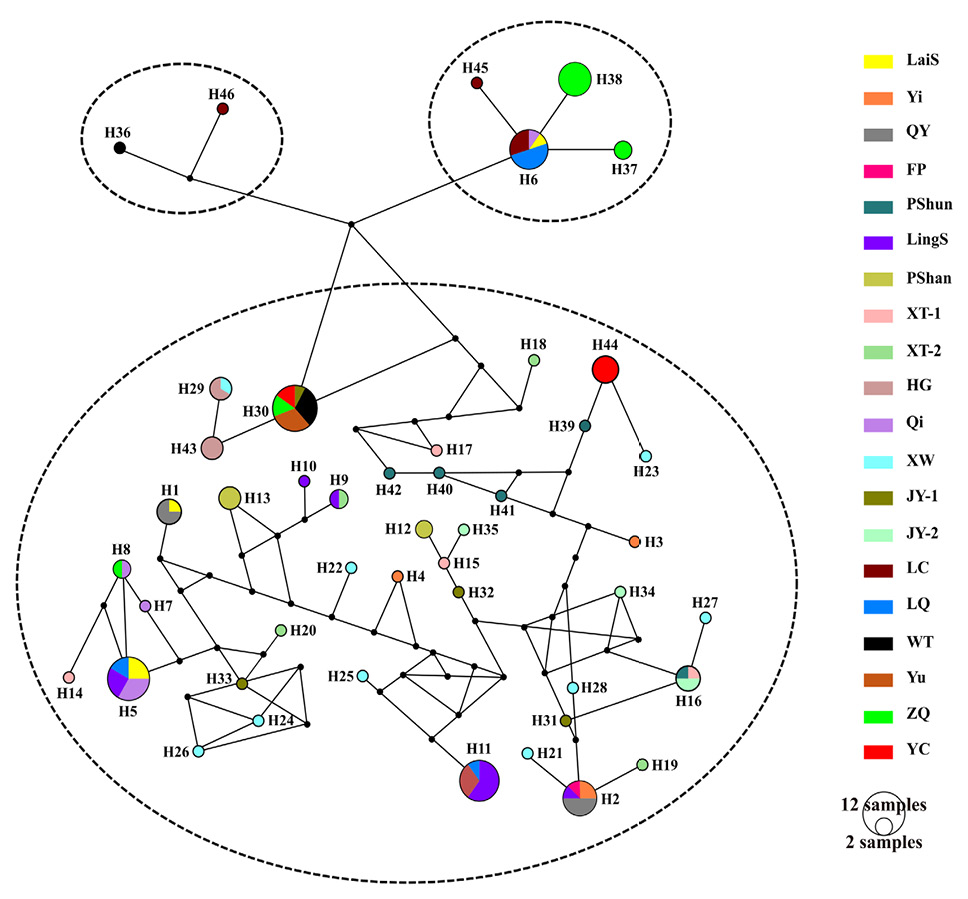
Median-joining haplotype network based on the concatenated mitochondrial Cytb and nuclear ITS-1 sequences. Each circle represents a specific haplotype, and its size proportional to its frequency. Different geographical populations are shown in different colors.
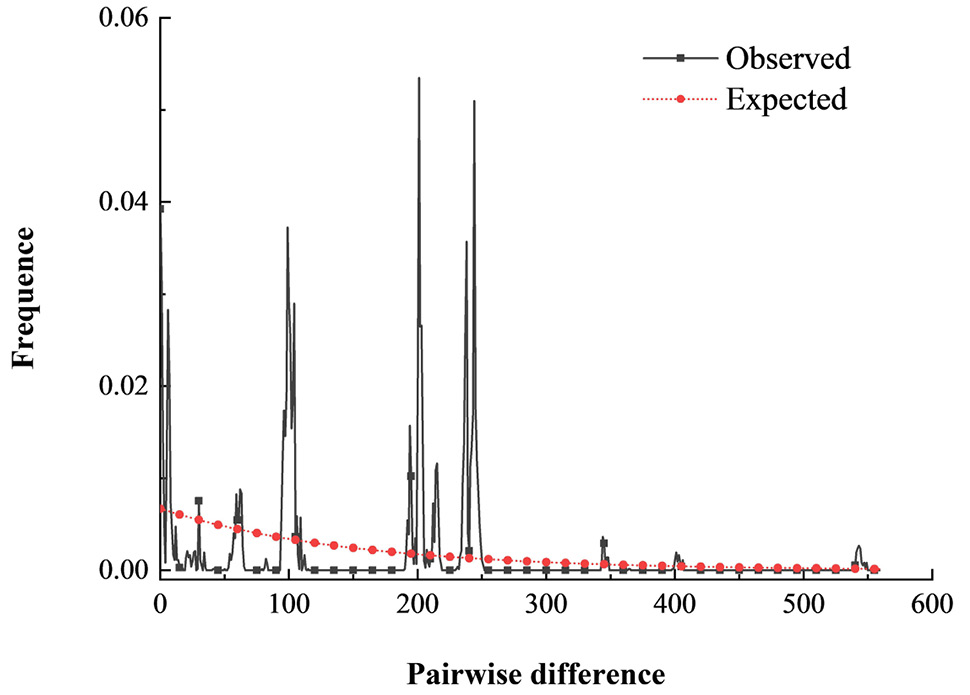
Mismatch distribution based on the concatenated mitochondrial Cytb and nuclear ITS-1 sequences.
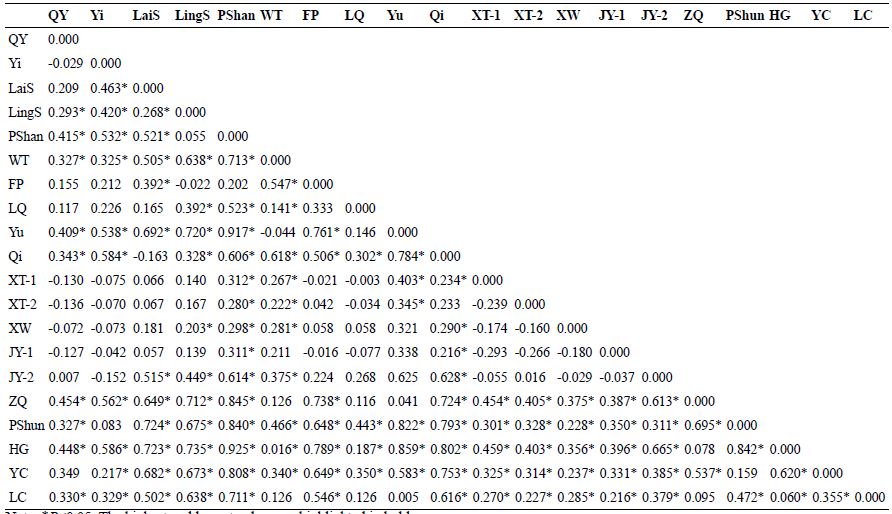
Pairwise Fst values among Dugesia japonica populations.
Note: *P<0.05; The highest and lowest values are highlighted in bold.


