Pioglitazone Mediated Reduction in Oxidative Stress and Alteration in Level of PPARγ, NRF2 and Antioxidant Enzyme Genes in Mouse Preimplantation Embryo during Maternal to Zygotic Transition
Pioglitazone Mediated Reduction in Oxidative Stress and Alteration in Level of PPARγ, NRF2 and Antioxidant Enzyme Genes in Mouse Preimplantation Embryo during Maternal to Zygotic Transition
Xu Lijie, Obaid Ullah, Liu Haixing, Ihsan Ali, Zhongshu Li* and Nan-Zhu Fang*
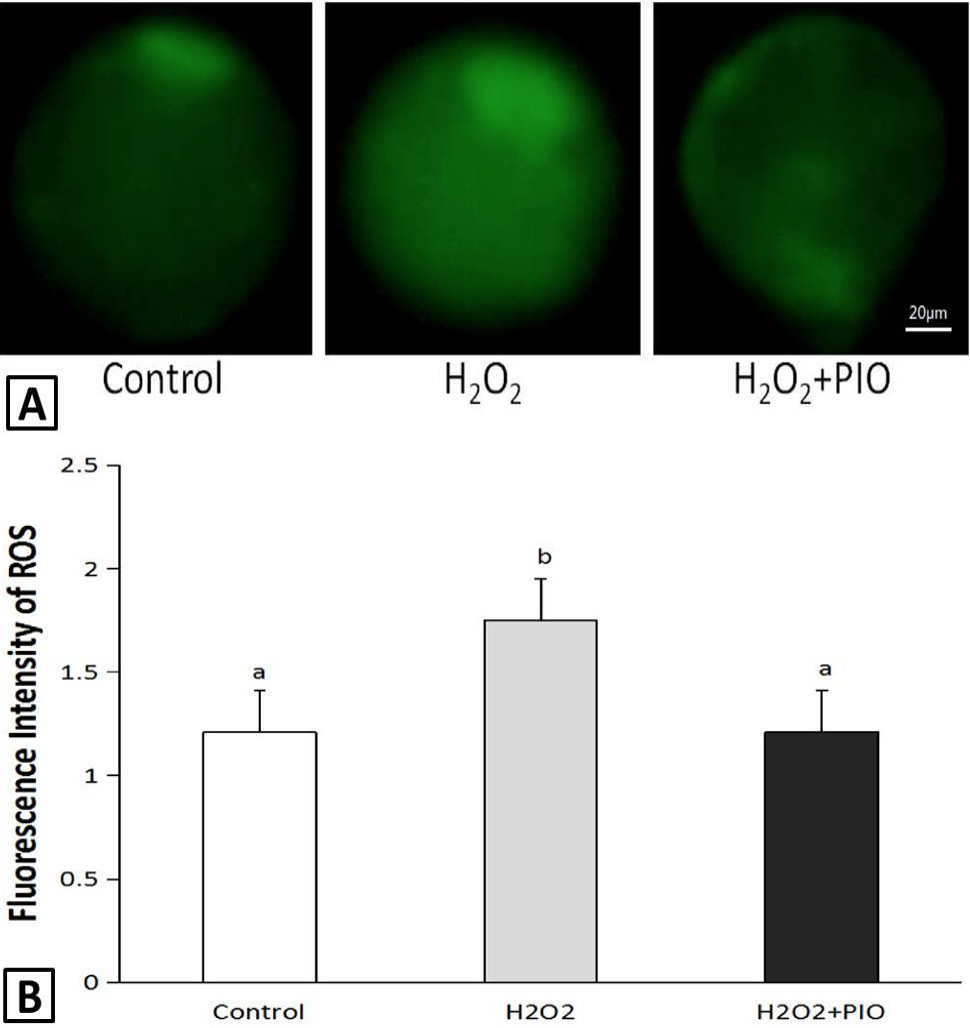
Evaluation of ROS content in blastocysts: A, representative photographs of ROS levels in mouse embryos after staining with DCHFDA; B, Fluorescence intensity was quantified by Image J. Data are expressed as a mean value ± SEM of three independent experiments. Different letters in the same picture mean the significant difference between the treatments (P < 0.05).
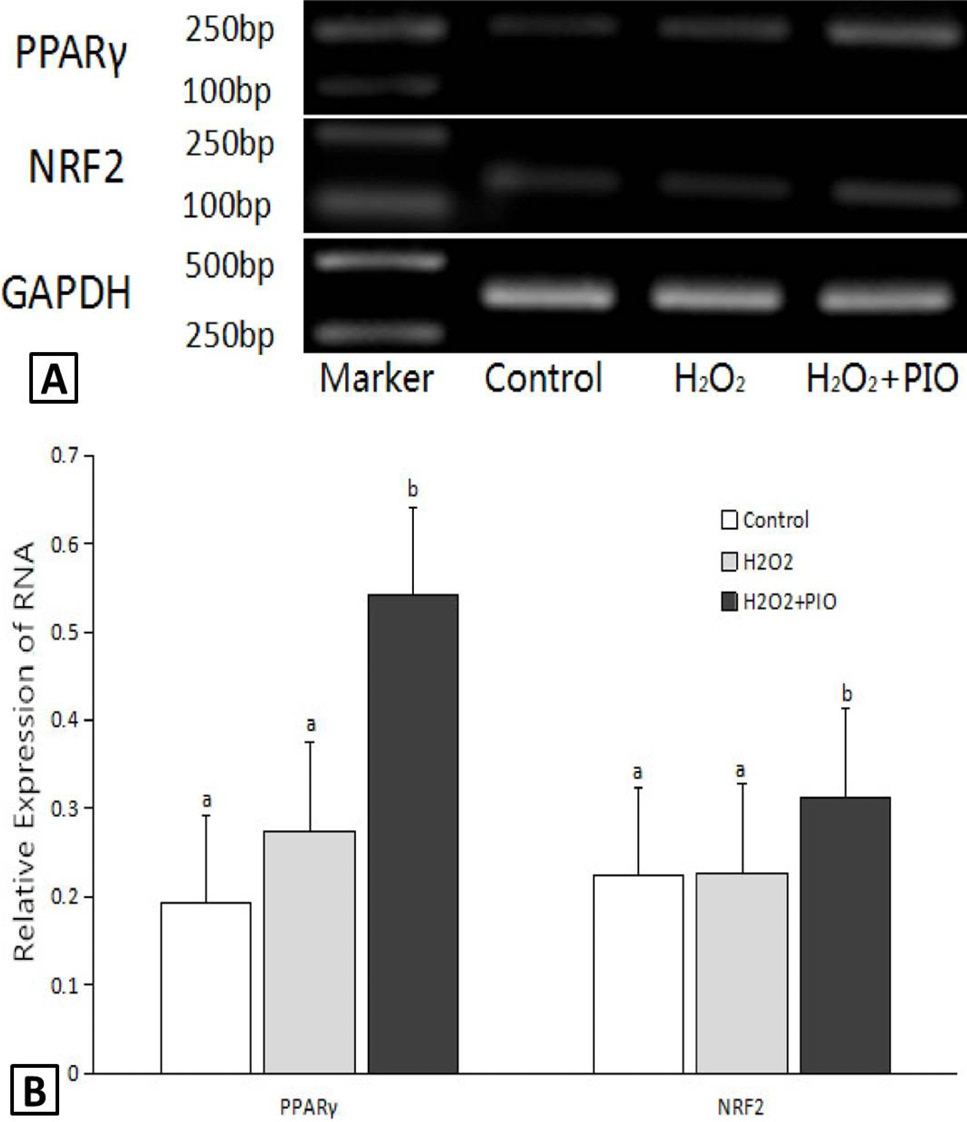
The expression of PPARγ and Nrf2 in cultured mouse embryos, which were exposed to H2O2 of 30 min and then treated with pioglitazone, with untreated embryos as a control. A, PCR results of PPARγ and Nrf2 RNA in mouse embryos; B, relative expression of PPARγ and Nrf2 RNA normalized with the internal marker GAPDH. Different letters in the same picture mean the significant difference between the treatments (P < 0.05).
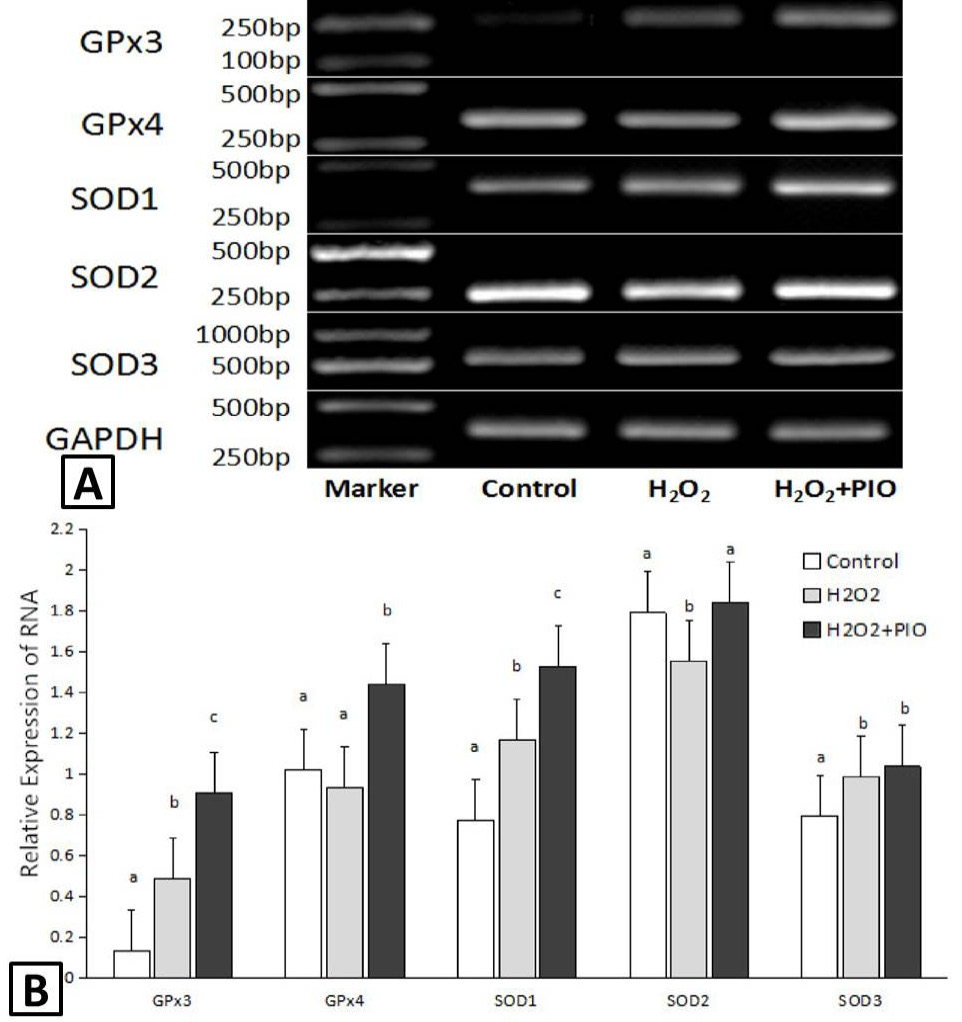
The expression of GPX and SOD in cultured mouse embryos, which were exposed to H2O2 of 30 min and then treated with pioglitazone, with untreated embryos as a control. A, PCR results of GPX and SOD RNA in mouse embryos; B, Relative expression of GPX and SOD RNA normalized with the internal marker GAPDH. Different letters in the same picture mean the significant difference between the treatments (P < 0.05).
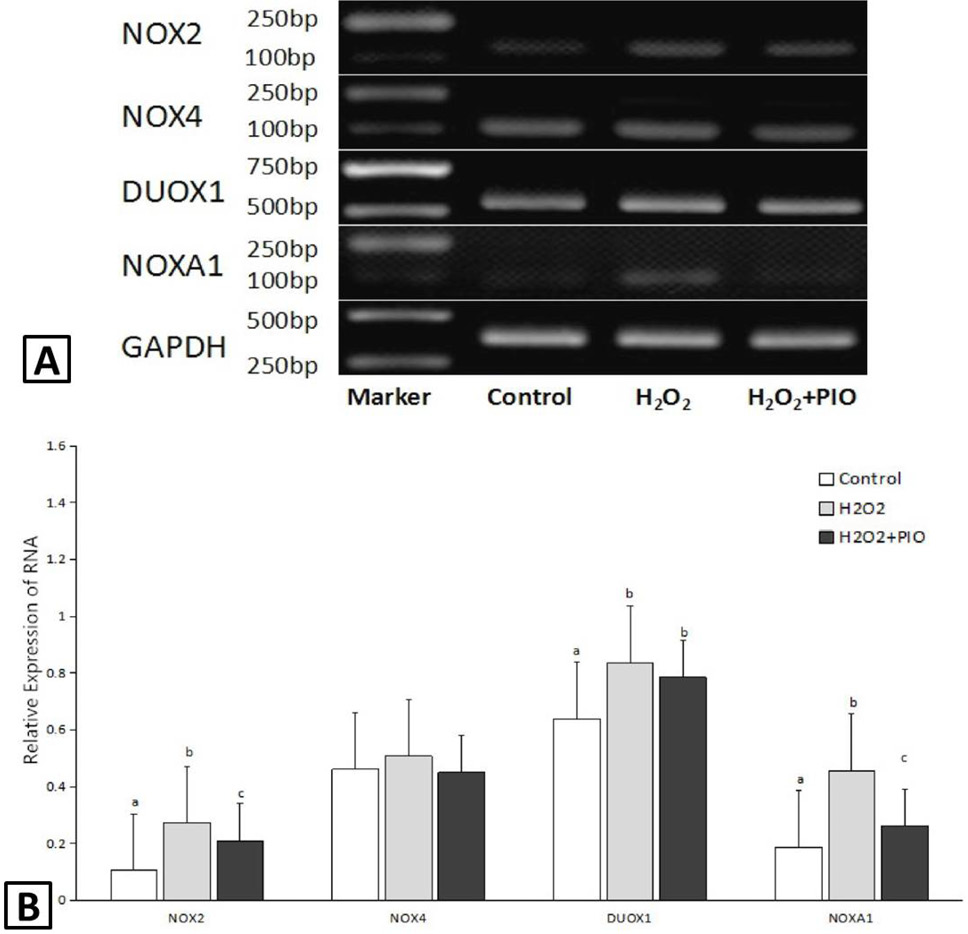
The expression of NADPH oxidase in cultured mouse embryos, which were exposed to H2O2 of 30 min and then treated with pioglitazone, with untreated embryos as a control. A, PCR results of NADPH oxidase RNA in mouse embryos; B, relative expression of NADPH oxidase RNA normalized with the internal marker GAPDH. Different letters in the same picture mean the significant difference between the treatments (P < 0.05).


