
Phenology and Biomass Production of Wheat in Response to Micronutrients and Nitrogen Application


Research Article
Phenology and Biomass Production of Wheat in Response to Micronutrients and Nitrogen Application
Ali Sher1*, Khalid Naveed1, Gulzar Ahmad2, Ayub Khan1, Muhammad Saeed1 and Shah Masaud1
1Department of Agricultural Sciences, University of Haripur, Khyber Pakhtunkhwa, Pakistan, 2Cereal Crop Research Institute, Pirsabak, Nowshera, Khyber Pakhtunkhwa, Pakistan.
Abstract | Zinc (Zn) and iron (Fe) are important micronutrients for the growth and development of plant. Improving N availability to plants improve biomass production and also increase the shoot Fe content and accumulation of Zn in wheat plants. Experiments were conducted at the Cereal Crop Research Institute (CCRI) Pirsabak, Noweshera, Khyber Pakhtunkhwa, Pakistan during 2014-15 and 2015-16 to study the response of wheat to N, Zn and Fe application. Treatments included three levels of N (90, 120 and 150 kg ha-1), three concentrations of Zn and Fe (i.e. 1, 2, 3 kg ha-1) each along with two controls i.e. no micro nutrients no water (control-I) and no micro nutrients + water (control-II). The N was soil applied and MN as foliar spray at booting stage. Days to anthesis, leaf area tiller-1, leaf area index, plant height, days to physiological maturity and biological yield were significantly increased by both N and Zn while the same parameters except days to anthesis, days to physiological maturity were also significantly enhanced by using Fe. Result revealed that higher leaf area tiller-1 (113 cm2), leaf area index (2.3), plant height (100 cm), biological yield (11431 kg ha-1) by 150 kg N ha-1 , 3 kg Zn ha-1 and 1 kg Fe ha-1 of wheat as compared to the control-I. In conclusion, 16 % increases in biomass production was observed with Zn and Fe at the rate of 3 and 1 kg ha-1 respectively along with 150 kg N ha-1 over no fertilization thus combination of the 150 kg ha-1, 3 kg Zn ha-1 and 1 kg Fe ha-1 is recommended for improving biomass and leaf area. Further studies are recommended to understand the mechanistic approach of such improvement.
Received | July 23, 2018; Accepted | September 23, 2018; Published | October 12, 2018
*Correspondence | Ali Sher, Department of Agricultural Sciences, University of Haripur, Khyber Pakhtunkhwa, Pakistan; Email: alisherkhanchd@gmail.com
Citation | Sher, A., K. Naveed, G. Ahmad, A. Khan, M. Saeed and S. Masaud. 2018. Phenology and biomass production of wheat in response to micronutrients and nitrogen application. Sarhad Journal of Agriculture, 34(4): 712-723.
DOI | http://dx.doi.org/10.17582/journal.sja/2018/34.4.712.723
Keywords | Phenology, Biomass Production, Micronutrients, Nitrogen, Wheat Production
Introduction
Wheat (Triticum aestivum L.) is an important food crop of the world as well as a staple food crop in Pakistan (Hussain et al., 2010). In most Asian countries, more than 50% of the daily calorie intake comes from wheat (Cakmak, 1999). Although wheat is covering a large acreage but actual yields are much less than the potential yields of wheat (Mann et al., 2004). Being an important food crop, its demand is likely to be increased by 60% by 2050 (Alexandratos and Bruinsma, 2012). In Pakistan wheat is cultivated on 9. 21 million ha with a production of 25.1 million tons during 2015, while in Khyber Pakhtunkhwa (KP), it is cultivated on 0.73 million ha with a production of 1.26 million tons. Wheat average yield in Pakistan is 2.72 tons ha-1 while in KP its average yield is 1.7 tons ha-1 (MNFSR, 2015). This low wheat productivity in the KP, could be due to imbalance fertilization, particularly the lack of micro nutrients application.
Proper amount of fertilizer application plays an important role in increasing crop productivity (Randhawa and Arora, 2000). Nitrogen is one of the key macronutrient elements necessary for boosting the production of wheat (Grant et al., 2016). Nitrogen is an integral part of chlorophyll, increasing tillering ability (Warraich et al., 2002), thus had a strong effect on physiological processes of plants, including plant metabolic activities, photosynthesis (Ali et al., 2000; Bloom, 2015). Micronutrients (MN) are needed in small amounts but essential for plant growth and regulation of different functions in plants (Marschner, 1995). In Pakistan, micronutrients deficiencies are wide spread due to low organic matter content and calcareous nature of soils (Narimani et al., 2010). It has been reported that Zn availability to plants in almost half of the cereal-based cropping system in the world is less than the required level (Cakmak, 2002). Micronutrients application increases the yield and quality of crop (Mousavi et al., 2013; Cakmak et al., 2010) suggest that soil or foliar application of Fe and Zn may increase the respective metal concentration in wheat and may also increase their activity in the flag leaf and stem during grain filling. The combined application of Fe-Zn may prove more promising results as compared to sole application of either metal (Habi, 2012). Fe and Zn concentrations vary with in a grain, and depend on the grains size (Velv et al., 2011) and number of grain spike-1 (Nowack et al., 2008). Sramkova et al. (2009) observed 5 mg kg-1 Zn in wheat endosperm while the embryo and aleurone layer contained 150 mg kg-1 Zn.
Foliar application of Zn is considered as an important Zn enrichment strategy in wheat grains. Lack of these micronutrients in crop plants may be due to its unavailability of Zn in soil (Ghasemian et al., 2010). In such circumstances when micronutrients availability from soils are less and their deficiency cannot be rectified then foliar application is a sound and useful option (Sarkar et al., 2007; Cakmak, 2008 and Babaeian et al., 2011) for improving the crop growth. Nitrogen fertilization not only increase grain yield but has also been reported to facilitate Zn and Fe uptake in wheat grain (Cakmak et al., 2010; Shi et al., 2010). The increased plants foliage due to nitrogen application enhanced the uptake of micronutrients (Mortvedt and Gilkes, 1993). The facilitated uptake and transport of Zn and Fe is attributed to the presence of metal chelating compounds such as 2-deoxymuginic acid which is responsible for the translocation of Fe and Zn from the flag leaves of wheat to grains (Barunwati et al., 2013). A positive relation of Fe and Zn contents in grain were observed with N fertilization (Kutman et al. 2011). Nitrogenous fertilizers are commonly used to obtain high yields and improve the grain protein (Ehdaie and Waines, 2001; Morgounov et al., 2007). The available literature on the combined application of both micro-nutrients for improving wheat biomass, leaf area, and phenology in calcareous and organic matter deficient soil is not documented to our knowledge. Thus, the current field studies were undertaken to understand the role of soil applied nitrogen and foliar applied Zn and Fe on wheat growth and biomass production in central irrigated belt of Khyber Pakhtunkhwa.
Materials and Methods
Field studies were performed to assess the effect of N, Zn and Fe on the wheat phenology, biomass and leaf area development under the agro climatic condition of Nowshera, Pakistan. The trials were carried out at the Cereal Crop Research Institute (CCRI) Pirsabak, Noweshera, Khyber Pakhtunkhwa, Pakistan during the years 2014-15 and 2015-16.
Agro-ecology of the area
Cereal Crop Research Institute, Pirsabak, Noweshera is situated in the north of Khyber Pakhtunkhwa Province of Pakistan. Its location is at 34° north latitude and 71° east longitude. with 280 m altitude from sea level the climatic condition of the site is considered as Semi-arid with a total rainfall of 400 mm, out of which 70 % occurs during monsoon (Figure 1), the monthly mean temperature of the location ranged from minimum of 4.3 0C to a maximum of 35.4 oC (Figure 1).
Experimental soil analysis
Soil samples in triplicate in three randomly locations from a depth of 0-15 cm depth of the experimental site were made before the start of the experiment. The samples were composited, brought to the laboratory of Agricultural Research Institute, Tarnab Peshawar. The stones, debris and other inert material from the samples were removed manually and kept in oven at 70°C till constant weight. The dry samples were grounded using a mesh size of 0.02 mm using soil grinder and were store for soil physicochemical properties. pH of the soil was measured in a suspension of soil and water (1:5) after half an hour of stirring using of pH meter as suggested by McClean, (1982).
Electrical conductivity (EC) was calculated by the procedure of Rhoades (1996) using EC meter. The soil organic matter was determined by using the procedure of Nelson and Soomer (1982) P and K (AB-DTPA extractable) were estimated by the procedure as described by Soltanpour and Schwab (1977) using the Atomic absorption spectrophotometer and flame photometer was used. The soil total N was measured using kjeldhal procedure Bremner and Mulvaney (1982). The soil of the experimental site is deficient in organic matter (%), N (%) and P (mg kg-1) contents while K contents (mg kg-1) were adequate (Table 1).
Table 1: Physico-chemical characteristics of the soil before sowing of wheat crop at Cereal Crop Research Institute, Noweshera.
| Symbol | Values |
| Textural Class | Silty Clay |
| pH | 7.6 |
|
EC (dSm-1) |
0.26 |
| Organic matter (%) | 0.76 |
| Total nitrogen (%) | 0.048 |
|
Phosphorus (mg kg-1) |
4.7 |
|
Potassium (mg kg-1) |
100 |
|
Zinc (mg kg-1) |
0.172 |
|
Iron (mg kg-1) |
0.82 |
Source: Central Laboratory of Agricultural Research Institute, Tarnab Peshawar, Khyber Pakhtunkhwa.
Treatments and materials
The experiment was consisted for factorial arrangement of three nitrogen (N) levels (90,120 and 155 kg ha-1) applied as soil, and foliar application of three levels of micronutrients (MN) i.e. Zn and Fe at the rate of 1, 2, and 3 kg ha-1 each. The treatments combination also included two controls i.e. no micro-nutrients and no water (control-I, -MN–H2O) and no micro-nutrients + water (control-II, -MN+H2O). The randomized complete block design (RCBD) was followed in the experiment, with split plot arrangements replicated four times. Nitrogen levels were allocated to the main plot, while treatment combinations of Zn and Fe along with controls to the sub-plots. Plots size was 5 x 1.8 m having six rows 30 cm apart and 5 m long. The experimental field was ploughed twice followed by cultivator. Then the field was supplied with irrigation water 2-3 weeks before sowing. At suitable moisture conditions, rotavator followed by cultivator was used in the field for preparation of fine seed bed, recently released wheat variety of the Institute “Pirsabak-2013” was sown at the rate of 120 kg seed ha-1 on 20th October during both the years of experimentation using manual hand drill. Full dose of the recommended phosphorus was used as SSP at the time of seeding. The micronutrients were applied at the boot stage. Half of the nitrogen source was applied at the time of seed bed preparation, whereas the remaining half during first irrigation (22 days after sowing) at Feekes 2.0 growth stage. For foliar application of Zn and Fe the solution from ZnSO4.7H2O and FeSO4.10H2O sources were used respectively. The respective solutions were diluted with water while keeping in view the treatments and volume to wet the plot area completely. Control-I plots (Water spray only i.e., no Zn and Fe application) were sprayed with equivalent quantity of water. The foliar treatments were applied at the booting stage (Feekes 10.0) in the late afternoon.
A total of six irrigations were ensured during the crop growth season i.e. 1st irrigation after three weeks post sowing, 2nd at tillering stage, 3rd at spike initiation, 4th at anthesis, 5th at milking and last at grain filling stage. It need to be mentioned here that during the first-year trial, the months of March and April witnessed a high rain fall occurrence due to which the last irrigation was withheld only.
Both types of narrow leaf (grasses) and broad leaf weeds were found in wheat crop. Weedicide Buctril Super 60EC ([bromoxynil+MCPA: Bayer] @750 mL ha-1) was applied after 1st irrigation for the control of broad leaf weeds while for the control of grasses, Puma Super 7.5% EW (fenoxaprop-p-ethyl) was used. Harvesting was done manually during 2nd week of May both years.
Observation and measurements
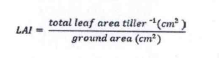
Phenological observations in term of days to anthesis and physiological maturity were recorded. The days to anthesis was considered extrusion of anthers in the spike and the days were counted from the date of sowing till the date on which 4/5th of the spikes produced the anthers in each subplot. Disappearance of greenish color from glumes of wheat spikes was consider as a yard stick for observing physiological maturity the days difference between sowing and date of 80% plants physiological maturity were worked out. At anthesis stage five tillers from central rows in each subplot were collected at random for leaf area and leaf area index calculation. The Leaf area of all leaves was measured with the help of leaf area measuring machine (LI-COR Model LI-3000 A). The leaf area index was calculated by using the below formula:
Plant height was measured when plants got matured physiologically and the data was recorded by selecting 10 plants randomly and then average was worked out. To measure the biomass production of wheat four central rows in each treatment were harvested, tied in bundles, kept for sun drying and then weighed with the help of spring balance. The biological yield was worked out according to the formula given as under:

Statistical analysis
Analysis of variance technique was used for the statistical analysis of the data obtained according to the RCB design using excel spread sheet. The N, Fe and Zn were taken fixed factors, year as reparative and also fixed factor, where as the replication and its interaction with fixed factors as random factor. Means were compared using least significant differences (LSD) test at p < 0.05.
Results and Discussion
Days to anthesis
Days to anthesis in response to nitrogen (N), zinc (Zn) and iron (Fe) application (Table 2) indicated that N had significantly affected days to anthesis while the effects of Zn and Fe were found not significant. The N and Zn interaction was significant for days to anthesis. Year (Y) as a source of variation did not significantly affect days to anthesis. The planned mean comparison of control-I (- micronutrients,-H2O) vs rest treatments had significant effect on days to anthesis while control-II (- micronutrients + H2O) vs. rest treatments were found not significant for days to anthesis. Days to anthesis were delayed in 2014-15 (128.2 days) and 2015-16 (128.0 days) with 150 kg N ha-1. Combined over years, it was observed that fertilizer N at the rate of 150 kg ha-1 took more days to anthesis (128) as compared to 120 kg N ha-1 (124 days) and 90 kg N ha-1 (122 days). The delay in anthesis stage with increasing nitrogen application might be due to the increased vegetative growth. Chondie (2015) also reported that application of nitrogen at higher rates beyond 100 kg ha-1 increased vegetative growth due to greater chlorophyll content which leads to delay in anthesis of wheat. The foliar application of micronutrients have no significant effects on days to anthesis, however early anthesis (123 days) was recorded in plots treated with 3 kg ha-1 Zn, which was statistically at par with plots that received 2 kg Zn ha-1. However, late anthesis (125 days) was observed in plots that received 1 kg Zn ha-1. Similarly, the application of 3 kg Fe ha-1 had earlier anthesis (124.7 days) than lower rates of the Fe application.
Days to physiological maturity
The response of N, Z and Fe for days to physiological maturity is presented in Table 2. Nitrogen and Zn application had significant (P<0.05) effect for physiological maturity in both years, while Fe had no significant effect on days to physiological maturity. The interaction N and Zn, Y and N, Y and micronutrients, Y and N and micronutrients had significant effects on days to physiological maturity, while the remaining interactions were found non significant. Similarly, when means were compared, that of Control-I vs rest and Control-II vs rest were found significant for days to physiological maturity. Years as a source of variation were also found significant.
Table 2: Days to anthesis and physiological maturity of wheat as affected by nitrogen, zinc and iron levels.
|
Nitrogen (kg ha-1) |
Days to anthesis | Days to maturity | ||||
| 2014-15 | 2015-16 | Means | 2014-15 | 2015-16 | Means | |
| 90 | 121.5 | 122.1 | 122.8 c | 156 | 157 | 157 c |
| 120 | 124.8 | 123.3 | 124.0 b | 156 | 162 | 159 b |
| 150 | 128.2 | 128.0 | 128.1 a | 161 | 162 | 162 a |
| LSD (0.05) | 1.1 | 2.5 | 2.2 | 3 | 4 | 2 |
|
Zinc (kg ha-1) |
||||||
| 1 | 125.6 | 125.5 | 125.5 | 161 | 162 | 162 a |
| 2 | 125.1 | 124.9 | 124.9 | 158 | 160 | 160 b |
| 3 | 125.8 | 123.4 | 123.4 | 155 | 157 | 157 c |
| LSD (0.05) | NS | NS | NS | 3 | 3 | 2 |
|
Iron (kg ha-1) |
||||||
| 1 | 124.9 | 124.5 | 124.7 | 158 | 162 | 160 |
| 2 | 124.9 | 124.3 | 124.6 | 159 | 161 | 160 |
| 3 | 124.7 | 124.2 | 124.5 | 158 | 160 | 159 |
| LSD (0.05) | NS | NS | NS | NS | NS | NS |
|
Control (-MN,-H2o) |
124.8 | 125.4 | 125.1b | 152 | 157 | 154 b |
| Rest plots | 138.7 | 138.3 | 138.5 a | 175 | 178 | 177 a |
| Significance | ns | ** | * | ** | ** | ** |
|
Water (-MN,+H2o) |
124.3 | 124.8 | 124.5 | 153 | 156 | 155 b |
| Rest plots | 138.7 | 138.3 | 138.5 | 175 | 178 | 177 a |
| Significance | ns | Ns | ns | ** | * | ** |
| Mean (year) | 131.5 | 131.5 | ns | 169.0 | 171.5 | ** |
| Interactions | Level of Sign | Level of Sign | ||||
|
Zn × Fe |
Ns | Ns | ||||
|
N × Zn |
** | * | ||||
|
N × Fe |
Ns | Ns | ||||
|
N × Zn x Fe |
Ns | Ns | ||||
| Y x N | Ns | ** | ||||
|
Y × MN |
Ns | ** | ||||
|
Y × N × MN |
Ns | ** | ||||
MN: Micronutrients; “Means followed by different letters in column are significantly different at 5% level of probability; ns: non-significant; **: significant at 1% level of probability; *: significant at 5% level of probability”
The plants reached physiological maturity stage earlier in 2014-15 (161 days) than (162 days). The earlier maturity in following year might be due to uniform rainfall distribution and relatively higher temperature in grain filling duration (Figure 1) in the second year. The fertilized plots took greater days to physiological maturity than both Control-I and Control-II. Earliest physiological maturity (157 days) was recorded in 90 kg ha-1 N treated plots followed by 120 kg ha-1 (159 days) while late physiological maturity (162 days) was recorded in 150 kg ha-1 N treated plots. The increasing N rate might have improved the vegetative growth of the wheat crop and thus have delayed the physiological maturity of wheat (Khan et al., 2008). In case of Zn, earliest physiological maturity (157 days) were observed with 3 kg ha-1 Zn applied plots, followed by 2 kg Zn ha-1 (160 days) while delayed in physiological maturity was recorded with 1 kg Zn ha-1 application. It was founded that high doses of Zn resulted in less days to physiological maturity. The early physiological maturity might be due to the involvement of Zn-finger transcription factors in the development and function of floral tissues of anthers, tapetum, pollen and pistil secretary tissues in many plant species (Sharma et al., 1987; Kobayashi et al., 1998; Hafeez et al., 2013).
Leaf area tiller-1 (cm2)
Leaf area of wheat was significantly influenced by nitrogen, zinc and iron and, years (Table 3). The planned mean comparison of control-I vs rest and control-II vs rest were also found significant for leaf area. The interactions between N x Zn, Y x N, Y x MN (Zn x Fe including control and water spray) and Y x N x MN were found significant for leaf area tiller-1 (cm)2, where the rest of interactions were found non-significant.
The leaf area tiller-1 was significantly higher (104 cm2) in 2015-16 than 2014-15 (97 cm2). The fertilized plots had higher leaf area tiller -1 (113 cm2) than un-fertilized plots (89 cm2). Higher leaf area (117 cm2) was measured with 150 kg N ha-1 application, followed by 120 kg N ha-1 while lower leaf area (86 cm2) was recorded in 90 kg ha-1 N. The mineral N availability are actively involved in vegetative growth and is a major components of the chlorophyll
Table 3: Leaf area and leaf area index of wheat as affected by nitrogen, zinc and iron levels.
|
Nitrogen (kg ha-1) |
Leaf area (cm2) | Leaf area index | ||||
| 2014-15 | 2015-16 | Means | 2014-15 | 2015-16 | Means | |
| 90 | 85 | 87 | 86 | 2.1 | 2.2 | 2.2 c |
| 120 | 101 | 105 | 103 | 2.7 | 2.8 | 2.8 a |
| 150 | 111 | 122 | 117 | 3.3 | 3.4 | 3.4 b |
| LSD (0.05) | 3 | 2 | 2 | 0.1 | 0.1 | 0.1 |
|
Zinc (kg ha-1) |
||||||
| 1 | 95 | 100 | 100 | 2.6 | 2.7 | 2.7 c |
| 2 | 101 | 103 | 103 | 2.8 | 2.8 | 2.8 b |
| 3 | 107 | 107 | 107 | 3.1 | 3.0 | 3.0 a |
| LSD (0.05) | 2 | 2 | 2 | 0.1 | 0.1 | 0.1 |
|
Iron (kg ha-1) |
||||||
| 1 | 103 | 109 | 106 | 3.0 | 2.9 | 2.9 a |
| 2 | 101 | 105 | 103 | 2.8 | 2.8 | 2.8 b |
| 3 | 100 | 104 | 102 | 2.8 | 2.8 | 2.8 b |
| LSD (0.05) | 2 | 2 | 2 | 0.1 | NS | 0.1 |
|
Control (-MN,-H2o) |
84 | 93 | 89 | 2.2 | 2.4 | 2.3 b |
| Rest | 110 | 116 | 113 | 3.1 | 3.1 | 3.1 a |
| Significance | ** | ** | ** | ** | ** | ** |
|
Water (-MN,+H2o) |
83 | 93 | 88 | 2.1 | 2.5 | 2.3 b |
| Rest | 110 | 116 | 113 | 3.1 | 3.1 | 3.1 a |
| Significance | ** | ** | ** | ** | ** | ** |
| Mean (year) | 97 | 104 | ** | 2.6 b | 2.8 a | * |
| Interactions | Level of Sig | Level of Sig | ||||
|
Zn × Fe |
Ns | ** | ||||
|
N × Zn |
** | ** | ||||
|
N × Fe |
Ns | Ns | ||||
|
N × Zn × Fe |
Ns | Ns | ||||
|
Y × N |
** | Ns | ||||
|
Y × MN |
** | ** | ||||
|
Y × M × MN |
* | Ns | ||||
MN: Micronutrients; “Means followed by different letters in column are significantly different at 5% level of probability; Ns: non-significant; **: significant at 1% level of probability; *: significant at 5% level of probability”
(Massignam, et al., 2009), thus increasing the N availability might have resulted in increased plant photosynthesis and hence the leaf area. This increase in leaf area could also be associated with the proteins and enzymes that are involved in a number of plant metabolic processes associated with growth and development that had a high demand for N. More leaf area (107cm2) was attained in 3 kg ha-1 Zn treated plots, followed by 2 kg ha-1 (103 cm2) while lower leaf area (100 cm2) were recorded in 1 kg ha-1 Zn treated plots. The Zn deficiency causes stunted growth, chlorosis and smaller leaves, and also affecting Zn dependent regulation and maintenance of the gene expression required for the tolerance of environmental stresses in plants (Cakmak, 2000). Providing foliar Zn might have fulfilled the plants requirements and hence the leaf area. Increasing the Fe application had decreased the leaf area from 102 (1 kg Fe ha-1) to 106 (3 kg Fe ha-1). The Fe is considered as an essential nutrient for the growth and development of crop. The application of Fe improved biosynthesis of chlorophyll, electron transport chain in both mitochondria and chloroplasts and nitrogen fixation (Nouet et al., 2011; Zayed et al. 2011; Kahrariyan et al., 2013; Yruela, 2013; Rawashdeh et al., 2014), and thus have increased the plant leaf area. However, the application of low dose of Fe was better
Table 4: Plant height and biological yield of wheat as affected by nitrogen, zinc and iron levels.
|
Nitrogen (kg ha-1) |
Plant height (cm) | Biological yield (kg ha-1) | ||||
| 2014-15 | 2015-16 | Means | 2014-15 | 2015-16 | Means | |
| 90 | 80 | 83 | 82 c | 9541 | 10002 | 9771 |
| 120 | 88 | 92 | 90 b | 10134 | 10300 | 10217 |
| 150 | 98 | 97 | 97 a | 11151 | 10384 | 10767 |
| LSD (0.05) | 4 | 4 | 4 | 241 | 325 | 325 |
|
Zinc (kg ha-1) |
||||||
| 1 | 88 | 89 | 89 b | 10261 | 10147 | 10147 |
| 2 | 90 | 92 | 92 a | 10403 | 10336 | 10336 |
| 3 | 92 | 92 | 92 a | 10721 | 10628 | 10628 |
| LSD (0.05) | 2 | 2 | 2 | 271 | 397 | 397 |
|
Iron (kg ha-1) |
||||||
| 1 | 91 | 93 | 92 a | 10635 | 10586 | 10611 |
| 2 | 90 | 92 | 91 a | 10259 | 10144 | 10202 |
| 3 | 89 | 90 | 89 b | 10492 | 10106 | 10299 |
| LSD (0.05) | ns | 2 | 2 | 271 | 397 | 397 |
|
Control (-MN,+H2o) |
80 | 84 | 82 | 8954 | 10142 | 9548 |
| Rest | 99 | 101 | 100 | 11457 | 11406 | 11431 |
| Significance | ** | ** | ** | ** | NS | ** |
|
Control (-MN,-H2o) |
81 | 84 | 83 | 8794 | 9567 | 9180 |
| Rest | 99 | 101 | 100 | 11457 | 11406 | 11431 |
| Significance | ** | ** | ** | ** | ** | ** |
| Mean (year) | 90 | 92 | * | 10125 | 10486 | NS |
| Interaction | Level of Sig | Level of Sig | ||||
|
Zn × Fe |
** | ** | ||||
|
N × Zn |
** | Ns | ||||
|
N × Fe |
Ns | ** | ||||
|
N × Zn × Fe |
Ns | Ns | ||||
|
Y × N |
** | ** | ||||
|
Y × MN |
** | ** | ||||
|
Y × N × MN |
** | ** | ||||
MN: Micronutrients; “Means followed by different letters in column are significantly different at 5% level of probability; Ns: non-significant; **: significant at 1% level of probability; *: significant at 5% level of probability”
than high levels, suggesting an adverse effect of high level of Fe, or antagonistic effects of higher levels of Fe with Zn (De Datta et al., 1994).
Leaf area index
Data regarding leaf area index are reported in Table3. Nitrogen, Zn and Fe significantly affected leaf area index. Year as a source of variation was also found significant. The planned mean comparison of control-I vs rest and control -II vs rest revealed significant effects on leaf area index. The nitrogen and zinc and year and micronutrients interaction were found significant while the rest of the interactions were found not significant on leaf area index. During 2014-15, the leaf area index (2.6) was less than 2015-16 (2.8). This higher leaf area index in the following year might be related to the increase leaf area in the 2nd year as compared to 1st year. The fertilized plots had significantly higher leaf area index than both controls. Higher leaf area index (3.4) were recorded with 150 kg N ha-1 followed by 120 kg N ha-1(2.8) while lower leaf area index (2.2) was recorded at 90 kg ha-1 N treated plots. Nitrogen is considered as major components of leaf chlorophyll content. The increased availability of N is suggested to increase the N uptake, and hence the chlorophyll. Thus, the higher chlorophyll might have increased the plant photosynthesis, and hence the leaf area (Warraich et al., 2002). This increased leaf area index might also be due to increase number of leaf plant-1 with increasing N application (Warraich et al., 2002) More leaf area index (3.0) was recorded in 3 kg ha-1 Zn treated plots followed by 2 kg ha-1 Zn (2.8), while lower leaf area index (2.7) was recorded in 1 kg ha-1 Zn treated plots. The metabolism of proteins, nucleic acids, lipids and carbohydrates depend largely on Zn improves the leaf area and leaf area index (Rhodes and Klug, 1993; Nouet et al., 2011). Leaf area index was higher in 1 kg ha-1 Fe treated plots while 2 and 3 kg ha-1 Fe treated plots produced the lower and statistically similar leaf area index (2.8) each. The Fe is also an essential cofactor for the functioning of a number of proteins and enzymes that are involved in metabolic processes of chloroplast, and hence avoid the chlorosis (Vallee and Falchuk, 1993; Yruela, 2013).
However, the Fe toxicity as observed at higher levels causing damage to proteins, lipids and DNA. Furthermore, accumulation of hydrogen sulfide, organic acids and other reduction products might also have led to its toxicity (De Datta et al., 1994), thus the leaf area index decreased with increasing Fe application.
Plant height (cm)
Both macro (N) and micro (Zn, Fe) nutrients application had significantly affected plant height (Table 4). Years as source of variation were also found significant. Mean comparison of control-I vs rest and control-II vs rest were also found significant for plant height of wheat. Moreover, significant interactions were found among N and Zn, Zn and Fe, while rest of the interactions was found non significant for plant height. The plant height in 2014-15 (90 cm) was significantly less than 2015-16 (92 cm). The improved individual plant performance in the following year might have increased the plant tallness in the 2nd year as compared to 1st year. Fertilization of macro and micro nutrients had resulted in taller plants than both control-I as well as control-II. With increase in N application rate the plant tallness increased. It was noted that taller plants (97cm) were recorded in 150 kg N ha-1 followed by 120 kg ha-1 (90 cm), while dwarf plant (82 cm) were observed in 90 kg ha-1 N application. Plan tallness is directly related to the vegetative growth of the plants. However, the vegetative growth is highly supported by N, and increasing the nitrogen application had increased the plant vegetative growth (Warraich et al., 2002). Thus, the higher N application had increased the plant tallness (Bloom, 2015). More plant height (92 cm) was recorded in 3 kg Zn ha-1 treated plots which were statistically similar with 2 kg ha-1 Zn (92 cm) while dwarf plants (89 cm) were recorded in 1 kg Zn ha-1. The Zn is required for the synthesis of tryptophan, the precursor of indole acetic acid (IAA) that might lead to increase in inter node length and, hence the plant height (Marschner, 1995; Movahhedy-Dehnavy et al., 2009; Zayed et al.,2011; Abdoli et al., 2014; Naz et al., 2015). Taller plants (92 cm) were recorded in 1 kg Fe ha-1 which was statistically at par with 2 kg ha-1 Fe while lower plant height (89 cm) was recorded in 3 kg ha-1 Fe treated plots. Chlorophyll biosynthesis and nitrogen fixation are triggered by Fe that might have affected growth (Yruela, 2013; Abdoli et al., 2014; Zain et al., 2015; Esfandiari et al., 2016) and hence plant height. However, the Fe toxicity beyond 2 kg Fe ha-1 or antagonistic effects of Fe with Zn might be the possible explanation for lowering the plant tallness with increased Fe application.
Biological yield (kg ha-1)
The application of N, Zn and Fe had significantly (p < 0.05) affected biological yield of wheat (Table 4). Year as a source of variation, and the planned mean comparison of control-I vs rest and control-II vs rest were found significant for biological yield. The significant interactions for biological yield were Zn × Fe, N × Fe, Y × MN, Y × N × MN, whereas the rest of the interactions were found non significant. The biological yield was increased by 3.5% during following year as compared to the first year. The increased individual plant performance in term of improved phenology, plant stature and leaf area could possible explain this increase in biomass during 2nd year. Fertilized plots had significantly higher biological yield than control-I and control-II. Comparing N application, with increase in N, higher biological yield was recorded in 150 kg N ha-1 followed by 120 kg ha-1 N application, while 90 kg ha-1 N treated plots resulted in less biological yield. the application of N directly affects the individual plant performance, plant height, number of leaves and other vegetative growth (Marino et al. 2011; Naz et al. 2016), thus increasing the N might have resulted in greater N availability, and hence the plant performance and biological yield (Bloom, 2015).
Regarding Zn application more biological yield was found in 3 kg ha-1 Zn treated plots which were statistically at par with biological yield recorded with 2 kg ha-1 Zn treated plots, while lower biological yield was recorded in 1 kg ha-1 Zn treated plots. Zinc being a necessary component of several enzymes that participate in synthesis of carbohydrates, lipids, proteins and nucleic acids, thus play important roles in the production of biomass (Cakmak, 2008). Zn foliar application at grain filling stage had higher pigment contents and biological yield (Mosanna and Khalilvand-Behrozyar, 2015). Our results are confirmed by (Cakmak, 2008; Kutman et al. 2010; Kutman et al. 2011; Keram et al. 2012; Zain et al. 2015 and Esfandiari et al. 2016). Higher biological yield was recorded with 1 kg ha-1 Fe treated plots and lower in 2 kg ha-1 Fe treated plots. Iron is an essential critical nutrient for plant life (Guerinot and Yi, 1994), as this element is involved in plant metabolism. Iron plays a significant role in most of the basic biological processes such as nitrogen fixation, uptake mechanisms, chlorophyll synthesis, photosynthesis, and respiration (Kim and Rees, 1992), and might have positive effects on biological yield if supplied in an optimum amount. The possible mechanistic approach for improving biological yield with low Fe concentration might be either the optimum Fe been needed for plant growth, which is 1 kg ha-1 as evident from the data, or could be indirect antagonistic effects of Zn, which further increased with increasing Fe application.
Conclusions and Recommendations
The application of N at the rate of 150 kg ha-1 showed superior results in term of improved leaf area and biomass production. Application of Zn at the rate of 3 kg and Fe at the rate of 1 kg ha-1 performed better in terms of growth and biomass production as compared to other levels of Zn and Fe. It was further noted the higher than 2 kg Fe ha-1 had detrimental effects on wheat performance. Thus, a combination of 150 N, 3 kg Zn and 1 kg Fe ha-1 is recommended a general production technology for improving wheat phenology, leaf area development and biomass production. It is further recommended that mechanistic studies should be made to understand the possible mechanisms of biomass and phenology improvement due to foliar micro-nutrients application.
Author’s Contribution
Ali Sher: Conceived the idea, conducted the research, performed the experiments, collected data and wrote the article.
Khalid Naveed: Supervised and designed the study and analysed the data.
Gulzar Ahmad: Helped in experiments, field layout and data collection.
Ayub Khan: Supported in literature search.
Muhammad Saeed: Helped insight analysis of data.
Shah Masaud: Helped in filed layout and data collection.
References
Alexandratos, N. and J. Bruinsma. 2012. World agriculture towards 2030/2050: the 2012 revision (Vol. 12, No. 3). FAO, Rome: ESA Working paper.
Ali, A., M.A. Choudhry, M.A. Malik and R. Ahmad. 2000. Effect of various doses of nitrogen on the growth and yield of two wheat (Triticum aestivum L.) cultivars. Pak. J. Biol. Sci., 3(6): 1004-1005. https://doi.org/10.3923/pjbs.2000.1004.1005
Barunawati, N., R.F.H. Hettwer, B. Bauer and N. Von-Wirén. 2013. The influence of inorganic nitrogen fertilizer forms on micronutrient retranslocation and accumulation in grains of winter wheat. Front. Plant Sci., 4: 320. https://doi.org/10.3389/fpls.2013.00320
Bloom, A.J. 2015. The increasing importance of distinguishing among plant nitrogen sources. Curr. Opin. Plant Biol., 25: 10-16. https://doi.org/10.1016/j.pbi.2015.03.002
Cakmak, I. and C. Engels. 1999. Role of mineral nutrients in photosynthesis and yield formation. Miner. Nutr. Crops., 141-168.
Cakmak, I. 2000. Tansley Review No. 111 Possible roles of zinc in protecting plant cells from damage by reactive oxygen species. New Phytol., 146(2): 185-205. https://doi.org/10.1046/j.1469-8137.2000.00630.x
Cakmak, I. 2008. Enrichment of cereal grains with zinc: agronomic or genetic biofortification? Plant Soil., 302(1-2): 1-17. https://doi.org/10.1007/s11104-016-3166-9
Cakmak, I., M. Kalayci, Y. Kaya, A.A. Torun, N. Aydin, Y. Wang and L. Ozturk. 2010. Biofortification and localization of zinc in wheat grain. J. Agric. Food Chem., 58(16): 9092-9102. https://doi.org/10.1021/jf101197h
Cakmak, I., W.H. Pfeiffer and B. McClafferty. 2010. Review: biofortification of durum wheat with zinc and iron. Cere. Chem., 87(1): 10-20. https://doi.org/10.1094/CCHEM-87-1-0010
De-Datta, S.K., H.U. Neue, D. Senadhira and C. Quijano. 1994. Success in rice improvement for poor soils. In: Proceedings of the workshop in adaption of plants to soil stresses, 1-4 August 1993, University of Nebraska, Lincoln, Nebraska. INTSORMIL Publication No. 94-2. Lincoln, Nebraska (USA): Univ. Nebraska. pp. 248-268.
Ehdaie, B. and J.G. Waines. 2001. Sowing date and nitrogen rate effects on dry matter and nitrogen partitioning in bread and durum wheat. Field Crops Res., 73(1): 47-61. https://doi.org/10.1016/S0378-4290(01)00181-2
Esfandiari, E., M. Abdoli, S.B. Mousavi and B. Sadeghzadeh. 2016. Impact of foliar zinc application on agronomic traits and grain quality parameters of wheat grown in zinc deficient soil. Ind. J. Plant Physio., 21(3): 163-170. https://doi.org/10.1007/s40502-016-0225-4
Grant, C.A., A.P. Moulin and N. Tremblay. 2016. Nitrogen management effects on spring wheat yield and protein concentration vary with seeding date and slope position. Agron. J., 108(3): 1246-1256. https://doi.org/10.2134/agronj2015.0510
Guerinot, M.L. and Y. Yi. 1994. Iron: nutritious, noxious, and not readily available. Plant Physiol., 104(3): 815. https://doi.org/10.1104/pp.104.3.815
Hafeez, B., Y.M. Khanif and M. Saleem. 2013. Role of zinc in plant nutrition-a review. Am. J. Experim. Agric., 3(2): 374. https://doi.org/10.9734/AJEA/2013/2746
Khan, A., M.T. Jan, M. Arif, K.B. Marwat and A. Jan. 2008. Phenology and crop stand of wheat as affected by nitrogen sources and tillage systems. Pak. J. Bot., 40(3): 1103-1112.
Kahrariyan, B., F. Yeganehpoor, V. Beyginiya and F. Samadiyan. 2013. Effect of FE foliar application on morphological and physiological traits of different dryland wheat cultivars. Int. J. Adv. Biolog. Biomed. Res., 1(12): 1583-1589.
Keram, K.S., B.L. Sharma and S.D. Sawarkar. 2012. Impact of Zn application on yield, quality, nutrients uptake and soil fertility in a medium deep black soil (vertisol). Int. J. Sci. Environ. Technol., 1(5): 563-571.
Keram, K.S., B.L. Sharma, M.L. Kewat and G.D. Sharma. 2014. Effect of zinc fertilization on growth, yield and quality of wheat grown under agro-climatic condition of kymore plateau of Madhya pradesh, India. BioScan., 9(4): 1479-1483.
Kim, J. and D.C. Rees. 1992. Structural models for the metal centers in the nitrogenase molybdenum-iron protein. Sci., 257(5077): 1677-1682. https://doi.org/10.1126/science.1529354
Kobayashi, A., A. Sakamoto, K. Kubo, Z. Rybka, Y. Kanno and H. Takatsuji. 1998. Seven zinc finger transcription factors are expressed sequentially during the development of anthers in petunia. Plant J., 13(4): 571-576. https://doi.org/10.1046/j.1365-313X.1998.00043.x
Kutman, U.B., B. Yildiz and I. Cakmak. 2011. Improved nitrogen status enhances zinc and iron concentrations both in the whole grain and the endosperm fraction of wheat. J. Cere. Sci., 53(1): 118-125. https://doi.org/10.1016/j.jcs.2010.10.006
Mann, R.A., W.A. Jehangir and I. Masih. 2004. Improving crop and water productivity of rice-wheat system in Punjab, Pakistan. Proc. 4th int. crop sci. congr. Brisbane. (Vol. 25).
Marino, S., R. Tognetti and A. Alvino. 2011. Effects of varying nitrogen fertilization on crop yield and grain quality of emmer grown in a typical Mediterranean environment in central Italy. Eur. J. Agron., 34(3): 172-180. https://doi.org/10.1016/j.eja.2010.10.006
Marschner, H. 1995. Mineral Nutrition of Higher Plants. London: Academic Press.
Massignam, A.M., S.C. Chapman, G. Hammer and S. Fukai. 2009. Physiological determinants of maize and sunflower grain yield as affected by nitrogen supply. Field Crops Res., 113(3): 256-267. https://doi.org/10.1016/j.fcr.2009.06.001
MNFSR. 2015. Agriculture statistics of Pakistan. Ministry of National Food Security and Research, Islamabad, Pakistan.
Morgounov, A., H.F. Gómez-Becerra, A. Abugalieva, M. Dzhunusova, M. Yessimbekova, H. Muminjanov and I. Cakmak. 2007. Iron and zinc grain density in common wheat grown in Central Asia. Euphytic., 155(1-2): 193-203. https://doi.org/10.1007/s10681-006-9321-2
Mortvedt, J.J. and R.J. Gilkes. 1993. Zinc fertilizers. Zinc soils plants (pp. 33-44). Springer Netherlands. https://doi.org/10.1007/978-94-011-0878-2_3
Mousavi, S.R., M. Galavi and M. Rezaei. 2013. Zinc (Zn) importance for crop production-a review. Int. J. Agron. Plant Prod., 4(1): 64-68.
Movahhedy-Dehnavy, M., S.A.M. Modarres-Sanavy and A. Mokhtassi-Bidgoli. 2009. Foliar application of zinc and manganese improves seed yield and quality of safflower (Carthamus tinctorius L.) grown under water deficit stress. Ind. Crops Prod., 30(1): 82-92. https://doi.org/10.1016/j.indcrop.2009.02.004
Naz, G. and M. Akmal. 2016. Yield and yield contributing traits of wheat varieties as affected by nitrogen rates. Sarhad J. Agric., 32(3): 212-217. https://doi.org/10.17582/journal.sja/2016.32.3.212.217
Narimani, H., M.M. Rahimi, A. Ahmadikhah and B. Vaezi. 2010. Study on the effects of foliar spray of micronutrient on yield and yield components of durum wheat. Appl. Sci. Res., 2(6): 168-176.
Nelson, D.W. and L. Sommers. 1982. Total carbon, organic carbon, and organic matter 1. Methods of soil analysis. Part 2. Chem. Microbiol. Prop. (methodsofsoilan2). 539-579.
Nouet, C., P. Motte and M. Hanikenne. 2011. Chloroplastic and mitochondrial metal homeostasis. Trends in Plant Sci., 16(7): 395-404. https://doi.org/10.1016/j.tplants.2011.03.005
Nowack, B., I. Schwyzer and R. Schulin. 2008. Uptake of Zn and Fe by wheat (Triticum aestivum var. Greina) and transfer to the grains in the presence of chelating agents (ethylenediaminedisuccinic acid and ethylenediaminetetraacetic acid). J. Agric. Food Chem., 56(12): 4643-4649. https://doi.org/10.1021/jf800041b
Rawashdeh, H. and F. Sala. 2014. Influence of iron foliar fertilization on some growth and physiological parameters of wheat at two growth stages. Rom. Sci. Papers Ser. Agron., 57: 306-309.
Reddy, S.R. 2004. Principles of crop production- growth regulators and growth analysis, 2nd edition, Kalyani Publishers, Ludhiana, India.
Rhoades, J.D. 1996. Salinity: Electrical conductivity and total dissolved solids. Methods Soil Anal. Part 3-Chem. Methods. (methodsofsoilan3). 417-435.
Rhodes, D. and A. Klug. 1993. Zinc fingers. Sci. Am., 268(2): 56-65. https://doi.org/10.1038/scientificamerican0293-56
Sarkar, D., B. Mandal and M.C. Kundu. 2007. Increasing use efficiency of boron fertilisers by rescheduling the time and methods of application for crops in India. Plant Soil., 301(1-2): 77-85. https://doi.org/10.1007/s11104-007-9423-1
Shi, R., Y. Zhang, X. Chen, Q. Sun, F. Zhang, V. Romheld and C. Zou. 2010. Influence of long-term nitrogen fertilization on micronutrient density in grain of winter wheat (Triticum aestivum L.). J. Cere. Sci., 51(1): 165-170. https://doi.org/10.1016/j.jcs.2009.11.008
Soltanpour, P.A. and A.P. Schwab. 1977. A new soil test for simultaneous extraction of macro- and micro-nutrients in alkaline soils. Comm. Soil Sci. Plant Anal., 8(3): 195-207. https://doi.org/10.1080/00103627709366714
Vallee, B.L. and K.H. Falchuk. 1993. The biochemical basis of zinc physiology. Physiol. Rev., 73(1): 79-118. https://doi.org/10.1152/physrev.1993.73.1.79
Velu, G., I. Ortiz-Monasterio, R.P. Singh and T. Payne. 2011. Variation for grain micronutrients concentration in wheat core-collection accessions of diverse origin. Asian J. Crop Sci., 3: 43-48. https://doi.org/10.3923/ajcs.2011.43.48
Yruela, I. 2013. Transition metals in plant photosynthesis. Metallom., 5(9): 1090-1109. https://doi.org/10.1039/c3mt00086a
Zain, M., I. Khan, R.W.K. Qadri, U. Ashraf, S. Hussain, S. Minhas and M. Bashir. 2015. Foliar application of micronutrients enhances wheat growth, yield and related attributes. Am. J. Plant Sci., 6(7): 864. https://doi.org/10.4236/ajps.2015.67094


