
Perceptions Vulnerability Index: A Measure of Land Degradation Process in Northern Irrigated Plains of Pakistan


Research Article
Perceptions Vulnerability Index: A Measure of Land Degradation
Process in Northern Irrigated Plains of Pakistan
Muhammad Israr1*, Saeed Ullah1, Shakeel Ahmad2, Asif Yaseen3, Urooba Pervaiz4 and Nafees Ahmad5
1Department of Rural Development, AMKC, Mardan, The University of Agriculture, Peshawar; 2School of Environment, Tsinghua University, Beijing 100084, PR China; 3Department of Commerce, Bahauddin Zakariya University, Multan, Pakistan; 4Department of Agricultural Extension Education and Communication, The University of Agriculture, Peshawar, 5Department of Economics, University of Malakand, Chakdara, Dir Lower, Pakistan.
Abstract | Land Degradation (LD) is the most significant environmental issue in the present world and posing a challenge to the goals of future sustainability. The aims of this study was to measure the agriculture land degradation process in northern irrigated plains of Pakistan by studying the perceptions of the farmers about the different dimensions of agriculture LD with the construction of LD index. For achieving this primary data was collected by proportionate random sampling techniques form 90 sampled farmers through face to face interview survey method by filling a questionnaire. Farmer’s perceptions on agriculture LD were measured through the extent of severity scale in terms of LD dimensions and indicators resulted from water, tillage, soil, salinization, and overgrazing. Moderate (0.49) index of water degradation and the changing climatological index were light but the reduction of drainage density of water runoff and slope gradient reduction of soil index was severe. The tillage degradation index value moderate (0.57), overgrazing index (0.32) fall in the severity scale category. Soil structure degradation index was moderate (0.44) followed by salinization degradation of moderate (0.53) index value. The study concludes that the LD existed in the area in all the dimensions and its sub-indicators having different value severity on the measuring scale, which may be overcome by taking different sector-specific adaptive and preventive measures at the farm, institutional and policy level.
Received | April 25,2018; Accepted |October 28, 2018; Published | November 23, 2018
*Correspondence | Muhammad Israr, Department of Rural Development, AMKC, Mardan; Email: misrar@aup.edu.pk
Citation | Israr, M., S. Ullah, S. Ahmad, A. Yaseen, U. Dawood and N. Ahmad. 2018. Perceptions vulnerability index: A measure of land degradation process in northern irrigated plains of Pakistan. Sarhad Journal of Agriculture, 34(4): 840-849.
DOI | http://dx.doi.org/10.17582/journal.sja/2018/34.4.840.849
Keywords | Index of land degradation, Dimensions of degradation, Farmer’s perceptions, Agriculture land degradation, Land degradation
Introduction
Land Degradation (LD) is among the most genuine agro-ecological and environmental issues at the world, regional, and local levels (Kosmas et al., 2015). LD is the result of complex connections between socio-economic and biophysical issues which influence a lot of people and their land (Utuk and Daniel, 2015) as a result of this negative changes in the synthetic, physical, and natural properties of land (Nabiebakye, 2015). These requirements would not be met reasonably unless to protect and reestablish the efficiency of land for the future sustainability of the world and humanity and to meet the goals of sustainable development by 2030. The findings of Mussa et al. (2016) pointed that sustainable livelihoods and human well-being are totally subject to health and land productivity as it is an important resource for food production and ecosystem services, and the natural capital asset for the sustainability of the future.
Land is non-renewable resource by debasing it making harm to the ecosystem and fundamental resource by changing the nature of the land, permanent or temporary and making an unevenness to the ecosystem (Barman et al., 2013). Continued LD throughout the coming 30 years could decrease the production of food globally when changing in patterns consumption are relied upon to rise in demand of food significantly and demand for energy, water and food are likely to increase by 50%, 45% and 30%, at least respectively (Alexandratos and Bruinsma, 2012). Among the world the continent of Asia has highly affected and followed by Africa whereas the Europe is the least affected and about 2.6 billion people are affected by LD in more than 100 countries and resulted from the natural (earth quakes, tsunamis, droughts, avalanche, landslides, mud flow, volcanic eruptions, flood tornado and wild fire) and human (land clearance, deforestation, overgrazing by livestock, in appropriate irrigation and over drafting, urban sprawl and commercial development and pollution from industries, quarrying, and mining activities) causes (Kohler, 2015). This will result in the reduction of land productivity, migration of the people, damage to basic resources and ecosystems, food insecurity and loss of biodiversity in special reference to fisheries and aquaculture.
The quality of water using for the irrigation is more important and high salinity prompts desertification followed by the development of crack throughout the irrigation might not properly, can allow U-shaped trace and after drying these breaks can grow, will cause soil shrinkage. Water degradation is the main cause of LD (Adimassu et al., 2014). Loss of vegetation (Zhang et al., 2011), reduced the drainage density of water runoff (Li et al., 2017); reduced the slope gradient (Taye et al., 2013), reduced runoff water storage (Moeini et al., 2015), increased climate change risk (Webb et al., 2017); (Blaikie and Brookfield, 2015) and increased land fragmentation (Alemu et al., 2017; Wadduwage et al., 2017).
Tillage degradation is also an important dimension of LD and is attributed to the soil displacement caused by the tillage implements. Important indicators of this type of erosion are reduction in organic matter content of soil (Busari et al., 2015), reduction in slope gradient of soil (Haregeweyn et al., 2017), cultivation, and reducing in terracing for land management practices (Shao and Baffaut, 2012) and destroy soil structure (Sharifi et al., 2017).
LD caused by overgrazing is a worldwide problem (Stavi et al., 2016) as overgrazing adversely affects soil properties (Kosmas et al., 2016), causes reduced infiltration (Kosmas et al., 2015), accelerated runoff (Riva et al., 2017) declined soil nutrient quality (Rosales and Livinets, 2005), reduced drainage density of water runoff (Bedunah and Angerer, 2012) and increased desertification (Mussa et al., 2016). This will result in soil infiltration, accelerated runoff and soil erosion and reduction of microorganism action (Zika and Erb, 2009).
Soil structure degradation has been a typical worldwide environmental issue, fundamentally warning the sustainable development of society and economy. The LD by soil degradation is documented by many studies in the world and its important indicators are removal of the topsoil (Schwaab et al., 2017; Corstanje et al., 2017) exposure of the subsoil (Lariu, 2015), color change of soil (Weil et al., 2016), problems of ploughing (Thierfelder and Wall, 2015; Günal et al., 2015) and low moisture retaining capacity (Hovi, 2017).
Salinization is created by the low aggression of soluble salts, whatever their temperament, in soil or on the dirt surface and are firmly identified with surface water and groundwater stream processes and consequently having influenced the growth of plant, production of crop, soil and water quality, promoting soil erosion and desertification. Soils in various countries are especially influenced by salinization because of the semi-arid to arid climate and the advancement of intensive irrigation for farming through the development of various systems of storage and distribution (Montoroi et al., 2006). Groundwater exploitation (Besser et al., 2017), increased climate change effect (Dalezios, 2017), soil water storage capacity decreased (Li et al., 2017), leads to high water scarcity (Dalezios, 2017) increased irrigation water consumption (Virto et al., 2014).
From the aforementioned mentioned discussion, it is cleared that LD is taking place in all agro-ecological zones of the world and regions and hence having a long-lasting effect on environmental, socioeconomic and social vulnerability. Therefore, this study was designed with the overall objective to study the LD process at social vulnerability context at the regional level because this is necessary to have local and global policies and regulations to control the land degradation and meets the needs of future sustainability. Specific objectives were to measure the perceptions of the farmers about the different dimensions of the agriculture land degradation by developing a methodology for measuring it and its extent.
Hypothesis
Tillage erosion positively related to slope gradient.Overgrazing is the moderate cause of land degradation, while water and salinization degradation are severe.
Materials and Methods
Agro-ecological zone of Northern irrigated plain of Pakistan was the area for this research. The total area of Pakistan is 79.6 Million hectares and the cultivated territory is around 27% and out of this 27-80% area is irrigated and lies between latitudes 24-37 N and longitudes 61-76 E. Agro-ecological zone of northern irrigated plain incorporates Bahawalnagar, Rahimyar Khan, Multan, Vehari, Sahiwal, Lahore, Faisalabad, Jhang, Chiniot, Gujranwala, Sargodha, Gujrat, Peshawar and Mardan (GoP, 2014). Precipitation runs between (125-500mm) and, soil sort topsoil, topsoil earth and sandy. The atmosphere is semi parched to dry. The primary crops are cotton, sugarcane, maize, and wheat and Barseem. Among the included districts of agro-ecological zone four Union Council (UCs) i.e. Toru (UC-I), Lundkhwar (UC-II), Gharhi Kapoora (UC-III) and Katlang-1(UC-IV) of Mardan district, Khyber Pakhtunkhwa was selected as a research area for this study (Figure 1). The Mardan district population has increased with a soaring pace with average annual development rate of 3.0 and among the population 79.8 percent living in rural areas (GoP, 2014). It is extraordinary agriculture areas because of its suitability for food cultivation and cash crop in central Pakhtunkhwa followed by livestock rearing and fruits and vegetable farming. The climate of Mardan is warm and summer season is quite hot followed by an abrupt rise of temperature observed from May to June. Even July, August and September record quite high temperatures. Mostly precipitation occurs in the month of July, August, December and January. Purposive and proportionate random sampling was employed to obtain the sample for register farmers with the Agriculture Extensions Department Mardan (2017). The total numbers of register farmers in the selected UCs were 857and the different selected UCs having a different number of register farmers were purposively included in the study (based on their size of land holding and physiographic and geography of land). Proportionate random sampling was employed to obtain representative farmers for the sample size by the use of (Ryan, 2013) formula of sample size. In the Ryan formula “N” is the size of the population and the marginal error “e” denotes the allowed probability of committing an error in selecting a small representative of the population. The sample size “n” can be determined by the following formula.

Where; n= number of sampled registered farmers in all UCs, N= number of total register farmers, and “e” =standard confidence level is 90% - 95%. Based on Rayn formula, and at the 90% confidence level, the study sampled a total of 90 register farmers and considered representative of the 857 in the selected UCs. To ensure that the number of sampled farmers in a particular UCs is proportional to the total number of register farmers in that UC, a proportionate stratified random sampling was applied and the number of sampled farmers in UC-I, II, III, and IV was 21, 42, 15 and 12 respectively. Data was collected for the samples respondents through face to face interview by filling a questionnaire through survey methods. In the literature different methods like remote sensing were applied to identify the degradation like deforestation, land clearing and changes in the land use and land cover. The quality of field survey is in distinguishing attributes that may not be quickly obvious utilizing satellite sensors, for example, changes in forest productivity through particular logging, salinization, erosion, and depletion of nutrient lead to a decline in crop yields (Anderson and Johnson, 2016).
Farmer’s perceptions index construction on agriculture land degradation
Farmer’s perceptions on agriculture land degradation were measured in terms of degradation dimensions caused by water, tillage, soil, salinization, and overgrazing having different sub-indicators. The value of the index ranges from 0-1, means a complete and no degradation respectively. To make more sense in the findings, this study used an extent of a severity scale for the description of the degradation of land index by water i.e. 0-0.20 (very severe), 0.21-0.40 (severe), 0.41-0.60 (moderate), 0.61-0.80 (light) and 0.81-1 (no) degradations. The following specific methodology was used for aforementioned different land degradation indicators, used by different researcher like (Adeniyi et al., 2017, Sione et al., 2017; Baumhardt at el., 2015; Beniston et al., 2015) in different parts of the world.
Water degradation index
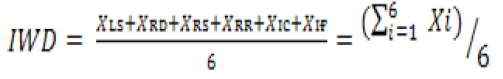
To measure the farmer’s perception on water degradation, six indicators mentioned by the different researcher (Schwaab et al., 2017; Corstanje et al., 2017) were used for this dimension by constructing the following formula.
 ...(1)
Where; IWD = Index of water degradation; XLS = Loss of vegetation (1 if yes, otherwise 0); XRD = Reduced the drainage density of water runoff (1 if yes, otherwise 0); XRS = Reduced the slope gradient (1 if yes, otherwise 0); XRR = Reduced runoff water storage (1 if yes, otherwise 0); XIC = Increase climate change (1 if yes, otherwise 0); XIF = Increase land fragmentation (1 if yes, otherwise 0)
Tillage degradation index
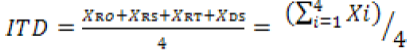
Farmer’s perception on tillage degradation of land was measured by taking the following four indicators.
 ...(2)
Where; ITD = Index of tillage degradation; XRO = Reducing organic matter content of soil (1 if yes, otherwise 0); XRS = Reduced slope gradient of soil (1 if yes, otherwise 0); XRT = Reducing terracing for land management practice (1 if yes, otherwise 0); XDS = Destroy soil structure (1 if yes, otherwise 0).
Overgrazing degradation index
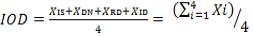
Overgrazing land degradation was measured by using the four indicators reported by the different researcher like Kohler (2015) for this dimension.
 ... (3)
Where; IOD = Index of overgrazing degradation; XIS = Increase in the possibility of soil erosion (1 if yes, otherwise 0); XDN = Decline soil nutrient quality (1 if yes, otherwise 0); XRD = Reduced drainage density of water runoff (1 if yes, otherwise 0); XID = Increase desertification problem (1 if yes, otherwise 0).
Soil structure degradation index
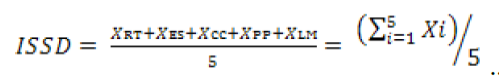
Perception on soil degradation of the farmers was measured by the use of the following five indicators.
 ... (4)
Where; ISSD = Index of soil structure degradation; XRT = Removal of the topsoil (1 if reported yes, otherwise 0); XES = Exposure of the subsoil (1 if reported yes, otherwise 0); XCC = Color change (1 if reported yes, otherwise 0); XPP = Problems of ploughing (1 if reported yes, otherwise 0); XLM = Low moisture retaining capacity (1 if reported yes, otherwise 0).
Salinization degradation index
To measure the framers preception on salinization, five indicators reported in the literature used for this dimension and were measured by the following for mula.
 ...(5)
Where; ISD = Index of salinization degradation; XGW = Groundwater exploitation (1 if reported yes, otherwise 0); XIC = Increase in climate change (1 if reported yes, otherwise 0); XSW = Soil water storage capacity decrease (1 if reported yes, otherwise 0); XHS = High water scarcity (1 if reported yes, otherwise 0); XWC = increase water consumption (1 if reported yes, otherwise 0).
Overall land degradation index
Overall land degradation index was calculated by summing the degradation by water, tillage, soil, salinization and overgrazing by using the following equation.
 ...(6)
Where; OLD= Over all land degradation index; XIWD = Index of water degradation; XITD = Index of tillage degradation; XIOD = Index of overgrazing degradation; XISSD = Index of soil structure degradation; XISD = Index of salinization degradation.
Results and Discussion
Water degradation index
Land degradation is a long-term damage to the productivity and function of ecosystem affected by disturbances from which the land cannot recover unaided and happens gradually and in total and has durable effects on rural people who become increasing vulnerable (Bai et al., 2008). Water degradation of the land is also one of the important dimensions of land degradation. In this study, this was measured by the index constructed at Equation 1. The indicators of this index includes loss of vegetation on the surface (LS) of the land, reducing of drainage (RD) density of water runoff, reduction of slope (RS) gradient of soil, reduction of runoff (RR) water storage, increased in land fragmentation (IF) and increased in the trends of the climatological (IC) variables (Figure 2). The figure is based on a value of 0-1. The figure revealed that there was moderate (0.49) water land degradation and was comparatively high in UC-III and UC-IV. Among the different indicators changing climatological trends having light degradation index, while the land degradation result from reduction of drainage density of water runoff and reduction of slope gradient of soil index was sever. The land of UC I and II were severely degraded as mentioned by the values of the index. The indicator of loss of vegetation, reduction in runoff water storage and increased land fragmentation were moderately responsible indicators for the land degradation. This implies that in the water degradation index of land the reduction of drainage density of the water runoff and the slope gradient of soil is the very important inductors contributing severely to the land degradation.
Tillage degradation index
The adoption of improper agronomic practices i.e. center contouring tillage, fallow areas, lack of soil conservation practices leads to land degradation. Tillage is a tool which is used to interrupts soil and help soil in the oxidation organic matter (Franzluebbers et al., 2014) and also the long run drought produces a decrease in surface vegetation cover as a result of the natural process or enhanced by tillage practices due to which the soil become vulnerable to wind and water erosion and hence there is the degradation of land (Al-Kaisi and Guzman, 2013; Biazin and Sterk, 2013). This dimension of the land degradation was calculated by using Equation 2. Tillage degradation index of land degradation dimension was calculated by using the four indicators i.e. reduction of organic (RO) matter of soil, reduction of slope (RS) gradient of soil, reducing terracing (RT) for land management practices and destroying of soil structure (DS) (Figure 3). The value (0.57) of the index pointed that this dimension was moderately responsible for the degradation of land and was almost equal on the average basis among the different selected UCs. In the different indicators of this dimension reduction in the gradient of soil and destroying the soil structure were having a moderate value of degradation index while reducing the terracing for the land management practices and reduction of the organic matter content of the soil having a light index value of degradation.
Overgrazing degradation index
Overgrazing results deforestation, loss of natural vegetation covers and hence is a great threat to the biodiversity and natural ecosystem. In addition to the above, this dimension and its indicators contributed to the land degradation in the research area. Equation 3 was used to calculate the values of this index. This dimension comprises of sub-indicators i.e. increased in the possibility of soil (IS) erosion, decline in soil nutrients (DN) quality, reduction in drainage density (RD) of the water runoff and increased problem of desertification (ID) (Figure 4). The calculated index value (0.32) suggests that the due to this dimension there was a severe degradation of land and this was more in UC-III among the different selected UCs. This may be due to the large numbers of grazing animals rearing in the area which are not supported by the natural vegetation process. The index (0.16) further explained that the problem of reduced drainage density of water runoff was very severe and were comparatively more in UC-II and III than the others. Furthermore, the possibility of soil erosion and decline in the soil nutrients quality were severe in the area as depicted by the index values i.e.0.29 and 0.36 respectively. The problem of increased desertification at the field was moderate (0.48), according to the value of the index classification, while was severe in UC-III of the research area.
Soil structure degradation index
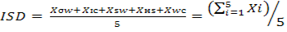
Structure of soil is the vital property that influences all degradation procedures and variables decide this sort of degradation processes are land quality as influenced by its intrinsic properties of climate, landscape position and terrain, soil biodiversity and vegetation (Allen, 2014). To calculate this dimension of land degradation Equation 4 of the research methodology were used. The indicators used for this dimensions were the removal of topsoil (RT), exposure of subsoil (EX), change of soil color (CC), ploughing problems (PP) and the problem of low moisture (LM) retaining capacity. In the area the overall soil structure index pointed that problem is moderate (0.44) and almost same in all UCs of the selected research area (Figure 5). There was severe (0.28) removal of topsoil and was near to very severe in UCs I and III. This implies that this dimension of land degradation is existed in the area, and farmers observed it in their field or farm level.
Salinization degradation index
Land degradation also includes salinization of soil if farmers over-irrigate the land. The primary causes of salinization are unnecessary irrigation through inadequately developed and kept up irrigation systems coupled by the seepage frameworks which neglects to deplete off the excess salts and water, because of their improper development and maintenance (ADB, 2007). Soil salinization, is the procedure of solvent salt collection, is of awesome worry on ranches on the grounds that it straightforwardly impacts plant development and yield decrease by expanding osmotic weight of soil dampness causing physiological dry spell, and by implication by causing crumbling of soil medium. The salinization degradation index of land was calculated by using Equation 5 of the research methodology (Figure 6). Based on literature five indicators namely the use of more groundwater (GW), increased climate change (IC), decrease of water storage (SW) capacity of soil, higher water scarcity (HS) and the increased water consumption (WC) was used to calculate this index. The index value 0.53 pointed that there was moderate land degradation due to the salinization problem and the same amongst all the selected UCs of the research area. Across the different indicators of this dimension of degradation its index value falls within the range of moderate category.
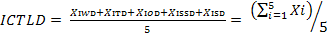
Result of the overall land degradation index
Land is fundamental to the nexus that connects food, water, energy and environmental health and it is estimated that by 2030, the demand for food, water and energy is likely to rise by at least 30%, 45% and 50%, respectively (IFPRI, 2013) and these needs will not have met sustainably unless to save and reestablish the land productivity. This situation threatens the process of sustainable development in various parts of the globe as land degradation is regularly associated with land use practices as a result of the human activities and permanent or temporary decrease of the land productivity. Nkonya et al. (2011) reported that the direct causes of land degradation include biophysical causes like (soil erosion hazard, topography, rainfall, wind, climatic conditions, temperature, and overgrazing) and unsustainable land management practices like (forest degradation, deforestation, cultivation on steep slopes and soil nutrient mining). The recent literature on the land degradation pointed that it is a great threat to the communities that totally depended on land as their fundamental resource, particularly the rural poor, human well-being and economical are completely reliant upon and complicatedly connected to the wellbeing and land productivity (TST, 2014). The total land degradation index was calculated by using equation 6 of the research methodology (Figure 7) and this includes the water (IWD), tillage (ITD), soil structure (IOD), and overgrazing (ISSD) and salinization (ISD) degradation dimension. Results of the index pointed that land degraded by the dimension of overgrazing was severe (0.32), followed by the soil structure dimension of the land degradation. In the rest of the three dimensions i.e. water, tillage, salinization the index value pointed that there was moderate land degradation. From the above findings it was clear about the hypothesis that water and salinization are the two major severe causes of land degradation proved false and hence these are moderately responsible for the land degradation. This also provides a guideline for the sustainable management of land practices, because sooner or later this moderate degradation will be converted in to severe. The hypothesis that overgrazing land degradation in the area was more severe was true as clear from the calculation of land degradation index.
Conclusions and Recommendations
Land Degradation (LD) is among the most challenges issue in the world as it is non-renewable resource. Looking in to the importance of this resources the LD in the perceptions of the farmers was measures in five dimensions i.e. water, tillage, soil, salinization and overgrazing and its sub-indicators by constructing an index of vulnerability ranges from 0-1. The value of the index pointed that the LD existed in each dimensions having different range i.e. started from severe to moderate. LD by the dimension of overgrazing and soil structure was severe, while moderate LD was noted from the index value in the dimensions of water, tillage and salinization. The study recommends for further research in other areas of the same topographic situation and also this can be overcome by different sector-specific preventive and adaptive measures by the farmers, institutions and policymakers.
Author’s Contribution
Muhammad Israr: Conceived the idea and designed/ supervised the overall research.
Saeed Ullah: Did literature review and collected data.
Shakeel Ahmad: Helped in designing and formatting the figures.
Asif Yaseen and Urooba Pervaiz: Helped in the proof reading.
Nafees Ahmad: Helped in the data analysis and writing the manuscript.
Referances
Adeniyi, S. A., W. P. De Clercq and A. Van. Niekerk. 2017. Development of a composite soil degradation assessment index for cocoa agro ecosystems in southwestern Nigeria. Solid Earth. 8, 827–843, https://doi.org/10.5194/se-8-827-2017.
Alemu, G.T., Z. B. Ayele and A. Berhanu. 2017. Effects of land fragmentation on productivity in Northwestern Ethiopia. Advances in Agriculture, vol. 2017, Article ID 4509605, 9 pages, https://doi.org/10.1155/2017/4509605.
Anderson, W., and T. Johnson. 2016. Evaluating global land degradation using ground-based measurements and remote sensing. p. 85-116. In: E. Nkonya et al. (eds.), Economics of land degradation and improvement–A global assessment for sustainable development. New York, USA. https://doi.org/10.1007/978-3-319-19168-3_5
Adimassu, Z., K. Mekonnen, C. Yirga and A. Kessler. 2014. Effect of soil bunds on runoff, soil and nutrient losses, and crop yield in the central highlands of Ethiopia. Land Degrad & Dev. 25(6), 554-564. https://doi.org/10.1002/ldr.2182
Allen, H. 2014. Mediterranean ecogeography. Routledge. London.
Al-Kaisi, M.M., and J. Guzman. 2013. Effects of tillage and nitrogen rate on decomposition of transgenic Bt and near-isogenic non-Bt maize residue. J. Soil and Till. Res. 129: 32-39. https://doi.org/10.1016/j.still.2013.01.004
ADB (Asian Development Bank). 2007. Annual Report. Manila, Philippines.
Besser, H., N. Mokadem, B. Redhouania, N. Rhimi, F. Khlifi, Y. Ayadi, A. Bouajila and Y. Hamed. 2017. GIS-based evaluation of groundwater quality and estimation of soil salinization and land degradation risks in an arid Mediterranean site (SW Tunisia). Arab J Geosci, 10(16), 350. https://doi.org/10.1007/s12517-017-3148-0
Blaikie, P., and H. Brookfield. 2015. Land degradation and society, Routledge. London. https://doi.org/10.4324/9781315685366
Busari, M.A., S.S. Kukal, A. Kaur, R. Bhatt and A.A. Dulazi. 2015. Conservation tillage impacts on soil, crop and the environment. Int. Soi. Wat. Cons. Res. 3(2), 119-129. https://doi.org/10.1016/j.iswcr.2015.05.002
Baumhardt, R. L., B. A. Stewart and U. M. Sainju. 2015. North American soil degradation: Processes, practices, and mitigating strategies. Sustainability. 7(3), 2936–2960. https://doi.org/10.3390/su7032936
Beniston, J. W., R. Lal and K. L. Mercer. 2015. Assessing and managing soil quality for urban agriculture in a degraded vacant lot soil. Land Degrad & Dev. 27(4), 996-1006. https://doi.org/10.1002/ldr.2342
Biazin, B., and G. Sterk. 2013. Drought vulnerability drives land-use and land cover changes in the Rift Valley dry lands of Ethiopia. Agric. Ecosyst. Environ., 164, 100-113. https://doi.org/10.1016/j.agee.2012.09.012
Bedunah, D.J., and J.P. Angerer. 2012. Rangeland degradation, poverty, and conflict: how can rangeland scientists contribute to effective responses and solutions? Rangeland Ecol Manag. 65(6), 606-612. https://doi.org/10.2111/REM-D-11-00155.1
Corstanje, R., T.G. Mercer, J.R. Rickson, L.K. Deeks, P.N. Price, I. Holman, C. Kechavarsi and T.W. Waine. 2017. Physical soil quality indicators for monitoring British soils. J. Sol. Ear. 8(5), 1003-1016. https://doi.org/10.5194/se-8-1003-2017
Franzluebbers, A.J., J. Sawchik and M.A. Taboada. 2014. Agronomic and environmental impacts of pasture–crop rotations in temperate North and South America. Agric. Ecosyst. Environ, 190, 18-26. https://doi.org/10.1016/j.agee.2013.09.017
Günal, H., T. Korucu, M. Birkas, E. Özgöz and R.H.C. Zamfir. 2015. Threats to sustainability of soil functions in Central and Southeast Europe. Sustainability. 7(2), 2161-2188. https://doi.org/10.3390/su7022161
Haregeweyn, N., A. Tsunekawa, J. Poesen, M. Tsubo, D.T. Meshesha, A.A. Fenta, J. Nyssen and E. Adgo. 2017. Comprehensive assessment of soil erosion risk for better land use planning in river basins: Case study of the Upper Blue Nile River. Sci Total Environ. 574, 95-108. https://doi.org/10.1016/j.scitotenv.2016.09.019
IFPRI (International Food Policy Research Institute). 2013. IFPRI Strategy 2013–2018: Food policy research in a time of unprecedented challenges. Washington, D.C.
Kosmas, C., M. Karamesouti, K. Kounalaki, V. Detsis, P. Vassiliou and L. Salvati. 2016. Land degradation and long-term changes in agro-pastoral systems: An empirical analysis of ecological resilience in Asteroussia-Crete (Greece). Catena, 147, 196-204. https://doi.org/10.1016/j.catena.2016.07.018
Kosmas, C., V. Detsis, M. Karamesouti, K. Kounalaki, P. Vassiliou and L. Salvati. 2015. Exploring long-term impact of grazing management on land degradation in the socio-ecological system of Asteroussia Mountains, Greece. Land, 4(3), 541-559. https://doi.org/10.3390/land4030541
Li, J., J. Han, C. Chen and J. Yang. 2017. Characteristics of soil stability and carbon sequestration under water storage and drainage model. IOP Conference Series: Earth and Environmental Science, IOP Publishing, vol.77, 012009. https://doi.org/10.1088/1755-1315/77/1/012009
Mussa, M., H. Hashim and M. Teha. 2016. Rangeland degradation: Extent, impacts, and alternative restoration techniques in the rangelands of Ethiopia. Tropical and subtropical agroecosystems, 19(3).
Moeini, A., N. Zarandi, E. Pazira and Y. Badiollahi. 2015. The relationship between drainage density and soil erosion rate: a study of five watersheds in Ardebil Province, Iran. WIT Trans. on Eco. and Envir. Sci., 197, 129-138.
Montoroi, J. P., O. Grünberger, S. Sukchan and N. Kungklang. 2006. Self potential method applied to salt affected soils of Thailand. Geophysical Research Abstracts. Vol. 8, No. 10193.
Nabiebakye, N. 2015. Managing Land Degradation For Food Security In The Lawra District. Phd diss., Lawra District, Ghana.
Nkonya, E., N. Gerber, P. Baumgartner, J. von Braun, A. de Pinto, V. Graw, E. Kato, J. Kloos and T. Walter. 2011. The economics of land degradation. Towards an integrated global assessment. Development economics and policy, Band 66. Peter Lang.
Riva, M.J., I.N. Daliakopoulos, S. Eckert, E. Hodel and H. Liniger. 2017. Assessment of land degradation in Mediterranean forests and grazing lands using a landscape unit approach and the normalized difference vegetation index. Appl. Geogr, 86, 8-21. https://doi.org/10.1016/j.apgeog.2017.06.017
Ryan, TP. 2013. Sample size determination and power. John Wiley and Sons. https://doi.org/10.1002/9781118439241
Schwaab, J., K. Deb, E. Goodman, S. Lautenbach, M.V. Strien and A. Regamey. 2017. Reducing the loss of agricultural productivity due to compact urban development in municipalities of Switzerland. Comput. Envir. and Urban Syst. 65, 162-177. https://doi.org/10.1016/j.compenvurbsys.2017.06.005
Sharifi, Z., N. Azadi and G. Certini. 2017. Fire and tillage as degrading factors of soil structure in Northern Zagros Oak forest, West Iran. Land Degrad & Dev. 28(3),1068-1077. https://doi.org/10.1002/ldr.2649
Sione, S. M. J., M. G. Wilson, M. Lado and A. P. Gonzalez. 2017. Evaluation of soil degradation produced by rice crop systems in a Vertisol, using a soil quality index, Catena, 150, 79–86. https://doi.org/10.1016/j.catena.2016.11.011
Stavi, I., G. Bel and E. Zaady. 2016. Soil functions and ecosystem services in conventional, conservation, and integrated agricultural systems. A review. Agron Sustain Dev, 36(2), 32. https://doi.org/10.1007/s13593-016-0368-8
Thierfelder, C., and P. C. Wall. 2015. The problem of soil and land degradation. 2 p. Harare (Zimbabwe). CIMMYT. Series: Technical bulletin.
TST (Technical Support Team). 2014. TST Issue Brief: Conflict prevention, post-conflict peace building and the Promotion of Durable Peace, Rule of Law and Governance. UNDESA.
Taye, G., J. Poesen, B.V. Wesemael, M. Vanmaercke, D. Teka, J. Deckers, T. Goosse, W. Maetens, J. Nyssen and V. Hallet. 2013. Effects of land use, slope gradient, and soil and water conservation structures on runoff and soil loss in semi-arid Northern Ethiopia. Phys. Geogr. 34(3), 236-259. https://doi.org/10.1080/02723646.2013.832098
Virto, I., M.J. Imaz, O. Ugalde, N. Bengoetxea, A. Enrique and P. Bescansa. 2014. Soil degradation and soil quality in Western Europe: current situation and future perspectives. Sustainability, 7(1), 313-365. https://doi.org/10.3390/su7010313
Wadduwage, S., A. Millington, N.D. Crossman and H. Sandhu. 2017. Agricultural land fragmentation at urban fringes: An application of urban-to-rural gradient analysis in Adelaide. Land. 6(2), 28. https://doi.org/10.3390/land6020028
Webb, N.P., N.A. Marshall, L.C. Stringer, M.S. Reed, A. Chappell and J. E. Herrick. 2017. Land degradation and climate change: building climate resilience in agriculture. Front. Ecol. Environ. 15(8), 450-459. https://doi.org/10.1002/fee.1530
Weil, R.R. and N.C. Brady. 2016. The nature and properties of soils. Fifteenth edition. Columbus Pearson., ISBN 9780133254488 http://lccn.loc.gov/2016008568
Zhang, G.H., L. Bin, W. Liang and W. Xia. 2011. Effects of vegetation cover and rainfall intensity on sediment-bound nutrient loss, size composition and volume fractal dimension of sediment particles. Pedosphere. 21(5), 676-684. https://doi.org/10.1016/S1002-0160(15)60076-5
Zika, M., and K. H. Erb. 2009. The global loss of net primary production resulting from human-induced soil degradation in drylands. Ecol Econom, 69(2), 310-318. https://doi.org/10.1016/j.ecolecon.2009.06.014
To share on other social networks, click on any share button. What are these?


