
Optimizing Nitrogen Sources and Tillage Practices for Wheat Crop Stand and Phenology


Optimizing Nitrogen Sources and Tillage Practices for Wheat Crop Stand and Phenology
Arsalan Khan1, Aminullah Khan2, Dil Fayaz Khan2, Sajid Khan1, Anjum1, Waqar Ali3, Habib Akbar1 and Ahmad Khan1*

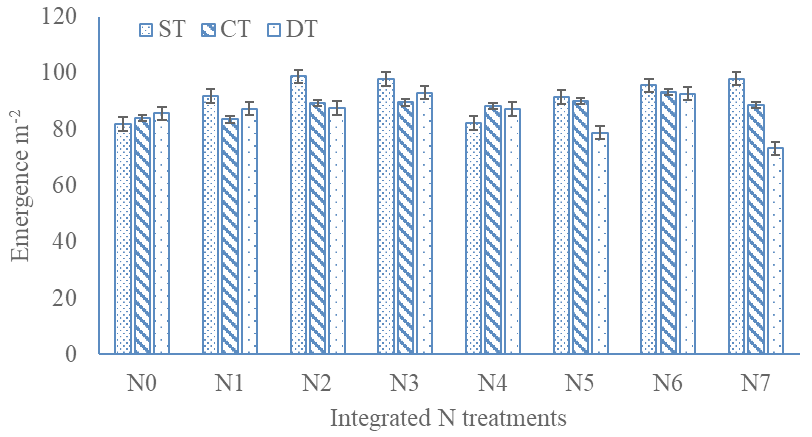
The interactive response for emergence m-2 of wheat in response to tillage system (ST: Shallow; CT: Conventional; DT: Deep tillage) and nitrogen treatments (N0: Control; N1: 100% N from Urea; N2: 100% N from FYM; N3: 100% N from PM; N4: 50% N from Urea + 50% N from FYM; N5: 50% N from Urea + 50% N from PM; N6: 50% N from FYM + 50% N from PM; N7: 33.33% from each). Vertical bars are standard error of means.

The interactive response for tiller m-2 of wheat in response to tillage system (ST: Shallow; CT: Conventional; DT: Deep tillage) and nitrogen treatments (N0: Control; N1: 100% N from Urea; N2: 100% N from FYM; N3: 100% N from PM; N4: 50% N from Urea + 50% N from FYM; N5: 50% N from Urea + 50% N from PM; N6: 50% N from FYM + 50% N from PM; N7: 33.33% from each). Vertical bars are standard error of means.


