

Optimization of Conditions for Maximal Production of Recombinant Thermostable Cellulase from Thermotoga naphthophila using E. coli BL21-CodonPlus (DE3) as Expression Host


Optimization of Conditions for Maximal Production of Recombinant Thermostable Cellulase from Thermotoga naphthophila using E. coli BL21-CodonPlus (DE3) as Expression Host
Aisha Khalid1, Muhammad Tayyab1,*, Abu Saeed Hashmi1, Tahir Yaqub2, Ali Raza Awan1, Muhammad Wasim1, Shagufta Saeed1, Sehrish Firyal1 and Abdul Rauf Shakoori3
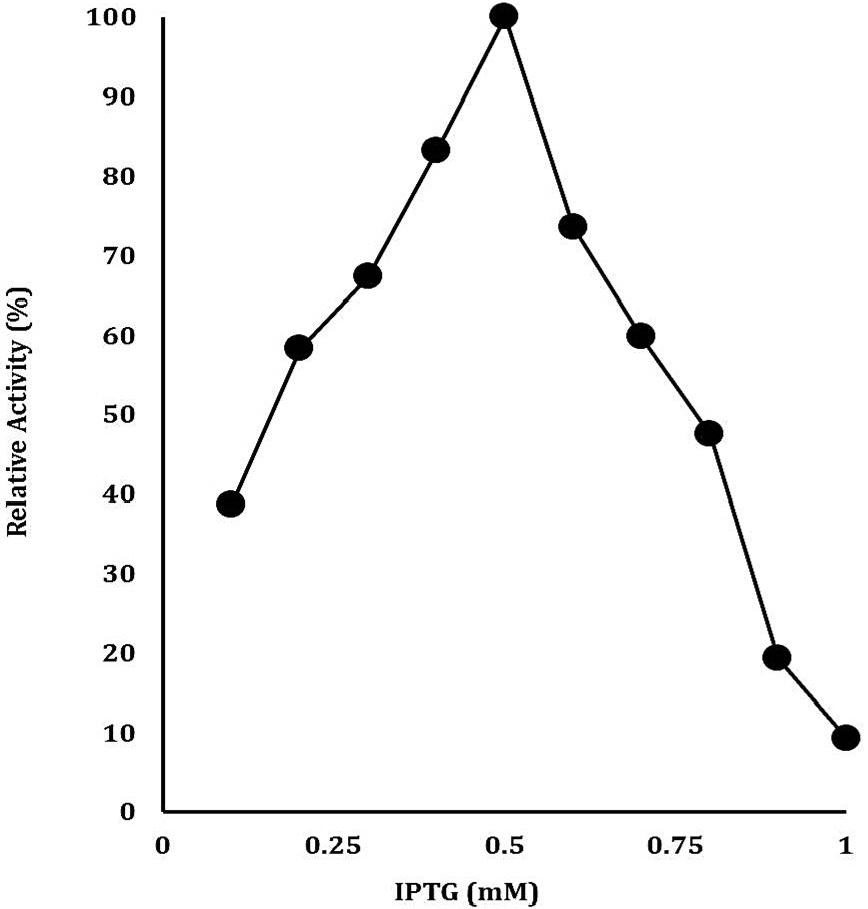
Optimization of IPTG concentration for the maximal production of recombinant cellulase. The data on X-axis shows the IPTG concentration (mM) whereas on Y-axis shows the relative activity (%).
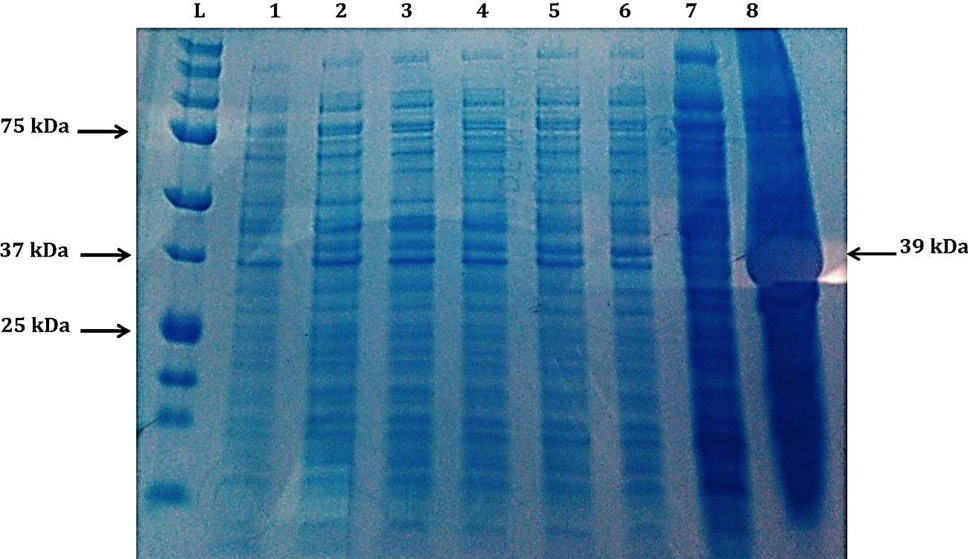
Coomassie Brilliant Blue R-250 Stained SDS-PAGE Gel Showing effect of incubation temperature on the production of recombinant cellulase (39 kDa): Lane L, protein ladder (Precision Plus Protein Ladder, Bio RAD, USA); Lane 1, soluble fraction after lysis of cells having pET28a without insert as negative control; Lane 2-6, Soluble part after lysis of cells having pET28a with cellulase gene with post induction period of 1–5 h at 37°C; Lane 7, soluble part after lysis of cells having pET28a with cellulase gene with post induction period of 22 h at 20°C; Lane 8, soluble part after lysis of cells having pET28a with cellulase gene with post induction period of 22 h at 25°C.
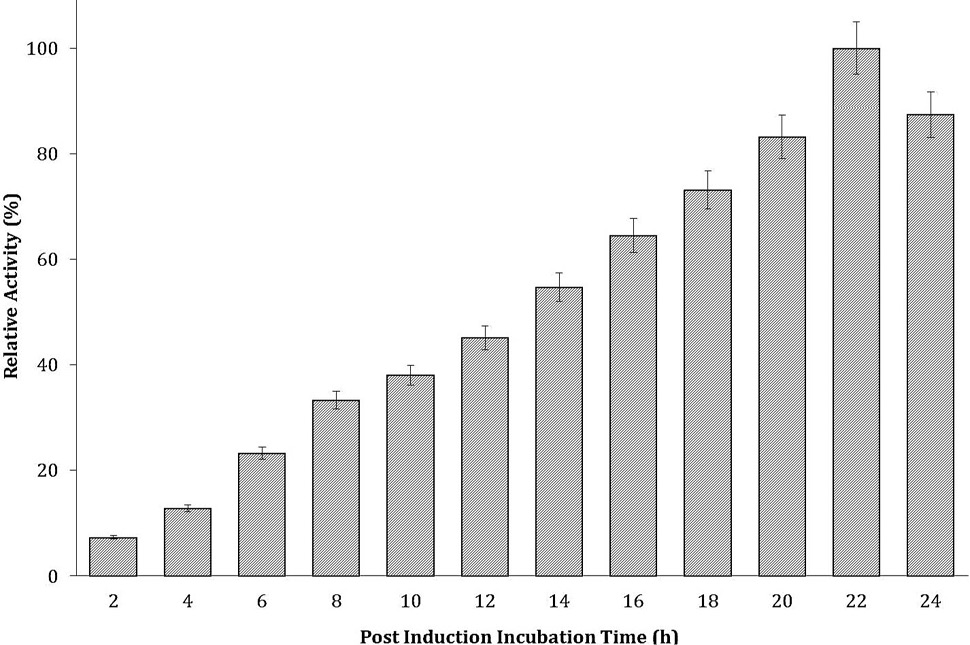
Effect of post induction incubation time on recombinant cellulase production. Experiment was conducted at 25°C. The data on X-axis shows the post induction incubation time (h) and Y-axis shows the relative activity (%).
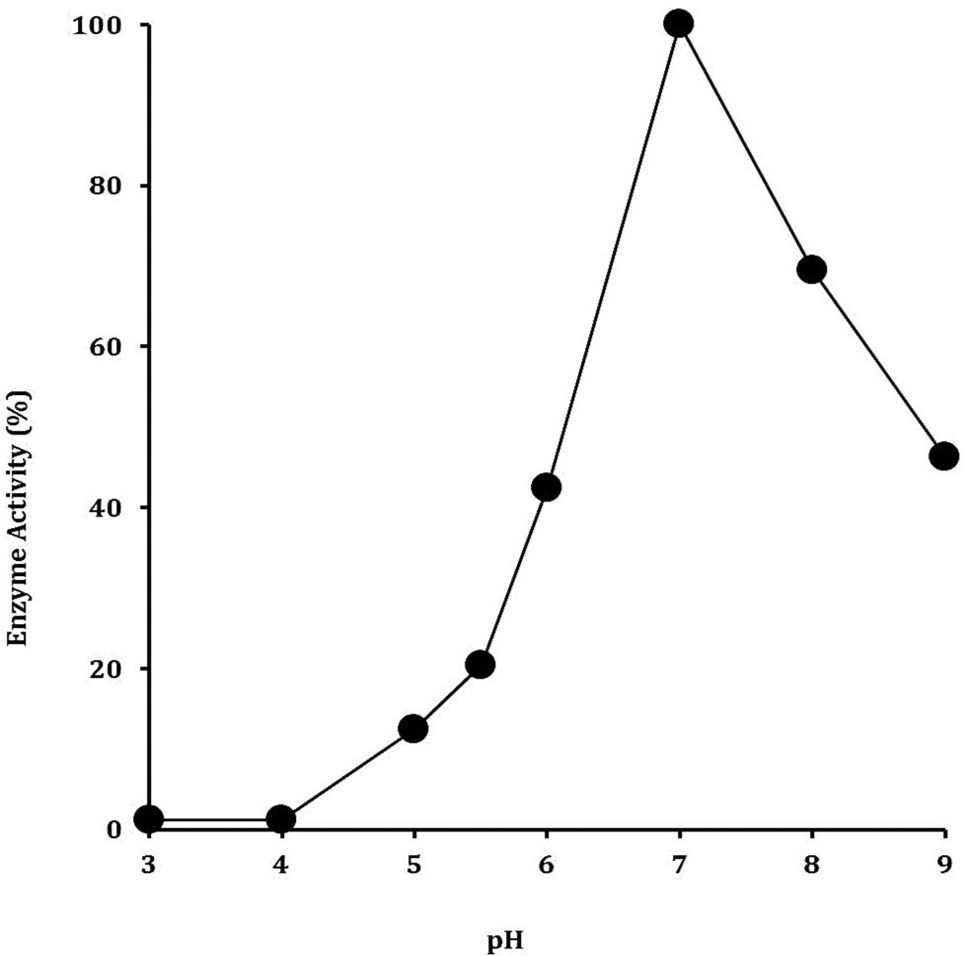
Optimization of pH for the maximal production of recombinant cellulase. The cellulase production was analyzed in 50 mM of each of sodium acetate buffer (3-5), sodium phosphate buffer (5-7) and Tris HCl buffer (7-9). The data on X-axis indicates the buffer pH values while on Y-axis show relative activity (%).


