

Mutation Profiling of PI3K/AKT1/MTOR Pathway Genes in Breast Cancer Patients of Pakistan


Mutation Profiling of PI3K/AKT1/MTOR Pathway Genes in Breast Cancer Patients of Pakistan
Muhammad Javed Iqbal1, Farah Rauf Shakoori1*, Bushra Muneer2 and Abdul Rauf Shakoori3
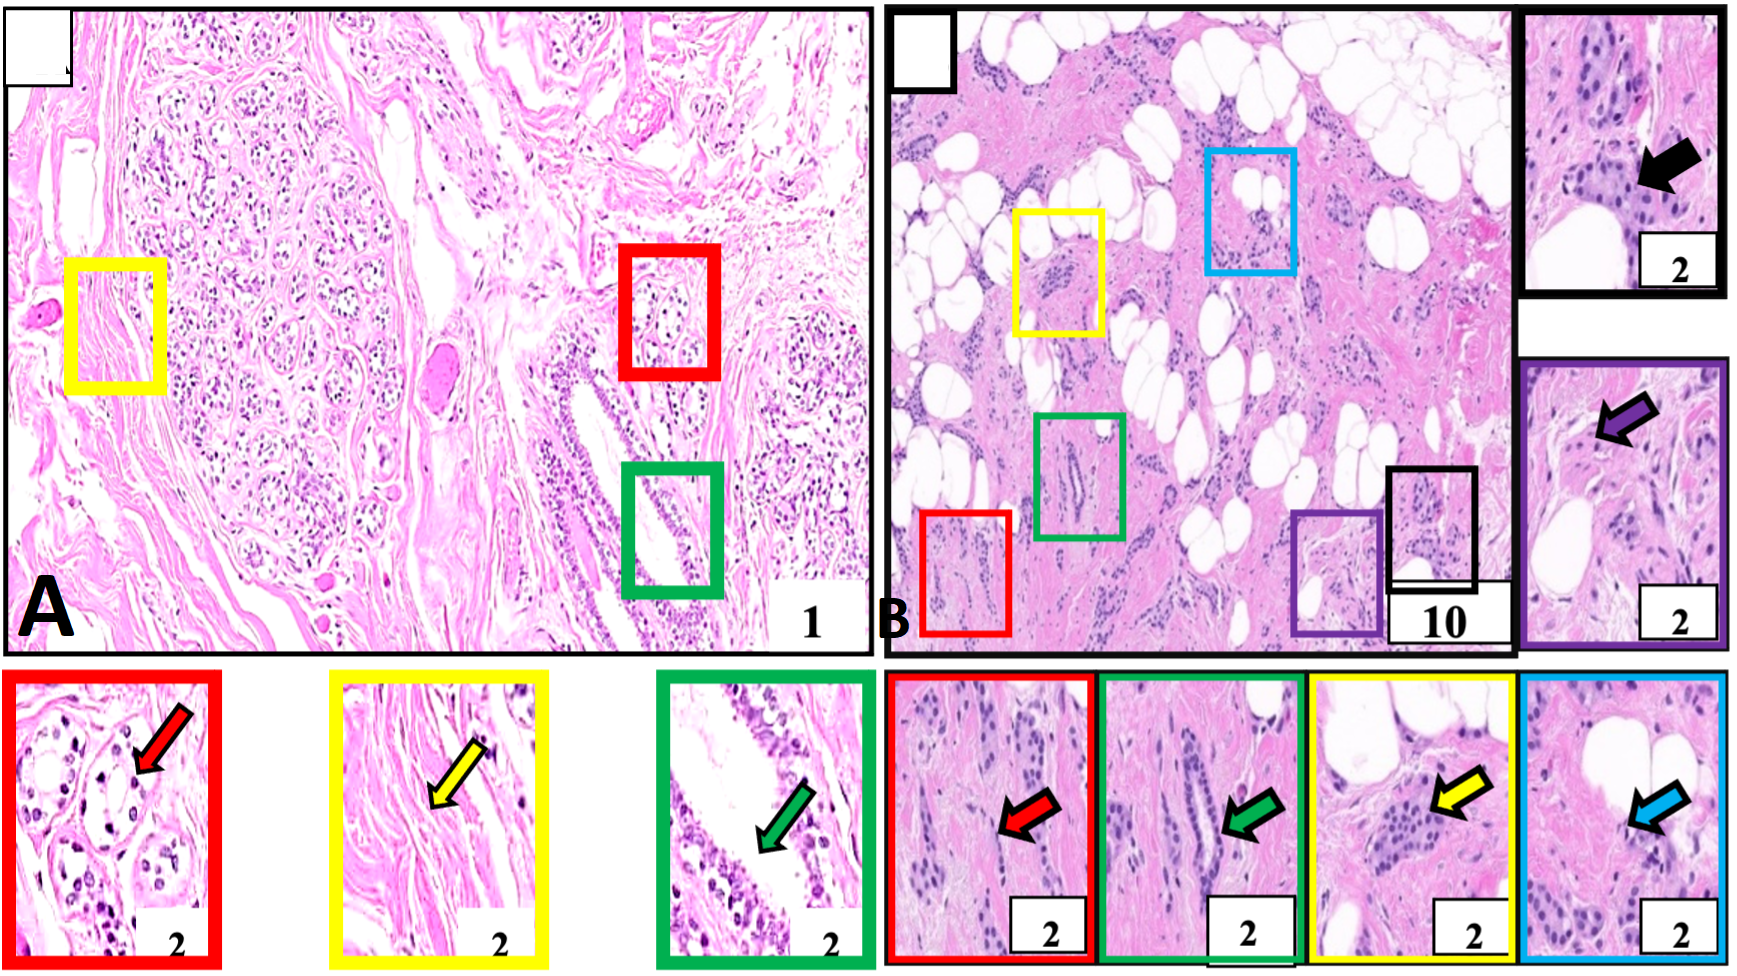
Histological structure of normal and breast tumor samples of our study subject identified for invasive ductal carcinoma. A, Negative control tissue showing morphologically normal breast cells. These cells and their nuclei are smaller, uniform, and regular in size and shape (red outlined box and arrow). The breast stroma is normal and does not show cellular penetration (yellow outlined box and arrow). The milk-carrying ducts are also nicely lined with normal cell layers (green outlined box and arrow). B, Breast cancer tissue. This tissue is showing malignant cells (red outlined box and arrow) identified in milk-carrying ducts of the breast. These cells and their nuclei are larger in size and pleomorphic morphologically (purple outlined box) arranged in cords (red outlined box and arrow), nests (yellow outlined box and arrow), sheets (black outlined box and arrow), forming tubular structures (green outlined box and arrow) and showing mitotic figures (blue outlined box and arrow). These cells are penetrating the rounding breast stroma (purple outlined box and arrow). Boxes with various color outlines are showing digitally magnified corresponding selected areas on slides A and B. Stain: Hematoxylin and Eosin.
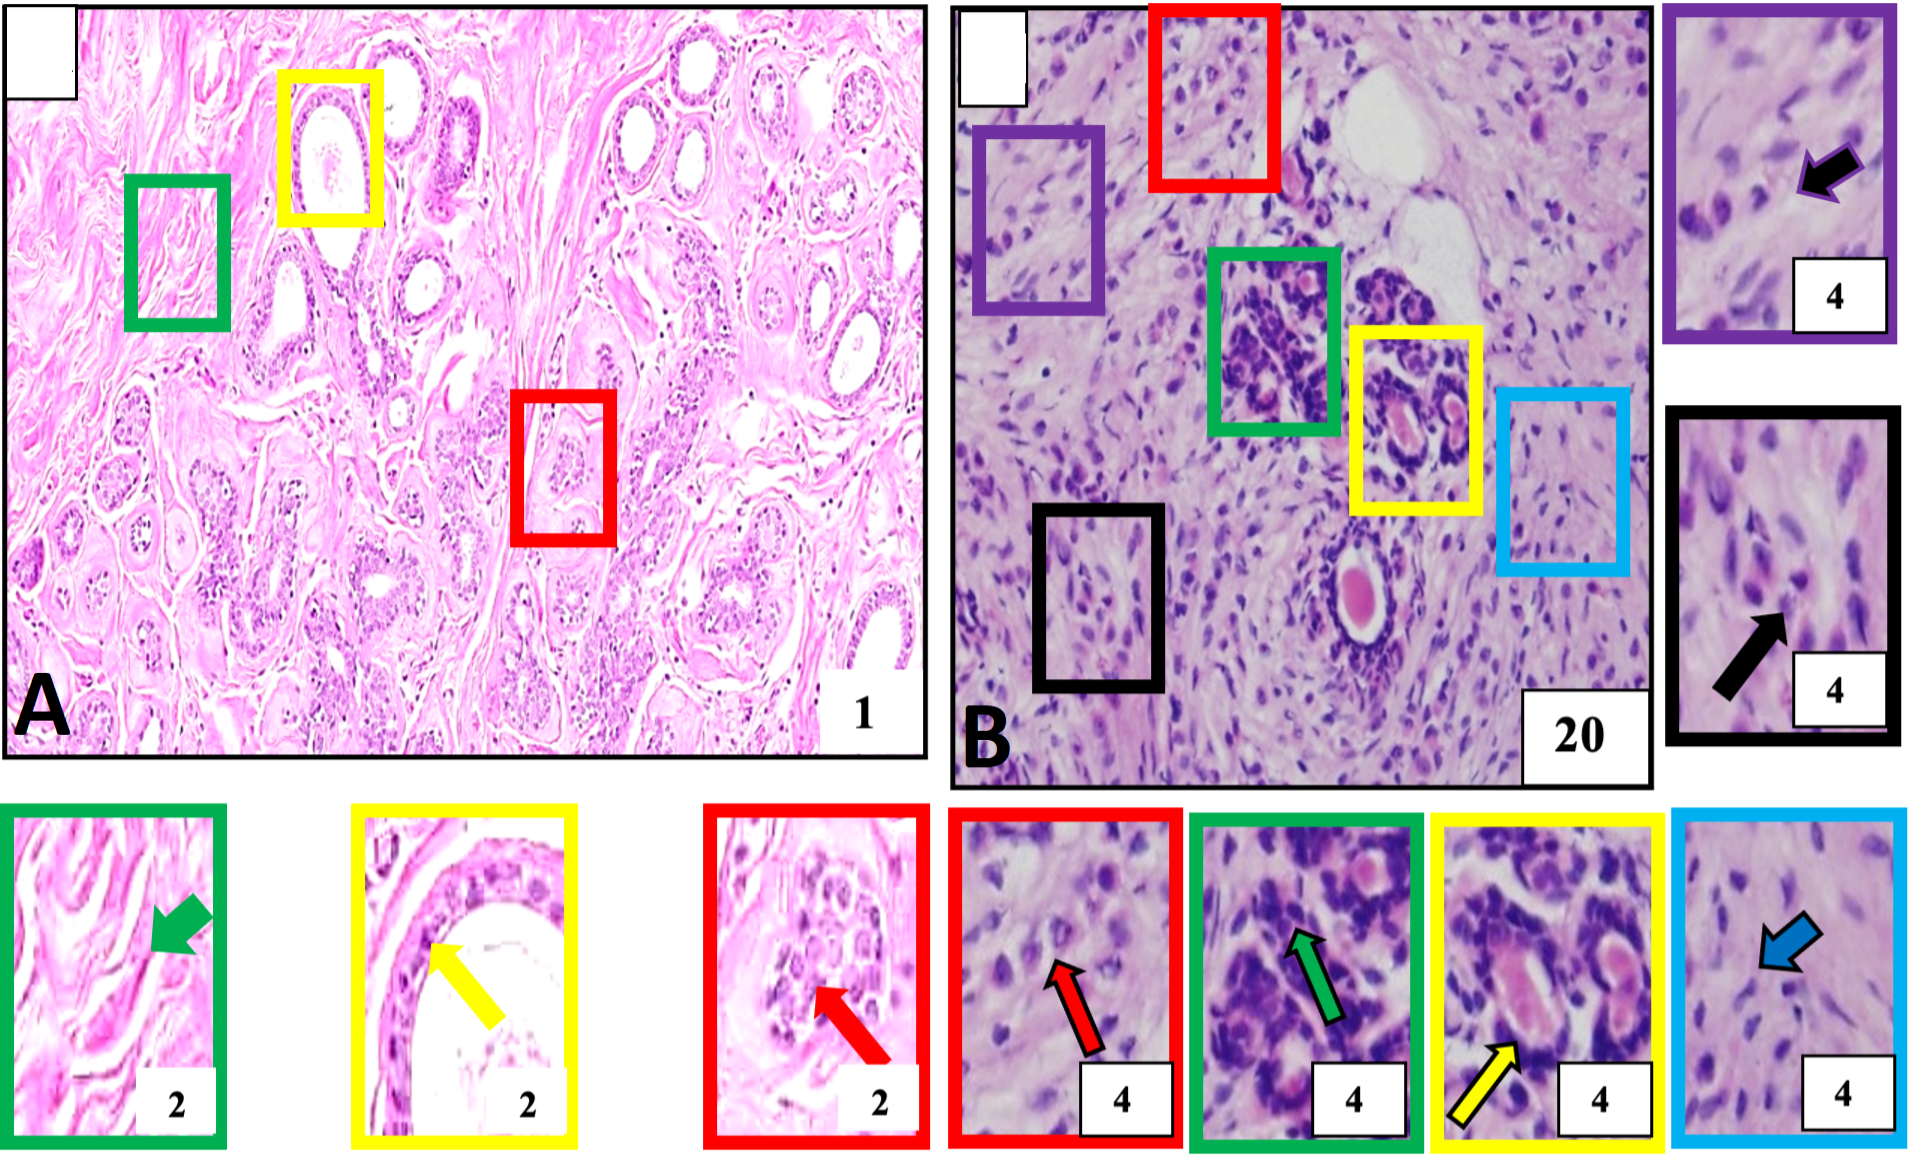
Histological structure of normal and breast tumor samples of our study subject identified for invasive lobular carcinoma A, Negative control tissue showing morphologically normal breast cells. These cells and their nuclei are smaller, uniform, and regular in size and shape (red outlined box and arrow). The breast stroma is normal and does not show cellular penetration (green outlined box and arrow) and normal cell layers constituting breast milk carrying ducts (yellow outlined box and arrow). B, Breast cancer. The tumor tissue is showing a population of malignant cells across the tissue and is detected the in lobular part of the breast. These are larger than normal breast cells arranged into single files or chains of cells (red outlined box and arrow), single cells (purple outlined box and arrow), cells with evident cellular and nuclear pleomorphism (black outlined box and arrow), round to oval shaped nuclei (green outlined box and arrow) aggregate around ducts (yellow outlined box and arrow) and penetrating surrounding breast stroma (blue outlined box with arrow). Boxes with various color outlines are showing digitally magnified corresponding selected areas on slides A and B. Stain: Hematoxylin and Eosin.

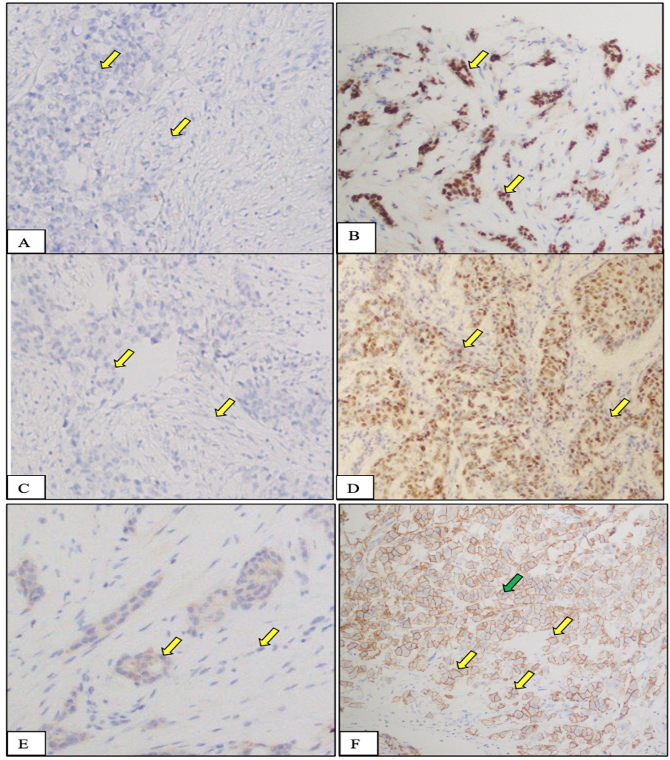
Expression of ER (A, B), PR (C, D), and HER2/neu (E,F) receptor (protein) in normal and tumor tissues from female breast cancer patients recruited in this study. A, C, E, Negative control tissue: cells in this tissue are not showing any nuclear stain due to the absence of specific receptors in these cells. On the other hand, they are showing blue color staining because of H&E counter stain. B, D, F, Breast cancer tissue, nucleic of cancer cells are showing intense staining (yellow arrow) due to the presence of overexpressed specific receptors. These receptors are localized in the cell nuclei and upon application of specific for each antibodies to these receptors, they produce a brown color. Stain: Immunohistochemical stain specific to ER receptor; Magnification: 20X; Counterstain: Hematoxylin and Eosin, Magnification: 20X.

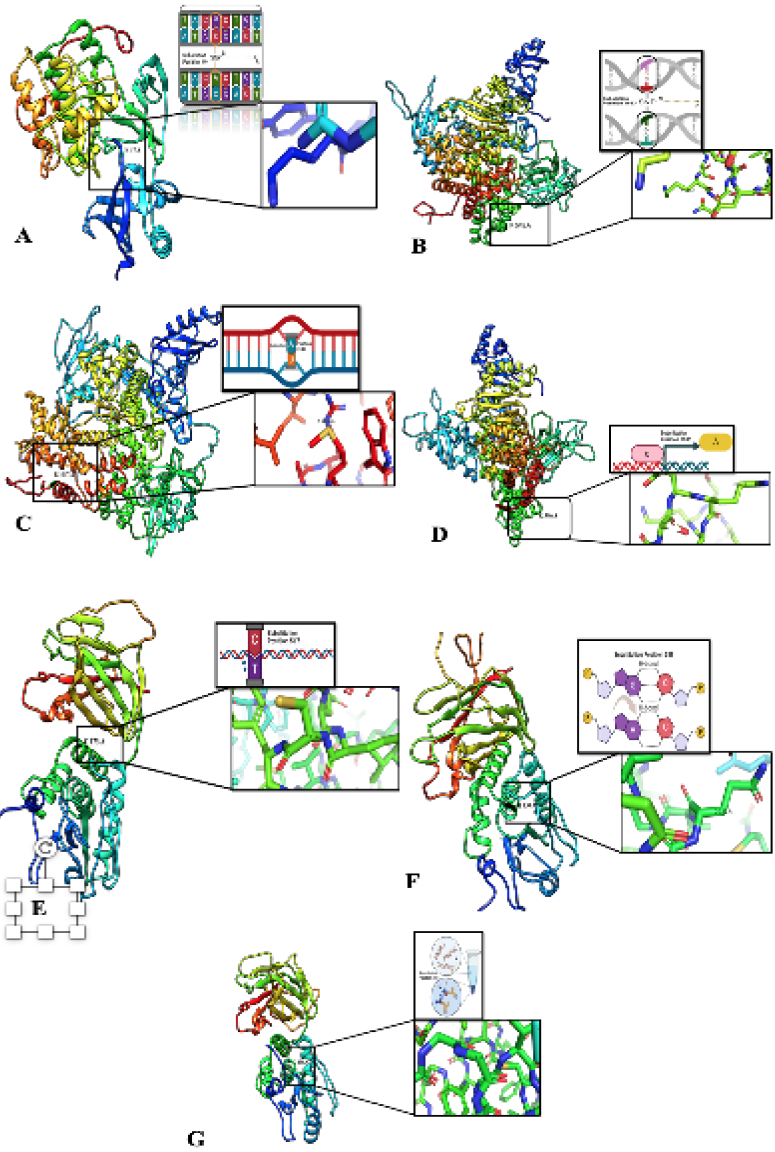
3D-modelled structure from SNPs sequence. A, Structural modeling reveals AKT1 gene mutation (E17K) on Chromosome 14, Exon 3, position 49 (c.49G>A) causing a missense mutation Amino acids change (E to K) with potential clinical association. B, An In-depth Analysis of the Structural Implications of the c.166G>A PIK3CA Gene Mutation (E545K) in Exon 10 on Chromosome 3, Resulting in a Missense Mutation that Substitutes Glutamic Acid (E) with Lysine (K) in the PIK3CA Protein. C, Protein Modeling of PIK3CA Gene Mutation (H1047R) in Exon 21 (c.31406A>G) on Chromosome 3: Revealing Molecular Mechanisms of a Missense Mutation Substituting Histidine with Arginine. D, PIK3CA Gene Mutation: A Missense Q546K Change in Exon 10 (c.1636 C>A) - A Promising Protein Model Insight. E, Modelling depict PTEN gene mutation P.R 173c (chromosome 10, Exon 6). c.517 C>T results in a missense mutation, substituting Arginine (R) with Cysteine (C) at position 517, offering insights into its potential impact on PTEN protein structure and function. F, In silicon protein modeling predicts the impact of PTEN gene mutation (P.R130Q) on chromosome 10, Exon 5, c.389G>A substitution, causing a missense mutation (R to Q). G, Mutation profiling and protein modeling to predict the location and effects of the PTEN gene mutation P.R130G on chromosome 10, exon 5 this missense mutation (c. C>G, position 388) results in an amino acid change from arginine (R) to cysteine (C).”

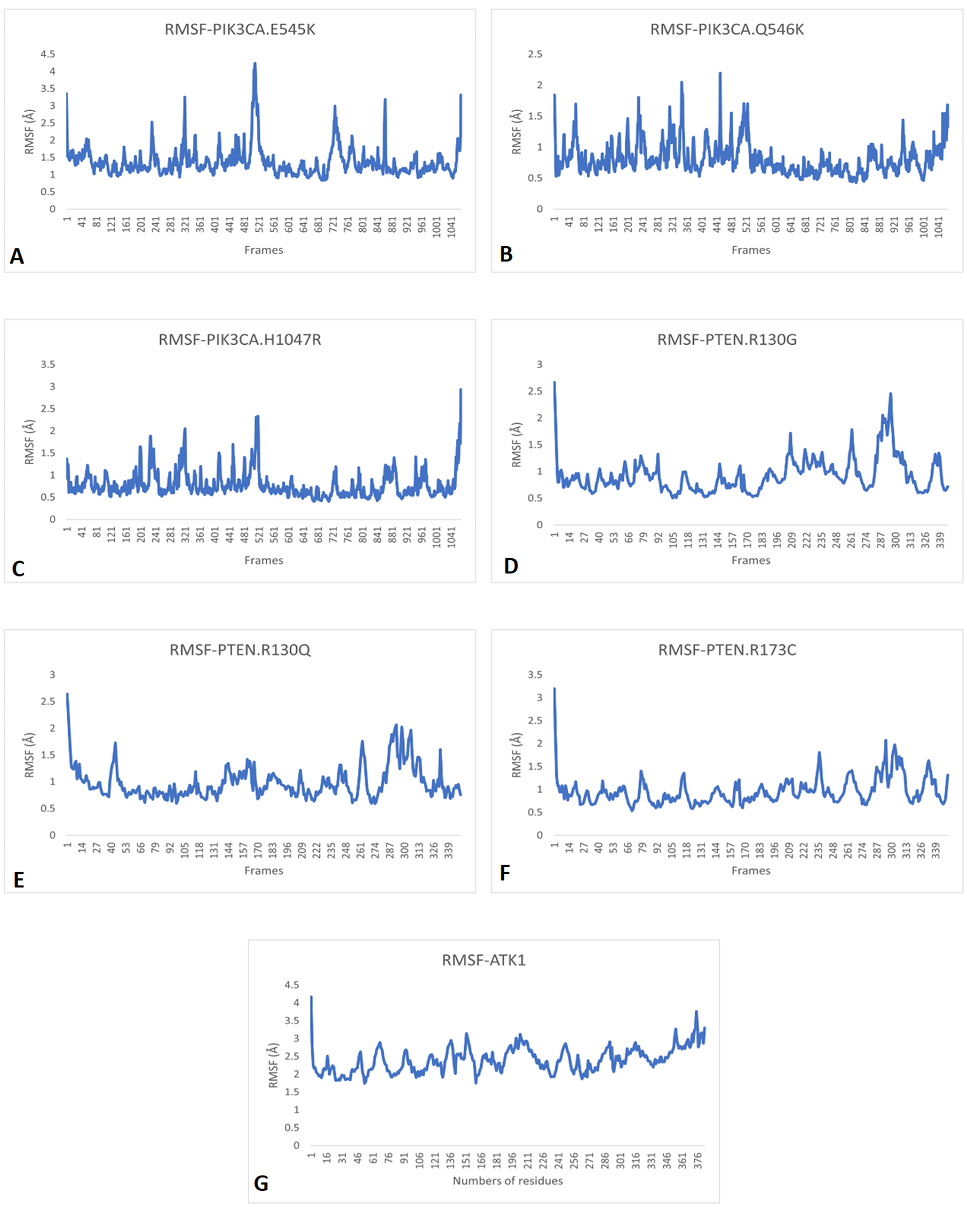
RMSF patterns of A, PIK3CA (E545K); B, PIK3CA (Q546K); C, PIK3CA (H1047R); D, PTEN (R130G); E, PTEN (R130Q); F, PTEN (R173C) and G, AKT1 (E17K) showing that these are unstable due to the continuously vigorous fluctuation of particles.
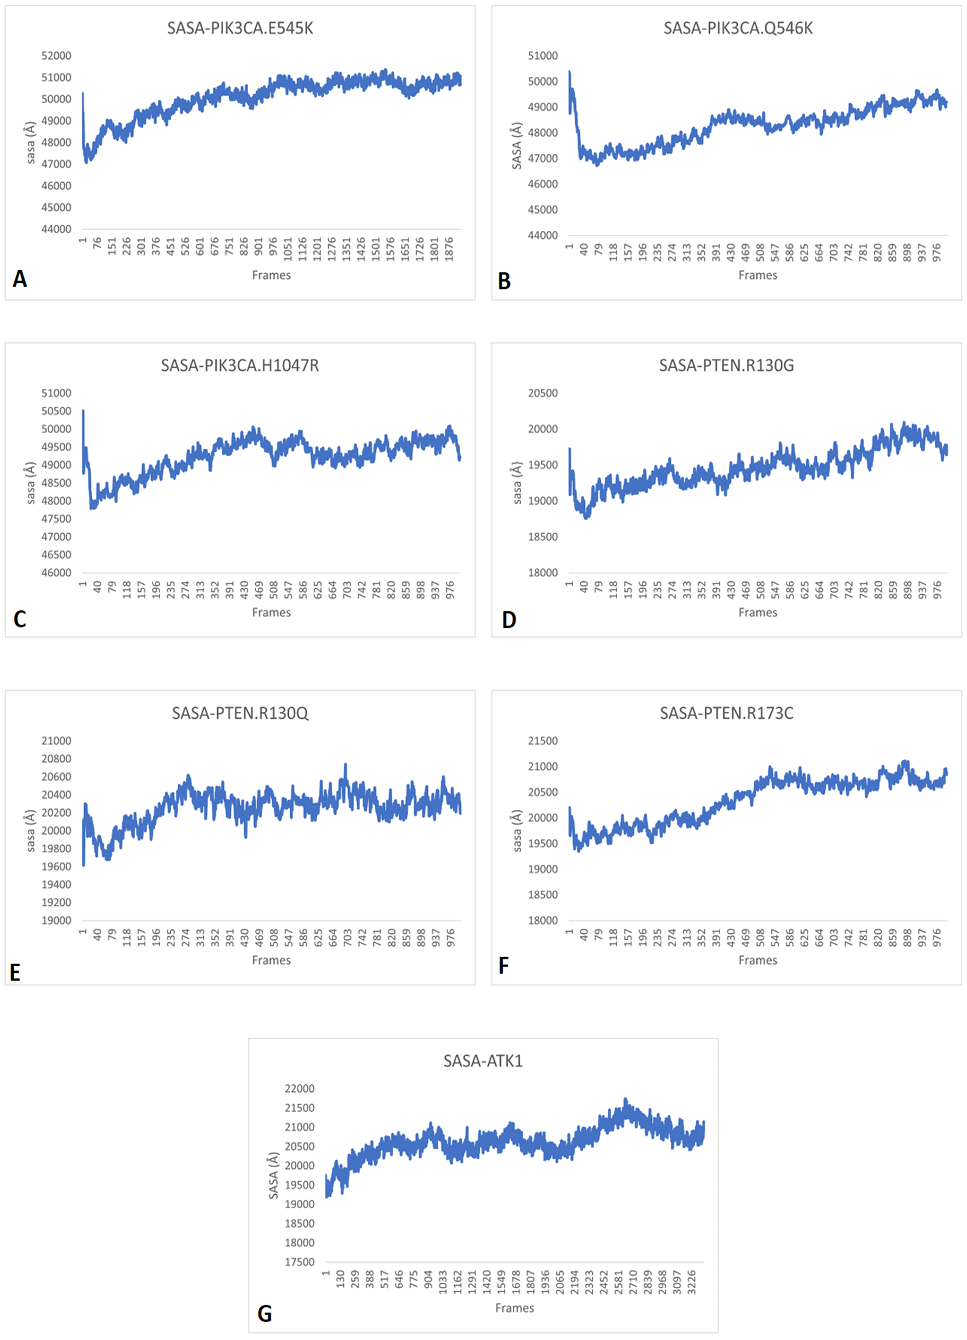
SASA patterns of A, PIK3CA (E545K); B, PIK3CA (Q546K); C, PIK3CA (H1047R); D, PTEN (R130G); E, PTEN (R130Q); F, PTEN (R173C) and G, AKT1 (E17K) showing that variants continuously fluctuate between soluble and non-soluble states leading to change their normal functions.

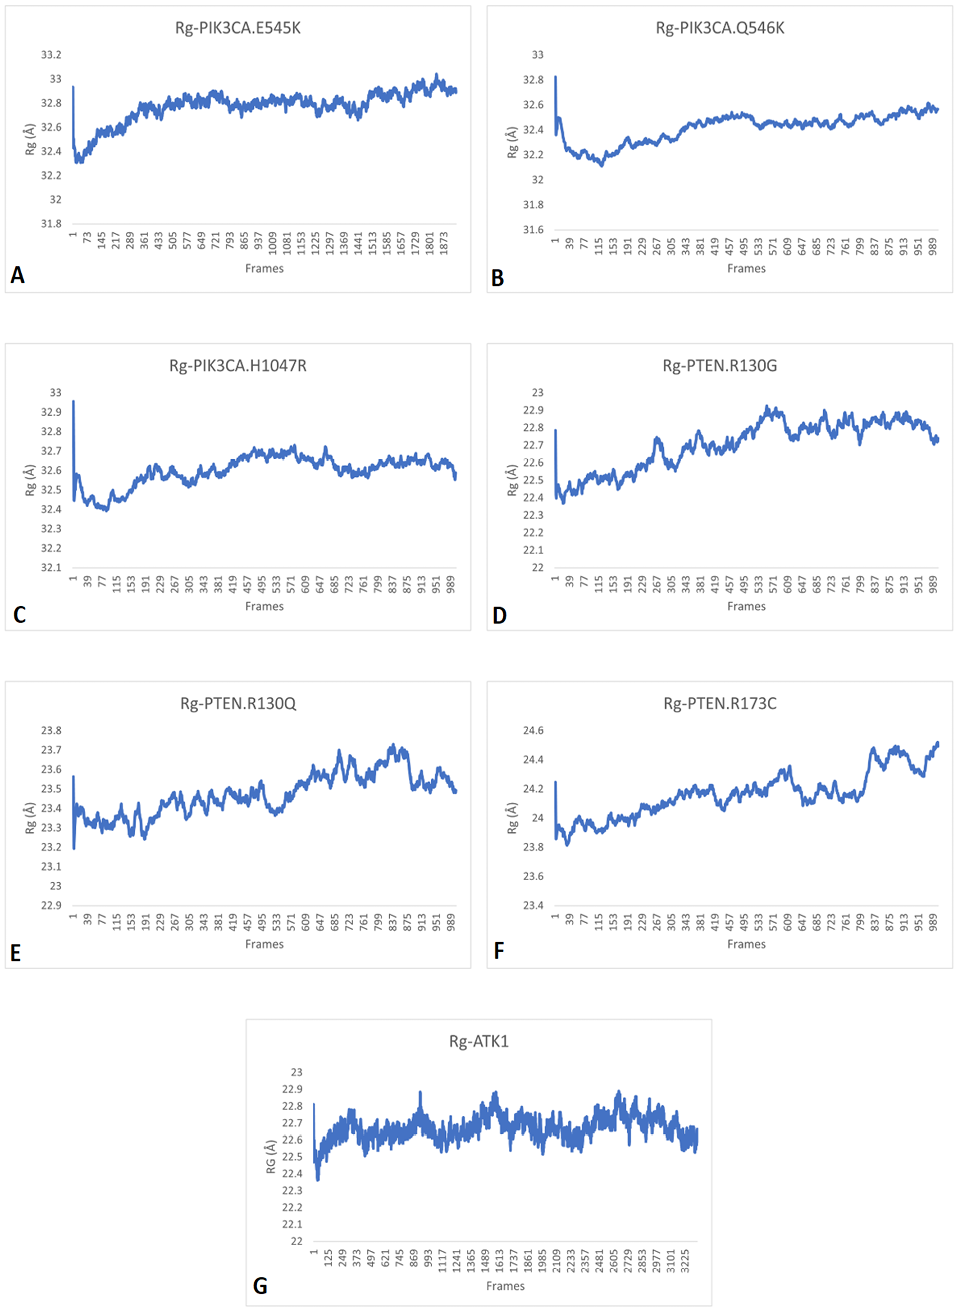
RG patterns of A, PIK3CA (E545K); B, PIK3CA (Q546K); C, PIK3CA (H1047R); D, PTEN (R130G); E, PTEN (R130Q); F, PTEN (R173C) and G, AKT1 (E17K) showing that these proteins continuously scatter particles hence their structure and function keep changing continuously and fails to perform their role.

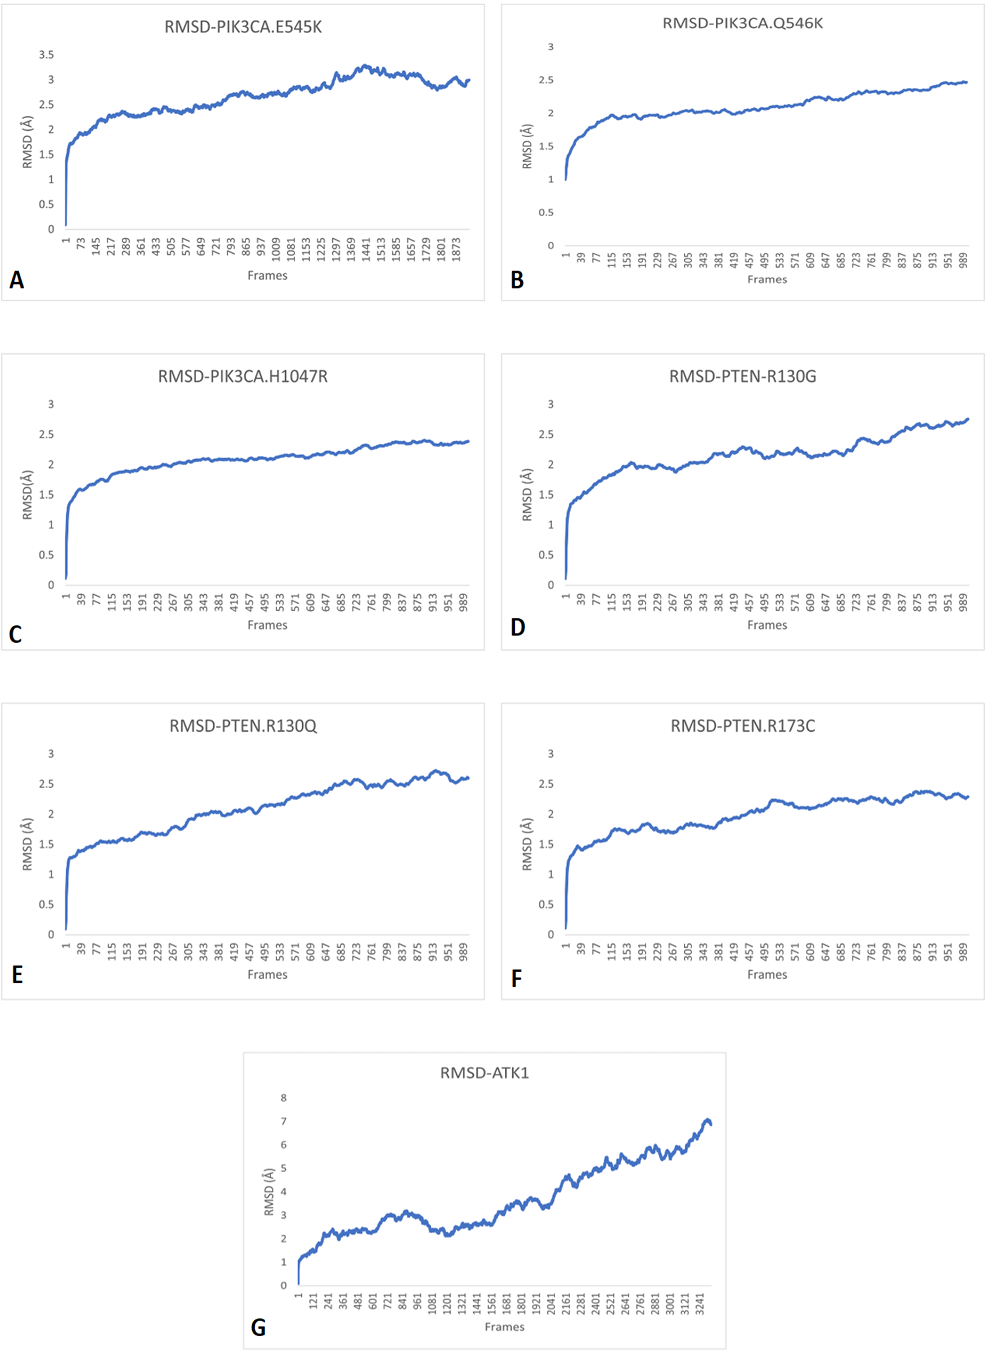
RMSD simulation patterns of A, PIK3CA (E545K); B, PIK3CA (Q546K); C, PIK3CA (H1047R); D, PTEN (R130G); E, PTEN (R130Q); F, PTEN (R173C) and G, AKT1 (E17K) showing that all RMSD values kept increasing, therefore, making them unstable.


