

More Insights into the Evolution of Fat Dormouse in the Old Growth Hyrcanian Forests


More Insights into the Evolution of Fat Dormouse in the Old Growth Hyrcanian Forests
Zahra Eftekhar1, Morteza Naderi2,*, Mohammad Kaboli3, Hamid R. Rezaei4 and Nematollah Khorasani3

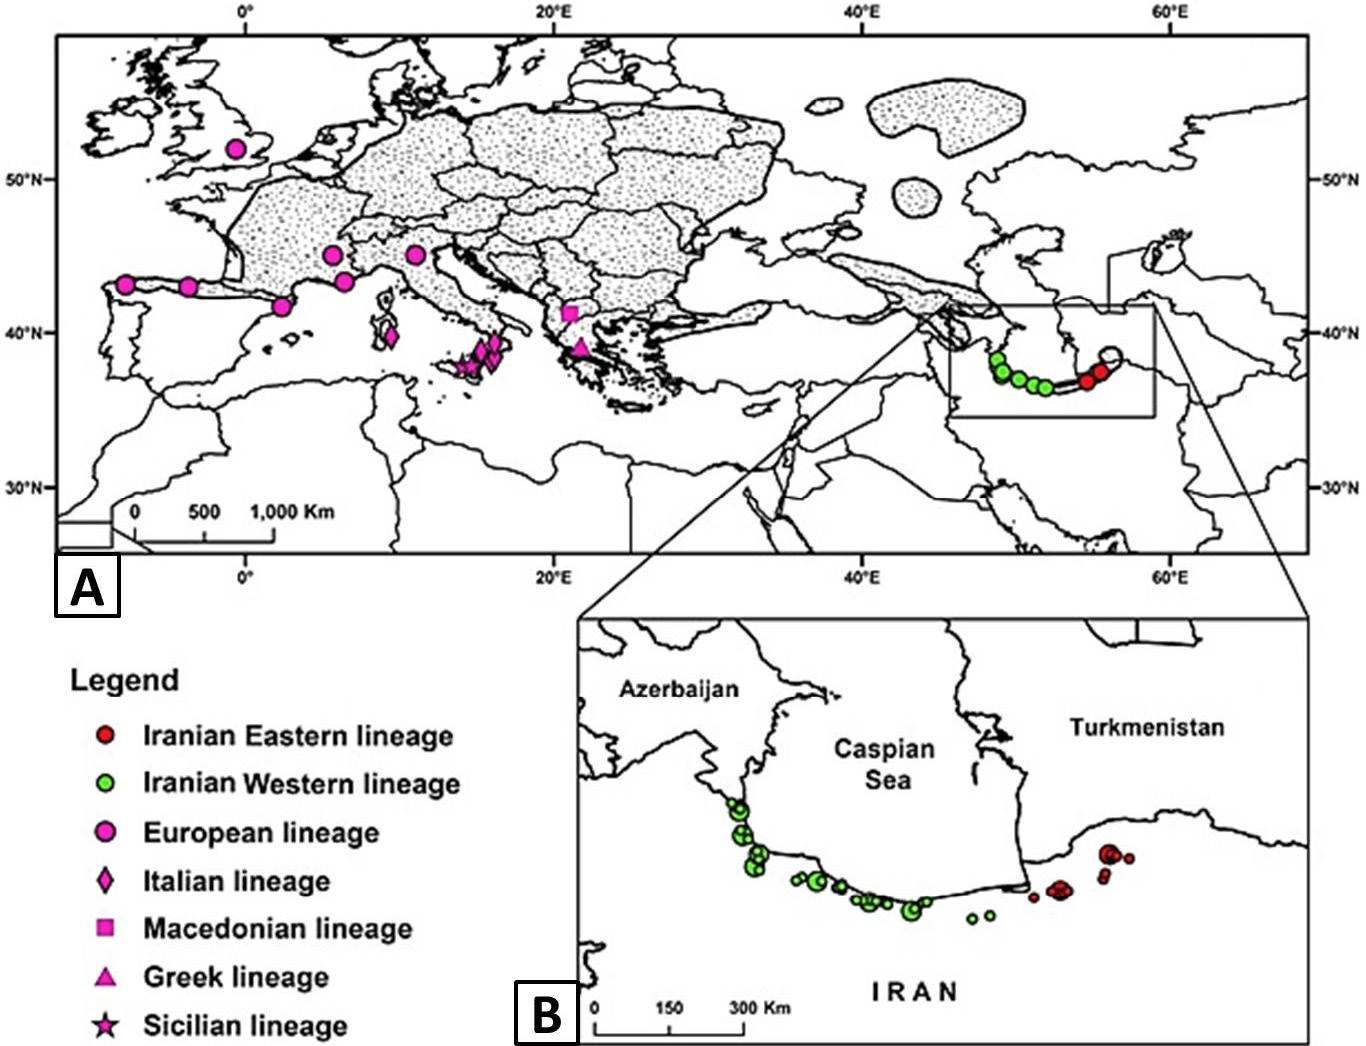
Distribution of the studied species in the world (Naderi, 2014).

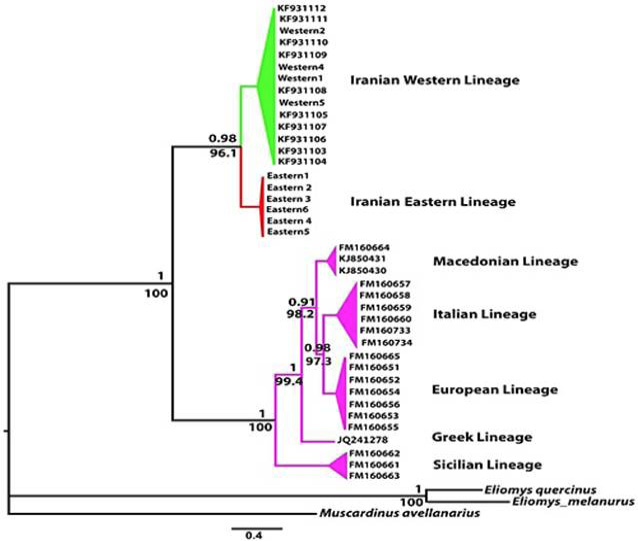
Phylogenetic position of Iranian lineages based on mitochondrial evidences (Naderi, 2014).

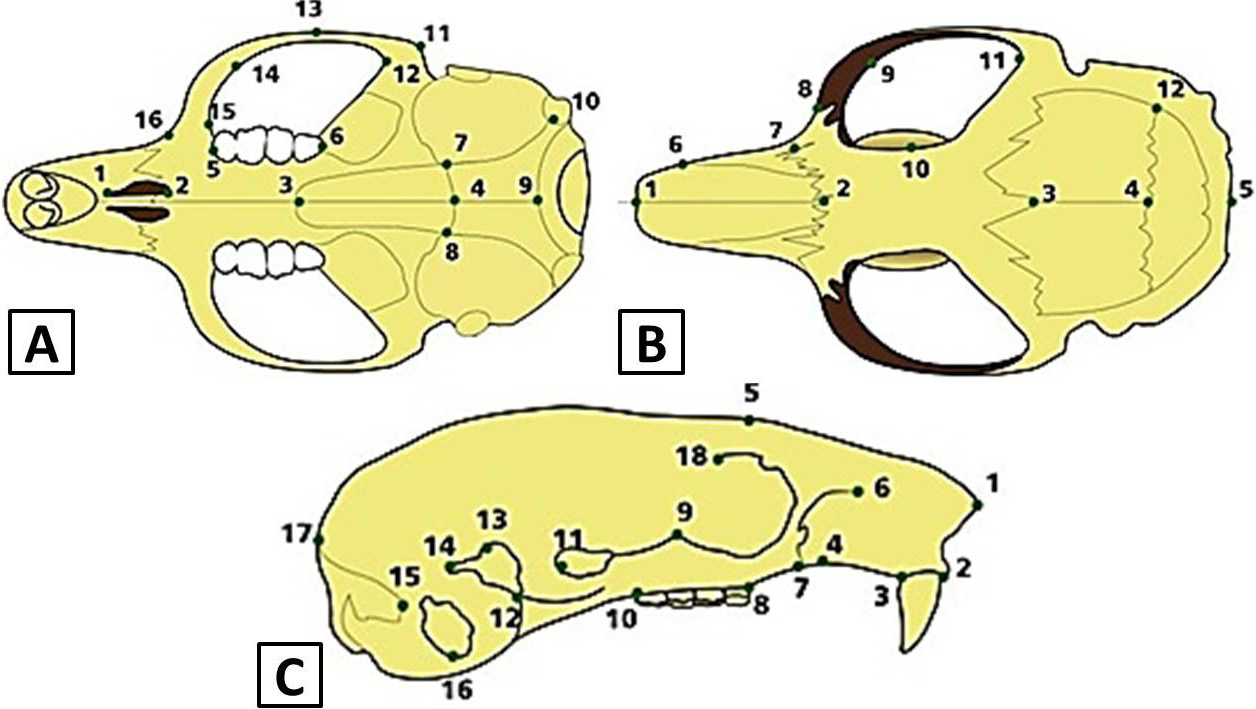
Landmark positions on ventral (A), dorsal (B) and lateral (C) cranium views. A, Dorsal view: 1, frontal tip of internasal suture; 2, sagittal suture between frontals and nasals; 3, sagittal suture between frontals and parietals; 4, suture interception of both right and left parietal and interparietal in the sagittal plane; 5, posterior border of supraoccipital, at the nuchal crest; 6, anteriormost point of suture between nasal and premaxilla; 7, more concave curve point of zygomatic notch; 8, external border of maxillary at the most anterior curvature of zygomatic arch; 9, midpoint of the the zygomatic arch; 10, smaller frontal width (interorbital width); 11, more concave curve point of squamosal root of zygomatic arch; 12, suture between parietal, interparietal and occipital. B, Lateral view: 1, anterior tip of the nasals; 2, skull most posterior border, at supraoccipital bone, above the foramen magnum; 3, labial upper junction of incisors and maxillary; 4, lingual upper junction of incisors and maxillary; 5, posteriormost point of suture between nasal and premaxilla; 6, anterior border of zygomatic plate; 7, inferiormost point of suture between of premaxilla and maxilla; 8, anterior border of upper molar row at the alveolar process of maxillary; 9, internal more concave curve point of squamosal root of zygomatic arch; 10, posterior border of upper molar row at maxillary; 11, point of maximum anterior constriction of squamosal root of zygomatic arch; 12, inferior most point of zygomatic arch; 13, posterior most point of zygomatic arch; 14, upper concave curve point of tympanic bulla; 15, superior most point of tympanic bulla; 16, posterior most point of tympanic bulla; 17, posterior most point of occipital; 18, anterior junction of maxillary and the frontal sutures. C, Ventral view: 1, anterior border of incisive foramen; 2, posterior border of incisive foramen; 3, posterior midline suture of palatines; 4, midpoint of suture between basisphenoid and basioccipital; 5, anterior alveolar margin of the upper molar row, at maxillary; 6, posterior alveolar margin of the upper molar row at palatines; 7, posterior border of ectotympanic part of auditory bulla; 8, posterior border of ectotympanic part of auditory bulla; 9, anterior most point of inferior margin of foramen magnum; 10, posterior most point of superior margin of foramen magnum; 11, Posterior inferior tip of squamosal root of zygomatic bar; 12, internal more concave curve point of inner extreme curvature of squamosal root of zygomatic arch; 13, superiormost margin of zygomatic arch; 14, posteriormost margin of the maximum anterior constriction of squamosal root of zygomatic; 15, internal more concave curve point of maxillary root of zygomatic arch; 16, external border of maxillary root of zygomatic arch.
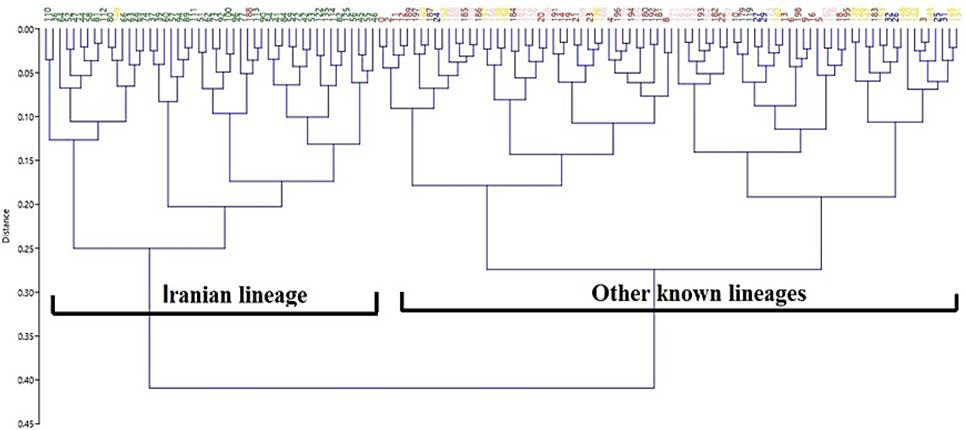
Clustering tree indicates that the Iranian lineage separated considerably from other lineages (ventral view).
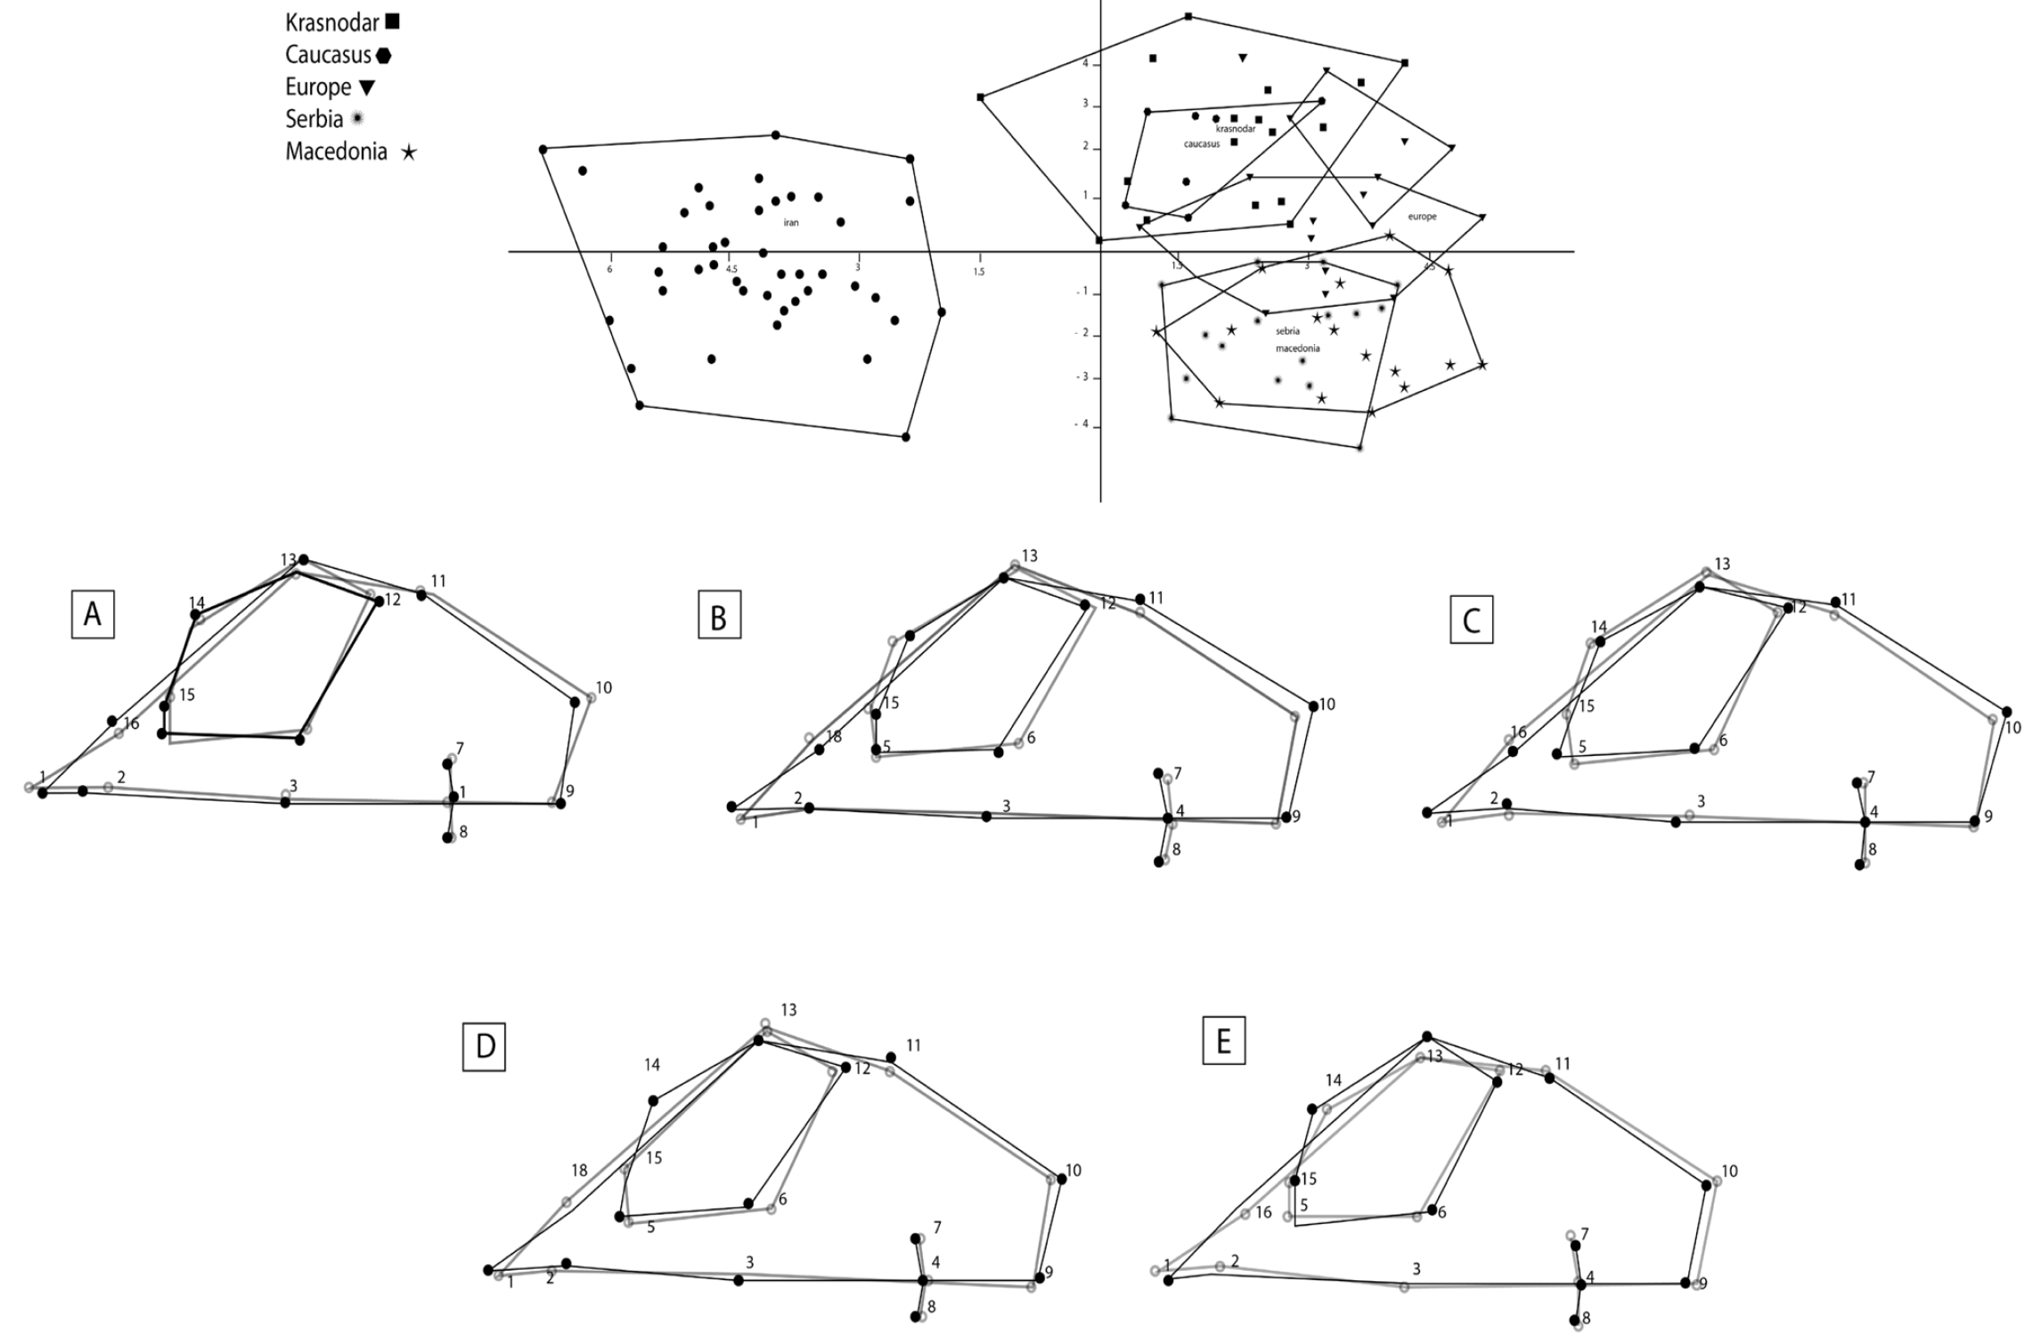
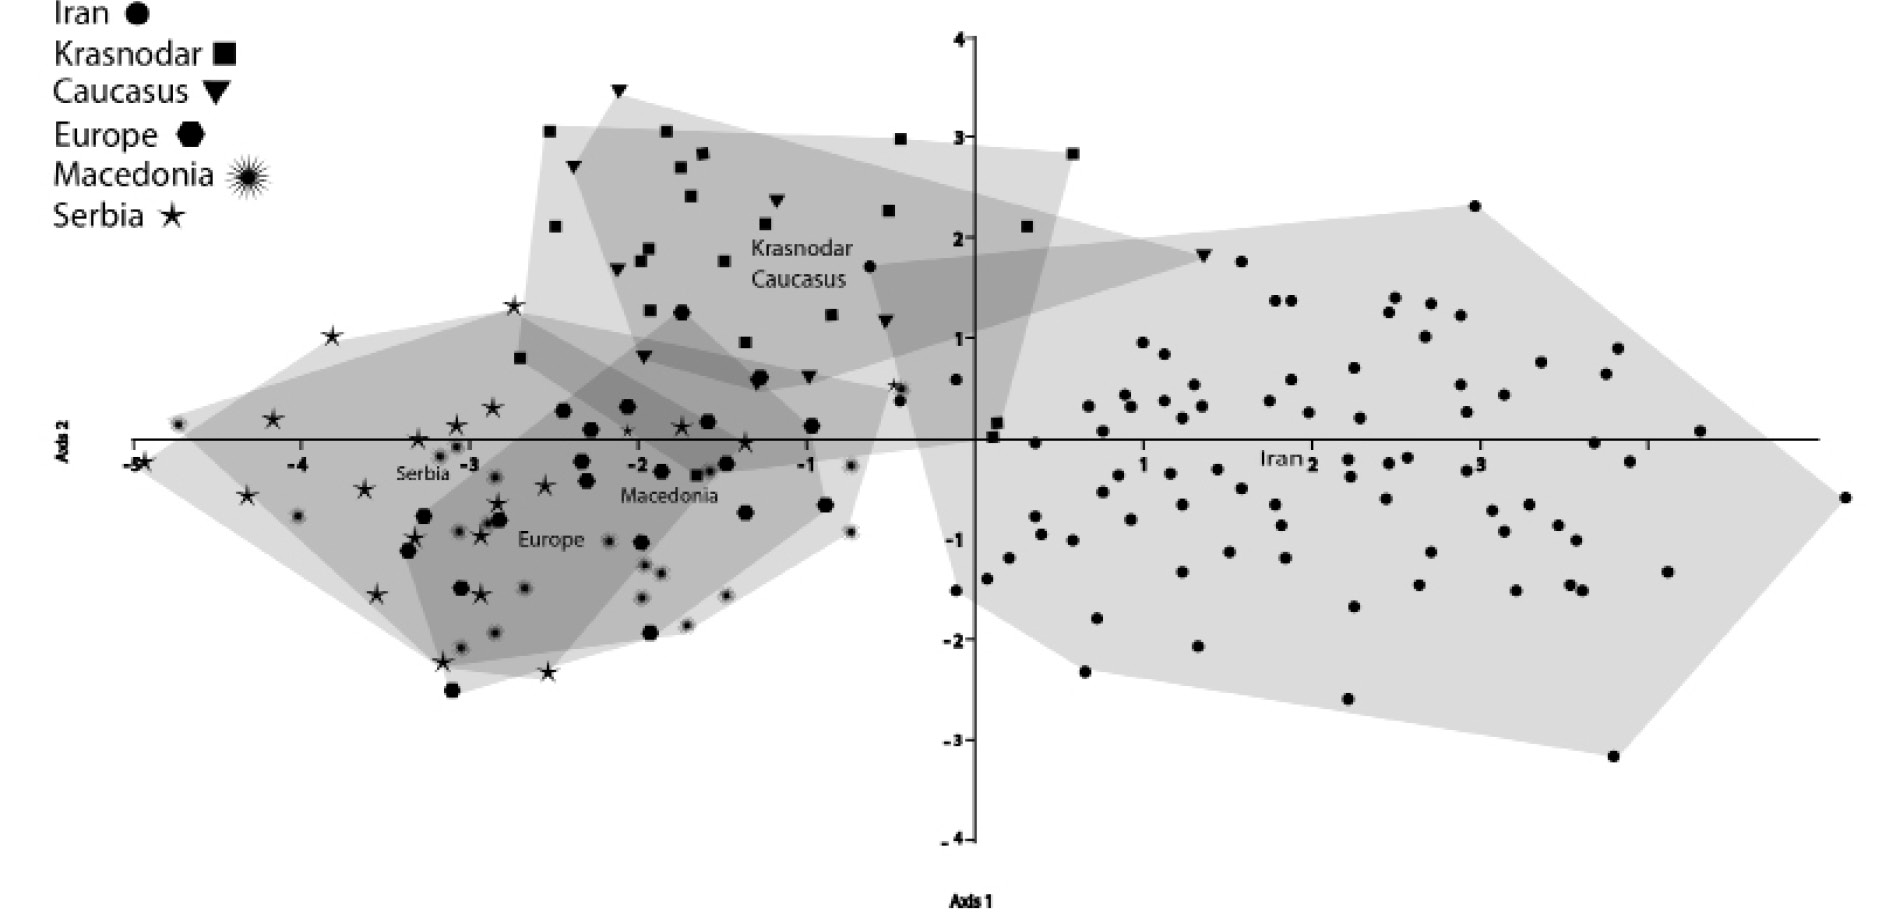
CVA analysis shows the separation of the Iranian lineage from others (two first axes justify more than 90% of variances (ventral view)). A, Iran & Caucasus; B, Iran & Krasnodar; C, Iran & Macedonia; D, Iran & Europe; E, Iran & Macedonia. Darker line shows Iranian specimens and lighter one indicates others.

DA analysis which shows the separation of the Iranian lineage from other lineages (two first axes justify more than 96% of variances for ventral view).

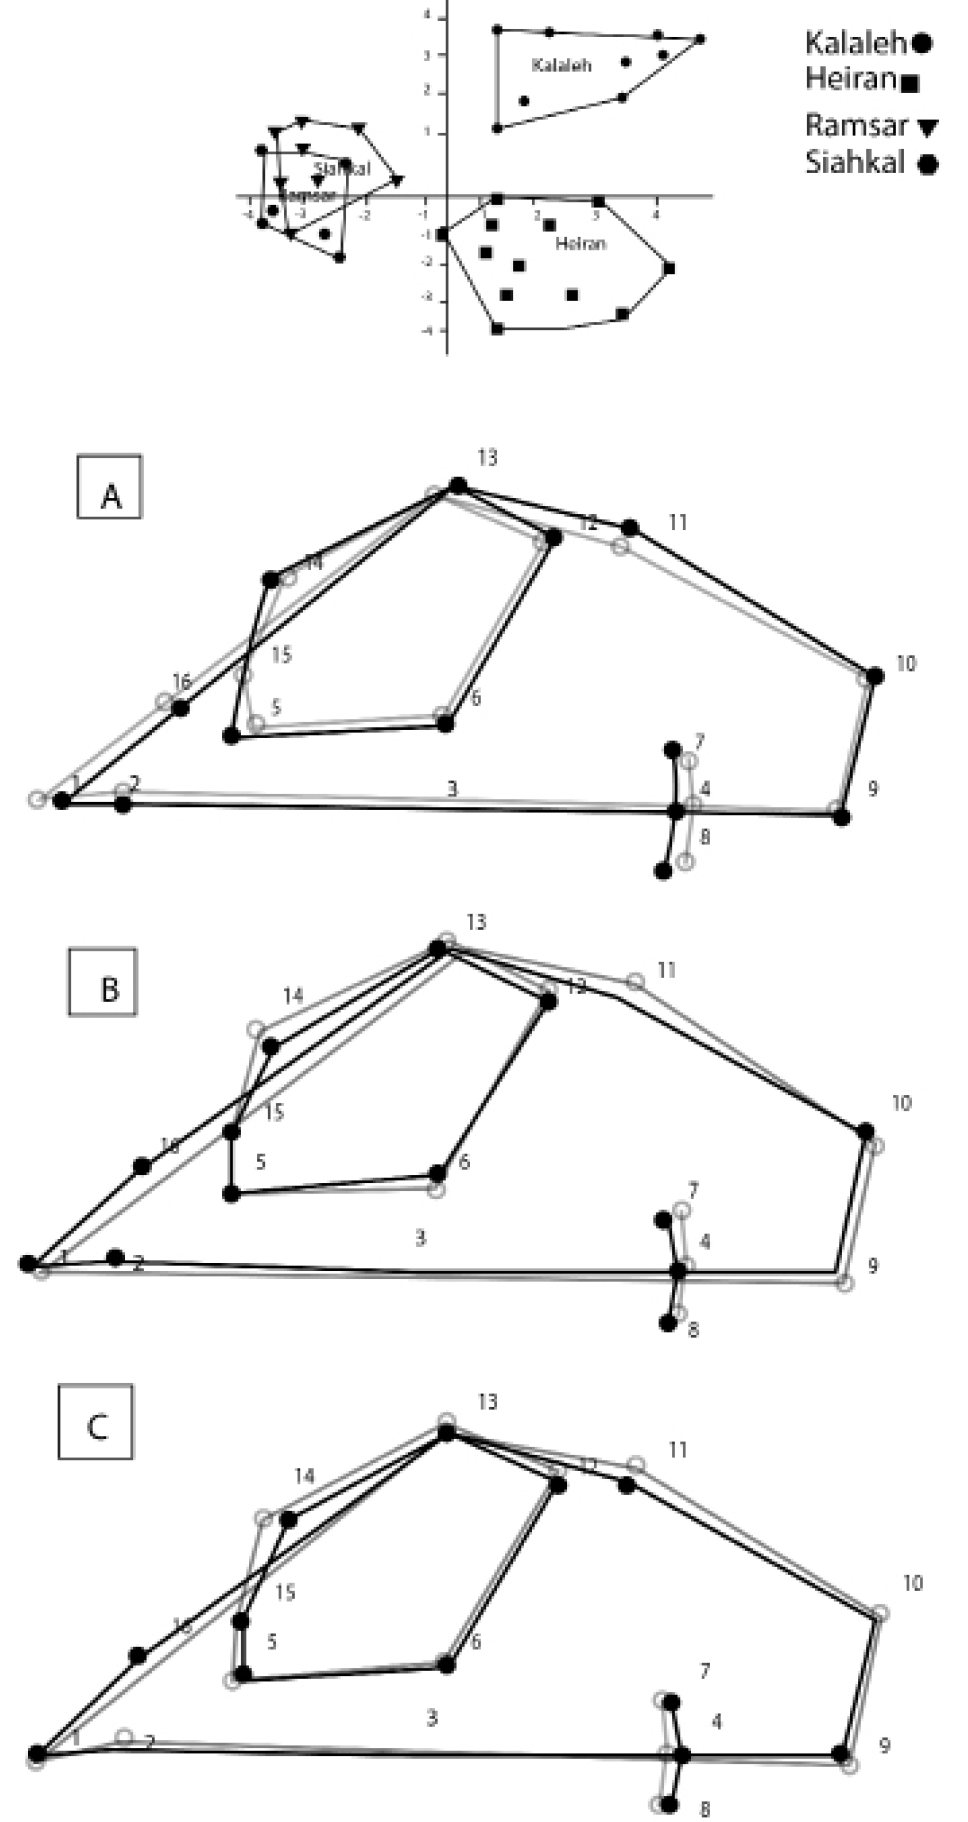
TCVA analysis which indicates the separation of Kalaleh lineage from other Iranian populations (two first axes justify more than 87% of variances (ventral view) but Heiran population is the same (also distinct). For more details, see Figure 5.

CVA analysis which shows the separation of Kalaleh lineage from other Iranian populations (two first axes justify more than 87% of variances (ventral view) but Heiran population is the same (also distinct). For more details, see Figure 5.

Phylogenetic position of Iranian lineages based on mitochondrial evidences (Naderi, 2014).


