

Molecular Characterization and Differential Expression of Two Prostaglandin E Synthase 2 Orthologs in Coilia nasus


Molecular Characterization and Differential Expression of Two Prostaglandin E Synthase 2 Orthologs in Coilia nasus
Gangchun Xu1,2, Fukuan Du2, Yuyu Wang2, Yan Li2, Zhijuan Nie2 and Pao Xu1,2,*

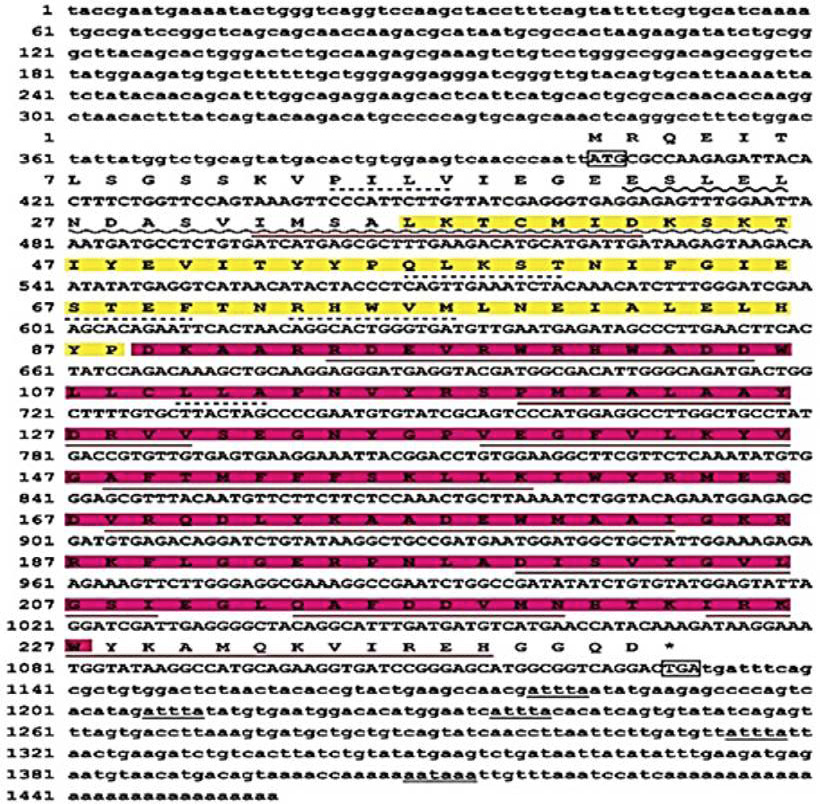
Nucleic acid sequence and deduced amino acid sequence of PTGES2a. Capital letters above the nucleotide sequences indicate the corresponding amino acid sequence. The start codon (ATG) and stop codon (TGA) are boxed. The motif associated with mRNA instability (ATTTA) is in bold font and underlined. SMR domain is shade with green, GST-N3 domain is shade with blue, Leucine Rich Region domain is shade with yellow, GST-C3 domain is shade with pink, Glutaredoxins domain is underlined with wavy line, alpha helix are underlined with red line and beta sheets are underlined with dotted line.
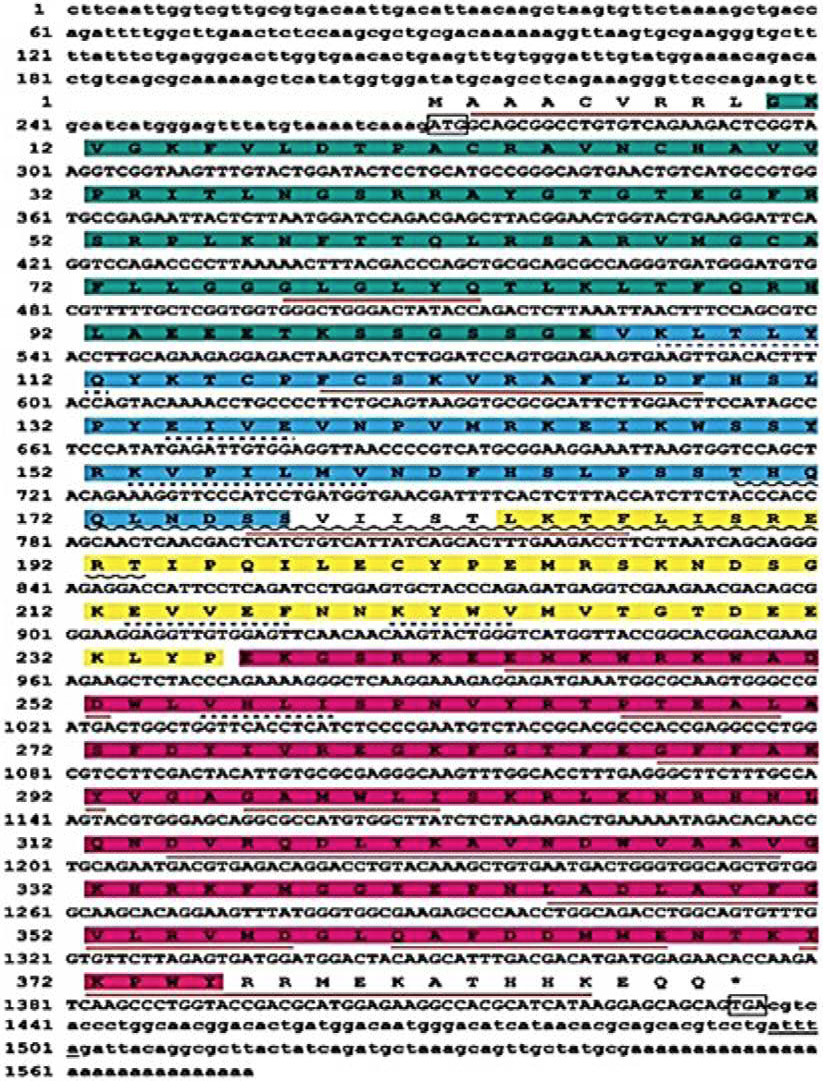
Nucleic acid sequence and deduced amino acid sequence of PTGES2b. Particular sequences are indicated as described above. The poly(A) signal sequence (AATAA) is in bold font and double underlined. The domains marked as that in Figure 1.

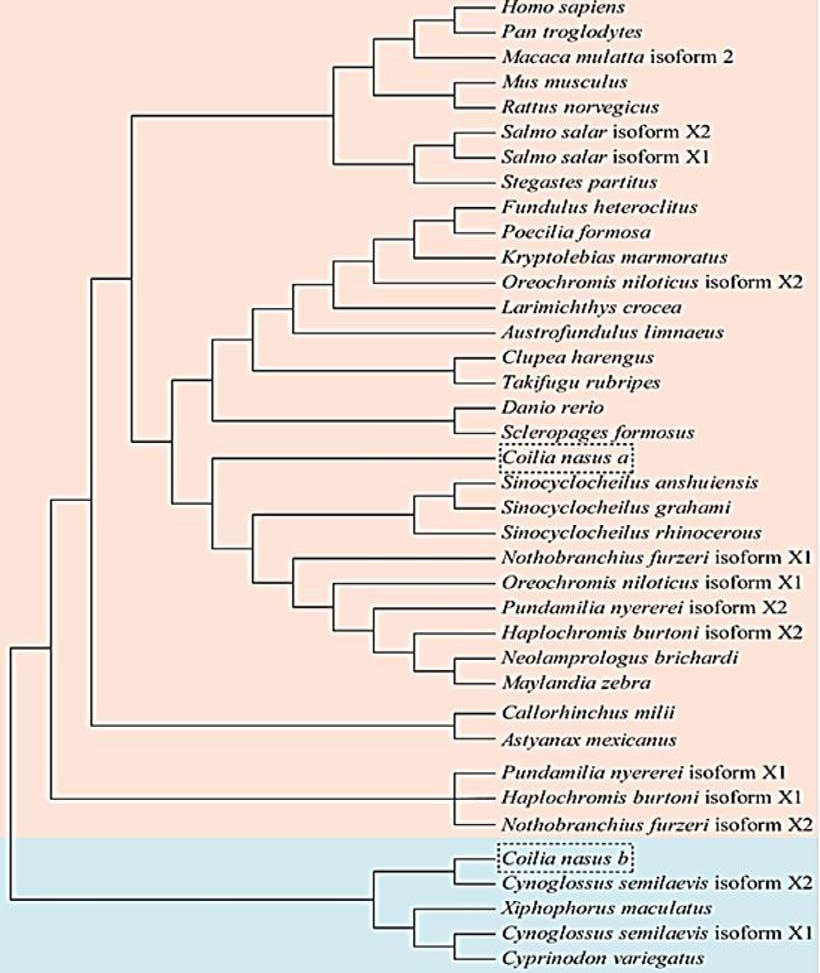
Phylogenetic analysis of PTGES2s and other reported PTGES2 sequences from vertebrates. The phylogenetic tree was constructed by the neighbour-joining method using MEGA 3.1. The GenBank accession numbers of the analyzed PTGES2 sequences are listed in Table II.
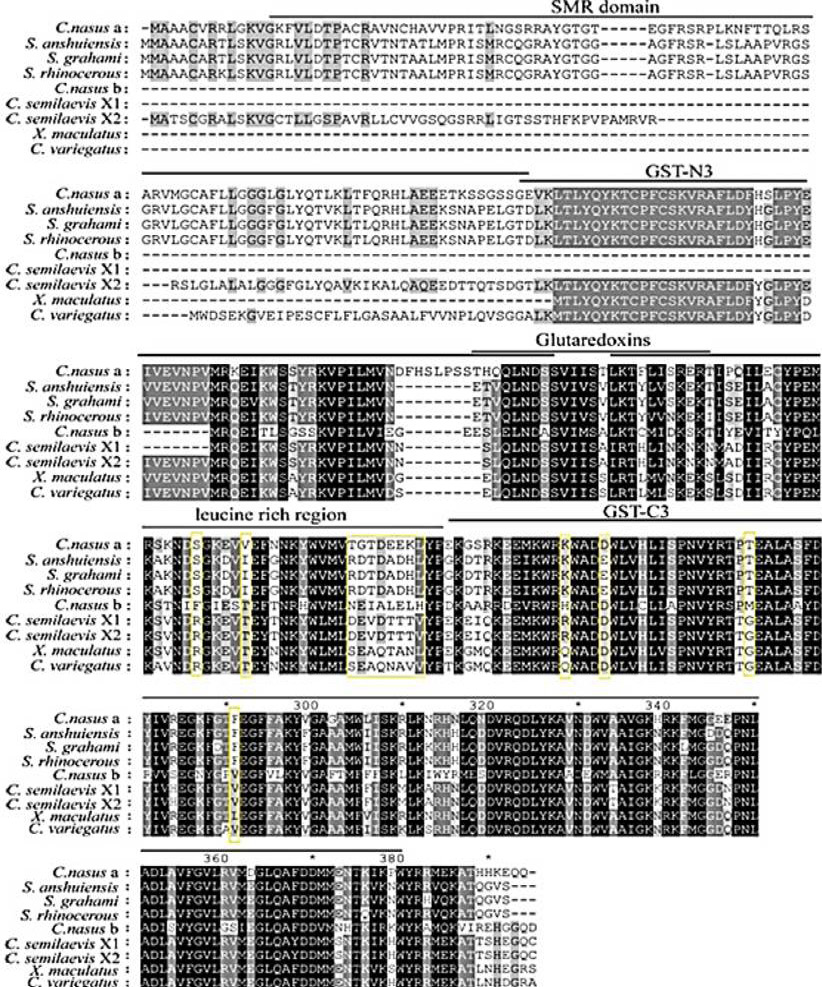
Alignment of the deduced amino acid sequence of PTGES2a and PTGES2b. Completely conserved residues across all species are aligned and shaded in black. The conserved residues in PTGES2a or PTGES2b are boxed.

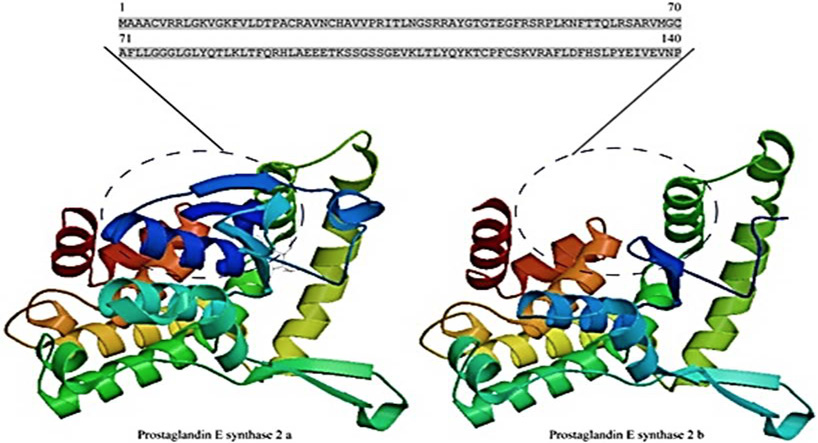
The three-dimensional structures of PTGES2a and PTGES2b. This diagram was generated by SWISS-MODEL online software. The differences between the PTGES2a and PTGES2b structures are indicated by a dotted ellipse, and the corresponding amino acid sequences are shown.

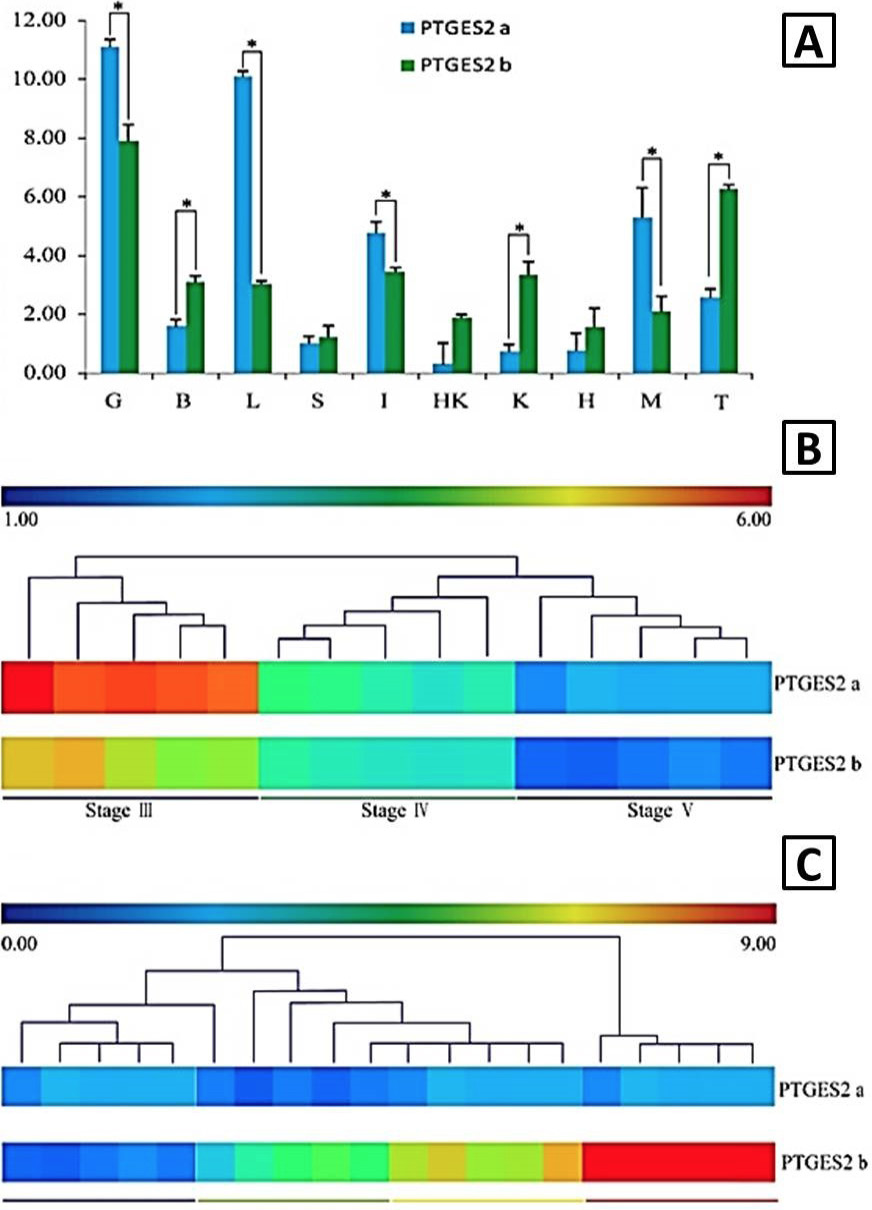
The expression profiles of PTGES2a and PTGES2b mRNA. A, RT-qPCR analysis of the expression profiles of PTGES2a and PTGES2b mRNA in different Coilia nasus tissues. Data are expressed as the ratio of PTGES2a mRNA expression in the tissue to its expression in the spleen (mean ± SD); B, expression profiles of PTGES2a and PTGES2b in the ovary at different stages. Data are expressed as the ratio of PTGES2b mRNA at different stages to expression in stage V (Log 2 transformed); C, expression profiles of PTGES2a and PTGES2b during the spawning process. Data are expressed as the ratio of PTGES2a mRNA expression to expression in the controls (0 h, Log 2 transformed).


