

Mechanism of Action of Velvet Antler Polypeptide in Improving Mild Cognitive Impairment in Rats


Mechanism of Action of Velvet Antler Polypeptide in Improving Mild Cognitive Impairment in Rats
Xiao-Wei Huang1,2, Mei-Li Liu1, Jin-Ji Wang1, Yue-Xin Liu3, Zhe Lin1, Chun-Shu Rong4* and Ji-Xiang Ren4*
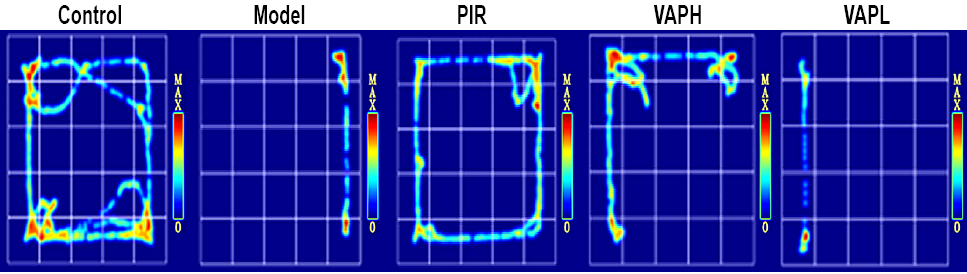
Fig. 1.
Representative heat maps of the movement of rats within an open-field box over a two-minute period.
Notes: Control, control group; Model, model group; PIR, Piracetam group; VAPH, 300 mg/kg VAP group; VAPL, 200 mg/kg VAP group. Red indicated more time, and blue indicated less or no time. The time periods were given in seconds.
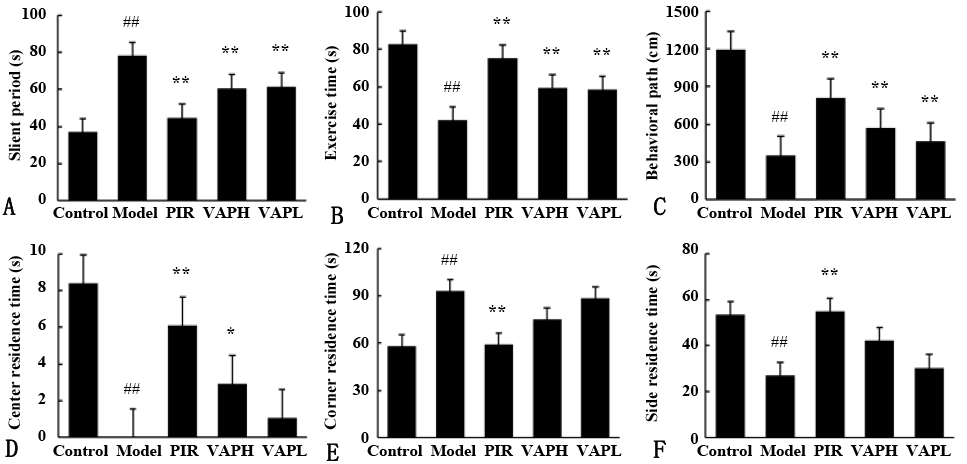
Fig. 2.
Results of the open field test during a 2-min period for each group of rats.
(A) Slient period: total inactivity time; (B) Exercise time: total activity time; (C) Behavioral path: total travel distance; (D) Center residence time: time spent in the central area; (E) Corner residence time: time spent in the corners; (F) Side residence time: time spent on the side.
Notes: Data are presented as mean ± SD (n = 10 per group). Compared with Control group, ## P <0.01; Compared with Model group, * P <0.05, ** P <0.01.

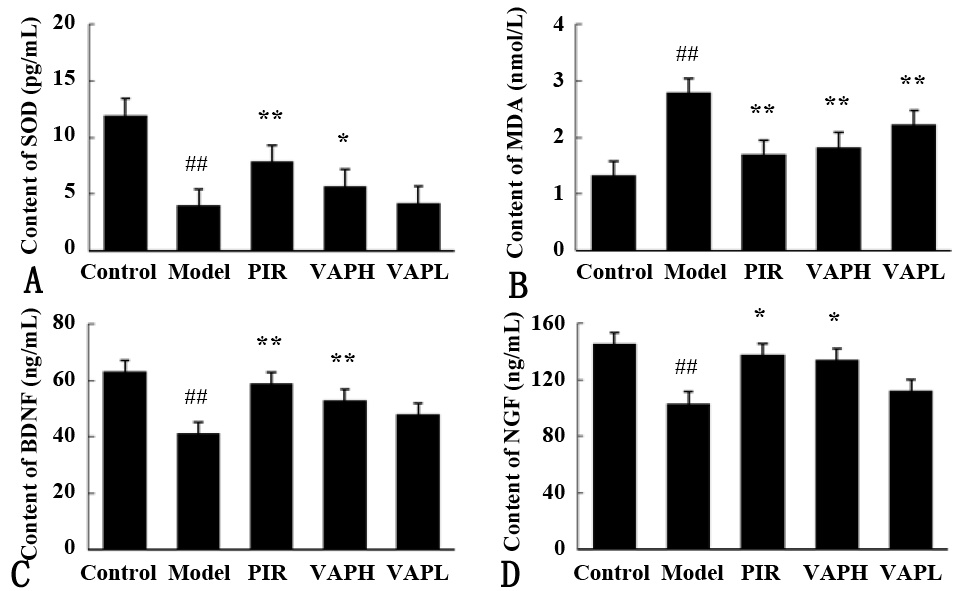
Fig. 3.
Contents of SOD (A), MDA (B), BDNF (C) and NGF (D) in serum of rats in each group.
Notes: Data are presented as mean ± SD (n = 10 per group). Compared with Control group, ## P <0.01; Compared with Model group, * P <0.05, ** P <0.01. SOD, superoxidase dismutase; MDA, malondialdehyde; BDNF, brain-derived neurotrophic factor; NGF, neural growth factor.
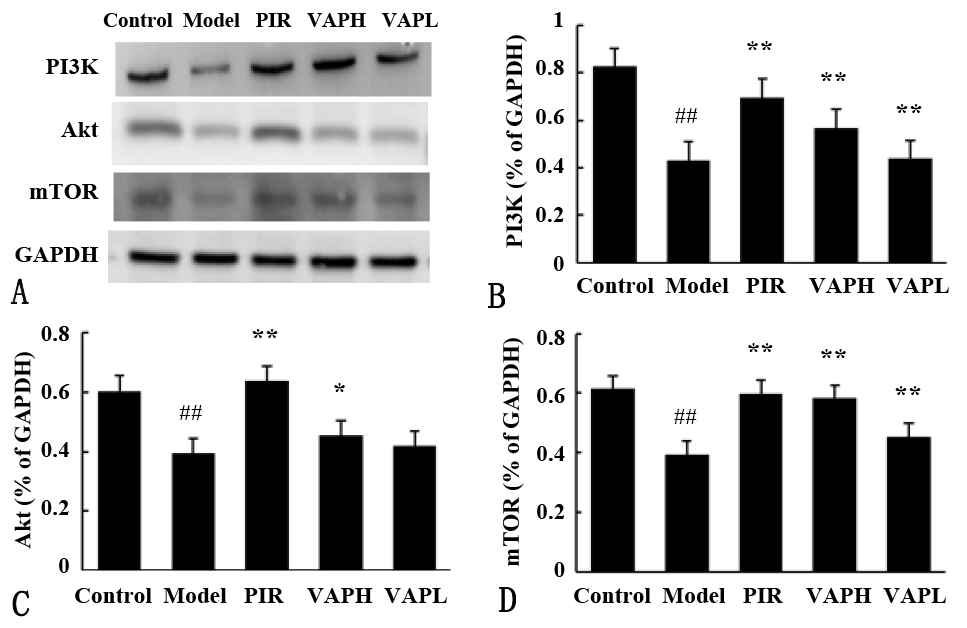
Fig. 4.
Expression levels of PI3K, Akt and mTOR proteins in the hippocampus tissue of rats in each group.
Notes: (A) Western blot analysis; (B–D) Quantification of PI3K, Akt and mTOR in five groups. Data are presented as mean ± SD (n = 10 per group). Compared with Control group, ## P <0.01; Compared with Model group, * P <0.05, ** P <0.01.

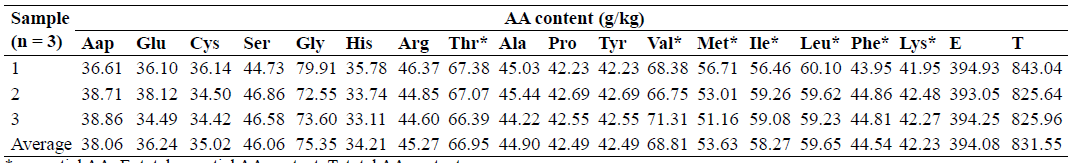
Table II.
Contents of amino acid components in VAP.
*, essential AA; E, total essential AA content; T, total AA content.

February 2024
Pakistan J. Zool., Vol. 56, Iss. 1, pp. 01-501


