

Maximum Sustainable Yield Estimates of Scomberomorus spp. from Balochistan, Pakistan


Maximum Sustainable Yield Estimates of Scomberomorus spp. from Balochistan, Pakistan
Muhammad Noman, Yong Tong Mu*, Muhammad Mohsin, Aamir Mahmood Memon and Muhammad Talib Kalhoro
College of Fisheries, Ocean University of China, Qingdao 266003, China
ABSTRACT
Pakistani fisheries resources are influenced by habitat destruction, pollution and over-exploitation. Therefore, it is necessary to evaluate fisheries resources prior to harvest. In this study, two specialized fishery software’s viz. CEDA (catch and effort data analysis) and ASPIC (a stock production model incorporating covariates) are used to analyze the fishery output (FO) and fishery input (FI) data of Scomberomorus spp. to evaluate their fishery stock status in Pakistani marine waters from Balochistan coastline.Three surplus production models (SPMs) viz. Fox (F-M), Schaefer (S-M) and Pella-Tomlinson (PT-M) along with three error assumptions (EAs), log (L-EA), log normal (LN-EA) and gamma (G-EA), were used in CEDA while two SPMs, Fox (F-M) and logistic (L-M) were used in ASPIC. In CEDA, for initial proportion (IP) 0.9, F-M for L-EA and LN-EA estimated maximum sustainable yield (MSY) as 2593 t and 2282 t. However, G-EA produced minimization failure (MF). Estimated MSY for L-EA and LN-EA through S-M and PT-M were remained same viz. 3523 t and 4584 t, respectively. However, here G-EA assumption also showed MF. In ASPIC, for same IP, F-M and L-M estimated MSY as 2313 t and 5191 t. Overall, F-M results, in ASPIC, reveal highest goodness of fit R2 (0.937) values. The FO statistics reveal that this stocks is over-fished. Thus, it requires some proficient management and immediate steps to conserve this fishery resource for future generations.
Article Information
Received 07 September 2019
Revised 22 December 2018
Accepted 27 March 2019
Available online 23 August 2019
Authors’ Contribution
MN initiated the project, procured and analyzed the data. YTM designed and supervised the study. MM compiled the results. AMM and MTK helped in writing of the article.
Key words
Seer fishes, Stock assessment, Surplus production models, Pakistan.
DOI: http://dx.doi.org/10.17582/journal.pjz/2019.51.6.2199.2207
* Corresponding author: ytmu@ouc.edu.cn
0030-9923/2019/0006-2199 $ 9.00/0
Copyright 2019 Zoological Society of Pakistan
Introduction
Family Scombridae includes mackerels, tunas, bonitos, and some of the world’s most prevalent food fishes. The fishes belonging to this family are also considered as the fastest-swimming fishes in the world (Orrell et al., 2006). Some, particularly the smaller mackerels, live in shallow water near the coast, while many others wander deeper waters, often in wide migratory patterns. Mackerels are predators and forage crabs, shrimps, squids, crustaceans, egg and larvae of fishes and invertebrates, and small fishes. They are, in turn, provide food for each other, large fishes, porpoises, seals and sea birds. They spawn in the spring and early summer along the coast in shallow water (Wheeler, 1985; Helfman et al., 1997; Johnson and Gill, 1998).
The term seer fish is used here for the following commercially important fish species belongs to subfamily of the Scombridae or Mackerel family: Scomberomorus guttatus, S. commerson, S lineotatus and S. koreanus. They are also popular game fish, growing up to 45 kg, and is a strong fighter that has on occasion been seen to leap out of the water when hooked. It is an excellent table fish. Scomberomorus spp. are primarily caught by troll lines, hook and lines, long lines, drift gillnets and purse seines (Sinha et al., 2015).
The SPMs are also known as biomass dynamic models. Currently, numerous studies on SPMs have been done for stock assessment of fishery resources. These SPMs compute all the effects of growth, mortality and recruitment into a single production function. Hence, they become more preferable models in stock assessment studies. SPMs also own basic importance in tropical fisheries where age determination is relatively difficult or impossible (Haddon, 2011) because the bends on otoliths for age determination are difficult to examine due to changing weather. However, SPMs need use FO and FI data or index of abundance (catch per unite effort-CPUE). Their predictable factors can simply be recorded on the basis of biological reference point or MSY in order to device harvest policies for sustainable fishing (Jensen, 2002).
SPMs based on the concept of fishery stock depletion which means the drop in abundance indicator due to withdrawal of fishery stock. Depletion models require continuous FI data without gaps because data gaps can be the cause of wrong assessment. These models may also require good index of relative population size in comparison of actual population size. In addition, catch per unit effort (CPUE) can also be a determining factor to evaluate different parameters in place of FI statistics. So, the fish stock can be accessed by FI statistics or CPUE (Hoggarth et al., 2006). A lot of published literature point out that SPMs are very imperative tools in fishery stock assessment and have been used worldwide in fishery management (Ricker, 1975; Pitcher and Hart, 1982; Hilborn and Walters, 1992; Prager, 1994, 2005; Quinn and Deriso, 1999; Maunder et al., 2006; Panhwar et al., 2012). Currently, various software have been developed which have the ability to estimate biomass dynamics of the exploited fishery stock e.g. ASPIC and CEDA. These computer packages are easily assessable and very useful time saving tools.
Maximum sustainable yield (MSY) and maximum economic yield (MSY) are the two reference points which are used to manage fishery resources around the world. Though, according to economists the concept of MSY sounds great (Gordon, 1954; Grafton et al., 2007) however the benefits of this reference point are not witnessed till now. It has been found that MSY reference point is the better reference point at which maximum economic utility of the fishery resources is generated (Christensen, 2010).
Scomberomorus spp., locally known as “surmai”, are landed throughout coast of Pakistan but their production is considerably high along Balochistan coastline. They are considered one of the valuable food fishes throughout the country. Moreover, they have great economic importance because of their good demand in other countries. Despite commercial important of sear fishes no published literature is available on the stock assessment of this fishery stock from Pakistani marine waters. This research article is the first reporting about the fishery stock of Scomberomorus spp. by using FO and FI statistics.
Materials and Methods
Data procurement
The fishery status of Scomberomorus spp. was evaluated by using available FO and FI data for this fishery resource from marine waters of Pakistan.
Data analysis
The SPMs was used in this study to statistically analyze the collected time series data of 18 years period (1997-2014) of Scomberomorus spp. The specialized tools i.e. CEDA and ASPIC of SPMs used for analyzing data were downloaded from MRAG website and NOAA Fisheries Toolbox, correspondingly. These stock assessment tools ponder fishery stock to be in non-equilibrium state and were employ all together here to eliminate uncertainties and develop more confidence in the results. The CPUE was used as nominal in this study by keeping in view the description of Hoggarth et al. (2006) on the subject of the use of CPUE in fish stock assessment.
SPMs are also known as biomass dynamic models based on various assumptions which have three different versions on the behalf of three different scientists Fox, Schaefer and Pella-Tomlinson. Schaefer is most frequently used model and rely on a logistic population growth model (Schaefer, 1954).

On the other hand, Fox and Pella-Tomlinson model are based on Gompers growth equation (Fox, 1970) and generalized production equation (Pella and Tomlinson, 1969), respectively.
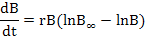
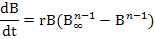
Where, B stands for fish stock biomass, n is shape parameter, t represents for the time (year), B∞ is carrying capacity (K) and r denotes the intrinsic rate of population growth.
CEDA (version 3.0.1)
CEDA (catch and effort data analysis) computer package is menu driven data fitting tool and has the aptitude to approximate customized parameters. CEDA uses a confidence interval of 95% through bootstrapping method for all the SPMs models i.e. F-M, S-M and PT-M with three viz. L-EA, LN-EA and G-EA. It needs an input of IP (B1/K) which is a key indicator used to access fishery stock. For example, if the input value of IP is zero or close to zero then its mean that data is obtained from virgin fishery stock. Similarly, if the input value is one then it does assume that data is acquired from fully developed fishery stock. Sometimes, initial biomass is fixed as B1 = C1/(qE1). In this mathematical statement, C is catch (FO); q and E denote effort (FI) and catchability coefficient correspondingly. Some programmers also use B1 equal to K (carrying capacity). CV (coefficient of variation) is predicted by using confidence intervals. Other key parameters expected by using CEDA are MEY, K, q, r (intrinsic growth rate), R yield (replacement yield) and final biomass.
ASPIC (Version 5.0)
ASPIC (a stock production model incorporating covariates) software also requires an input of IP. However, in contrast to CEDA, it needs individual input files for each IP value. Two SPMs i.e. F-M (a special case of GENFIT) and L-M (also called Schaefer model) were employed by using this fishery software. FIT and BOT files, for both of the SPMs, were prepared to calculate CV for all IP values. FIT and BOT represent the program modes used in ASPIC and exists a technical difference between them. The managerial parameters are computed by ASPIC software during FIT mode while during BOT program mode it uses bootstrapped CIs with many trials for the calculation of parameters. Therefore, the finishing time of BOT mode is much higher than FIT mode. 500 trails were done in order to compute MEY. Different Important parameters approximated by using this computer package include MEY, K, q, B1/K (starting biomass over carrying capacity), R2 (coefficient of determination), FMSY (fishing mortality rate at MSY), BMSY (stock biomass giving MSY).
Sensitivity analysis was performed for constant recruitment model. However, due to unpredictable results derived we switched to non-equilibrium SPMs evaluation i.e. three production models. Within these models again sensitivity analysis was performed by using IP values (Tables II and V). The results obtained for different parameters were further considered along with R2 values and visual inspection of the graphs for model selection and evaluation for representing reliable results.
Result
The total capture production of Scomberomorus spp. stated during the study period from Pakistani marine water was 90056 t. Figure 1 reveals that maximum and minimum quantity of FO examined was 9567 t (1998) and 2031 t (2013) while the average FO remained 5003 t year-1. The average CPUE during the study period remained 0.125 year-1.Highest and lowest values of CPUE were observed during the second and seventeenth study year i.e. 1998 (0.278) and 2013 (0.040) in that order (Fig. 2). The results obtained by computation through CEDA and ASPIC were further evaluated in term of four factors: MSY; R2; residual plots between observed and expected FOs; and CV. Estimated MSY values were compared with data figures and very large or small MSY values were neglected. Models were compared on the basis of R2 values and visual examination of residual plots. The higher is the value of R2 the better is the fitting of the model and vice versa. Results with suitable CV values were acknowledged.
CEDA Estimates
For CEDA, the results for various parameters for IP 0.9 are given in Table I. Computed values of MSY and their CV for F-M with N-EA and LN-EA were 2593 t, 0.161 and 2282 t and 0.263, respectively. However, G-EA showed MF for F-M. Computed MSY values for L-EA and LN-EA used in S-M and PT-M remained same while G-EA here also showed MF. For both viz. S-M and PT-M, computed MSY values for L-EA and LN-EA were 3523 t and 4584 t correspondingly. Similarly, estimated CV were 0.196, 0.018 and 0.174, 0.015 in that order. Estimated BMSY values are identical for the entire S-M and PT-M. This may be due to the convergence of PT-M at 0.5 of BMSY/K which suggests the results of this model may not be significant. However, for model evaluation full criteria used has already been discussed.
CEDA revealed sensitivity towards the input IP values as it produced different output MSY estimates for different IP inputs (Table III). Sometimes N-EA and G-EA showed MF in all the SPMs used. Moreover, for both S-M and PT-M, N-EA produced MF for IP values of 0.2 and 0.4. CV values were obtained by using a special method called bootstrapping confidence limit method. For all the SPMs used along with their EAs either MSY or R2 value did not produce rational results except for IP 0.9. For IP 0.9, values of R2 by using N-EA and LN-EA in F-M were 0.890 and 0.826, respectively. For both i.e. S-M and PT-M, R2 values were same as 0.887 and 0.835 correspondingly. R2 (the goodness of fit) values are very important to consider as they tell us about the fitting of the model. Figure 3 shows the graphical representation of observed and expected annual FO values. From visual inspection it can be expected that observed and expected FO values are considerably close to each other for all the EAs used in F-M, however in detail, they differ from each other. The results of CEDA illustrate higher MSY values with lower IP values and vice versa.
ASPIC estimates
ASPIC computer software did not produce results for IP 0.1 – 0.3 because the data set did not suite to all IP values. It computed various parameters for only IP values 0.4 – 0.9 which results are presented in Table IV. Like CEDA, ASPIC also showed sensitivity to IP values as it computed different output parameter values for different IP input. ASPIC estimated larger MSY for smaller IP value and vice versa. However, parameters computed by this software did not show higher variation as compared to CEDA. For instance, computed MSY by ASPIC ranged in 2300 t - 8000 t while for CEDA its estimated range was 2000 t - 70000 t.
Table I.- CEDA estimates of various parameters for Scomberomus spp. from Balochistan, Pakistan (IP = 0.9).
|
Model |
R2 |
MSY |
CV |
K |
q |
r |
R Yield |
B |
|
FM-LEA |
0.89 |
2593 |
0.161345 |
67308 |
0.00000506 |
0.014729 |
2034 |
10400 |
|
FM-LNEA |
0.826 |
2282 |
0.262927 |
73280 |
0.00000448 |
8.47E-02 |
1755 |
10860 |
|
FM-GEA |
MF |
MF |
MF |
MF |
MF |
MF |
MF |
MF |
|
SM-LEA |
0.887 |
3523 |
0.195653 |
53290 |
0.00000652 |
0.264445 |
1634 |
7132 |
|
SM-LNEA |
0.835 |
4584 |
0.018365 |
37400 |
0.0000105 |
0.490264 |
1883 |
4346 |
|
SM-GEA |
MF |
MF |
MF |
MF |
MF |
MF |
MF |
MF |
|
PTM-LEA |
0.887 |
3523 |
0.173785 |
53290 |
0.00000652 |
0.264445 |
1634 |
7132 |
|
PTM-LNEA |
0.835 |
4584 |
0.014692 |
37400 |
0.0000105 |
0.490264 |
1883 |
4346 |
|
PTM-GEA |
MF |
MF |
MF |
MF |
MF |
MF |
MF |
MF |
MSY, maximum sustainable yield; CV, coefficient of variation; R2, coefficient of determination; K, carrying capacity; q, catchability coefficient; r, intrinsic population growth rate; RYield, replacement yield; B, current biomass; MF, minimization failure
Table II.- CEDA estimates of various parameters for Scomberomus spp. from Balochistan, Pakistan (IP = 0.1-0.9).
|
IP |
Model |
||||||||
|
Fox |
Schaefer |
Pella Tomlinson |
|||||||
|
N-EA |
LN-EA |
G-EA |
N-EA |
LN-EA |
G-EA |
N-EA |
LN-EA |
G-EA |
|
|
0.1 |
MF |
9923 |
MF |
69864 |
4425 |
21512 |
69864 |
9819 |
21512 |
|
0 |
0.000668 |
0 |
0.042656 |
0.025597 |
0.0000712 |
0.0426 |
0.1783 |
9.49E-05 |
|
|
0.2 |
34775 |
6088 |
MF |
MF |
11603 |
MF |
MF |
6088 |
MF |
|
0.409498 |
0.017599 |
0 |
0 |
8.79E-05 |
0 |
0 |
0.0117 |
0 |
|
|
0.3 |
5779 |
4657 |
16809 |
35002 |
8392 |
32848 |
35002 |
8392 |
32848 |
|
0.057209 |
0.051163 |
0.0134 |
0.005291 |
0.000182 |
0.17334 |
0.0053 |
0.0001 |
0.169752 |
|
|
0.4 |
4637 |
3880 |
MF |
MF |
6838 |
MF |
MF |
6838 |
MF |
|
0.107278 |
0.092047 |
0 |
0 |
0.000224 |
0 |
0 |
0.0002 |
0 |
|
|
0.5 |
3925 |
2884 |
MF |
MF |
5950 |
5946 |
MF |
5950 |
5946 |
|
0.119199 |
0.218659 |
0 |
0 |
0.000257 |
0.000343 |
0 |
0.0002 |
0.000343 |
|
|
0.6 |
3437 |
2770 |
29467 |
5747 |
5371 |
MF |
5747 |
5371 |
MF |
|
0.139686 |
0.191004 |
0.0166 |
0.029119 |
0.002185 |
0 |
0.0284 |
0.0022 |
0 |
|
|
0.7 |
3080 |
2747 |
MF |
4781 |
5053 |
31555 |
4781 |
5053 |
31555 |
|
0.13865 |
0.20914 |
0 |
0.092949 |
0.006563 |
0.339446 |
0.0928 |
0.0067 |
0.171388 |
|
|
0.8 |
2078 |
2224 |
18511 |
4071 |
4663 |
MF |
4071 |
4663 |
MF |
|
0.396034 |
0.311766 |
0.0101 |
0.154904 |
0.010942 |
0 |
0.1527 |
0.0121 |
0 |
|
|
0.9 |
2593 |
2282 |
MF |
3523 |
4584 |
MF |
3523 |
4584 |
MF |
|
0.170002 |
0.281931 |
0 |
0.192901 |
0.017808 |
0 |
0.1989 |
0.0156 |
0 |
|
CV, coefficient of variation is written below MSY values; MF, represents minimization failure.
Table III.- ASPIC estimates of various parameters for Scomberomorus spp. from Balochistan, Pakistan (IP = 0.9).
|
Model |
IP |
MSY |
CV |
R2 |
BMSY |
FMSY |
K |
q |
|
F-M |
0.9 |
2313 |
0.23469829 |
0.937 |
26430 |
0.08749 |
71850 |
0.000004546 |
|
L-M |
0.9 |
5191 |
0.07134072 |
0.911 |
14020 |
0.3703 |
28030 |
0.00001462 |
Table IV.- ASPIC estimates for Scomberomorus spp. from Balochistan, Pakistan (IP = 0.3-0.9).
|
Model |
IP |
MSY |
CV |
R2 |
K |
BMSY |
FMSY |
q |
|
F-M |
0.4 |
4947 |
0.08674366 |
0.937 |
4947 |
27100 |
0.1826 |
0.00001081 |
|
0.5 |
3901 |
0.13282027 |
0.938 |
79320 |
29180 |
0.1337 |
0.000007699 |
|
|
0.6 |
3276 |
0.17258383 |
0.937 |
79110 |
29100 |
0.1126 |
0.000006315 |
|
|
0.7 |
2866 |
0.19363051 |
0.937 |
76760 |
28240 |
0.1015 |
0.000005531 |
|
|
0.8 |
2557 |
0.2355095 |
0.937 |
74250 |
27310 |
0.0936 |
0.000004974 |
|
|
0.9 |
2313 |
0.23469829 |
0.937 |
71850 |
26430 |
0.0875 |
0.000004546 |
|
|
L-M |
0.4 |
7913 |
0.02485825 |
0.915 |
37770 |
18890 |
0.419 |
0.00001854 |
|
0.5 |
7054 |
0.01892777 |
0.926 |
31230 |
15620 |
0.4517 |
0.0000193 |
|
|
0.6 |
6672 |
0.12986863 |
0.926 |
25590 |
12790 |
0.5215 |
0.00002137 |
|
|
0.7 |
6247 |
0.0255947 |
0.919 |
24240 |
12120 |
0.5155 |
0.00002063 |
|
|
0.8 |
5752 |
0.03572575 |
0.912 |
25270 |
12630 |
0.4553 |
0.00001805 |
|
|
|
0.9 |
5191 |
0.07134072 |
0.911 |
28030 |
14020 |
0.3703 |
0.00001462 |
Table V.- ASPIC software estimates of fishing mortality (F) and biomass (B) (IP = 0.9) (1997-2014).
|
Year |
Model |
|||||||
|
F-M |
L-M |
|||||||
|
F |
B |
F/FMSY |
B/BMSY |
F |
B |
F/FMSY |
B/BMSY |
|
|
1997 |
0.149 |
64660 |
1.698 |
2.446 |
0.407 |
25240 |
1.099 |
1.8 |
|
1998 |
0.183 |
56580 |
2.089 |
2.141 |
0.561 |
19670 |
1.515 |
1.403 |
|
1999 |
0.179 |
48450 |
2.051 |
1.833 |
0.606 |
15000 |
1.635 |
1.070 |
|
2000 |
0.156 |
42160 |
1.785 |
1.595 |
0.548 |
12050 |
1.481 |
0.860 |
|
2001 |
0.154 |
37960 |
1.757 |
1.436 |
0.534 |
10810 |
1.441 |
0.771 |
|
2002 |
0.169 |
34560 |
1.931 |
1.308 |
0.576 |
10090 |
1.556 |
0.720 |
|
2003 |
0.194 |
31260 |
2.212 |
1.183 |
0.67 |
9223 |
1.809 |
0.658 |
|
2004 |
0.181 |
27840 |
2.072 |
1.053 |
0.641 |
7901 |
1.73 |
0.564 |
|
2005 |
0.155 |
25340 |
1.767 |
0.959 |
0.524 |
7159 |
1.415 |
0.510 |
|
2006 |
0.170 |
23850 |
1.938 |
0.902 |
0.527 |
7339 |
1.423 |
0.524 |
|
2007 |
0.199 |
22230 |
2.279 |
0.841 |
0.575 |
7471 |
1.553 |
0.533 |
|
2008 |
0.279 |
20270 |
3.187 |
0.767 |
0.811 |
7257 |
2.19 |
0.518 |
|
2009 |
0.230 |
17260 |
2.624 |
0.653 |
0.693 |
5707 |
1.872 |
0.407 |
|
2010 |
0.248 |
15610 |
2.832 |
0.591 |
0.761 |
5183 |
2.055 |
0.367 |
|
2011 |
0.268 |
14000 |
3.069 |
0.530 |
0.903 |
4472 |
2.439 |
0.319 |
|
2012 |
0.166 |
12410 |
1.894 |
0.470 |
0.576 |
3426 |
1.554 |
0.244 |
|
2013 |
0.166 |
12270 |
1.903 |
0.464 |
0.52 |
3678 |
1.404 |
0.262 |
|
2014 |
0.292 |
12130 |
3.34 |
0.460 |
0.921 |
4136 |
2.486 |
0.295 |
F, fishing mortality; B, biomass; F/FMSY, ratio of fishing mortality to fishing mortality rate at MSY; B/BMSY, ratio of biomass to biomass giving MSY.
It means although ASPIC is sensitive to IP values but its sensitivity is less than CEDA. ASPIC models in contrast to CEDA revealed higher R2 values demonstrating better fitting of the data. The results of different calculated parameters for IP 0.9 are listed in Table III. MSY along with their CV values for the SPMs, F-M and L-M used in ASPIC, were estimated at 2313 t (0.235) and 5191 t (0.071), respectively. F-M presented better fit as its R2 value (0.039) was higher than the computed R2 value (0.911) for L-M. For F-M and L-M, computed BMSY, FMSY and K remained 26430 t, 0.087 t, 71850 t and 14020, 0.037 t, 28030 t for in that order.
Estimated fishing mortality (F) and biomass (B) values of Scomberomorus spp. by using ASPIC are listed in Table V. Computed estimateshighlight that F has shown rising trend with the passage of time whereas B is declining. F/FMSY is increased and B/BMSY is decreased during the course of study period. Both, F/FMSY and B/BMSY is a sign of overexploitation of the fishery stock.
Discussion
The findings of current study show that Scomberomorus spp. are overexploited in Pakistani marine waters. This overexploitation of fishery resources may lead to various draw backs to the society. For instance, competitive harvesting of the fishery resources is the result of this overharvesting. Likewise, private stakeholders, without considering the damage caused by overfishing, also attempt to maximize their profits. Furthermore, fishery stock may led to the depletion state because of substantial increase in FO in order to get maximum profit. Thus, it becomes very necessary to access the commercial fishery stock on regular basis to make sure sustainable economic contribution of fishery resources (Clark, 1973).
As described earlier, overexploitation may lead to fishery stock depletion. This depletion is actually the result of an attempt to uplift profit gain beyond the capacity of the fishery stock (Clark, 1973). In the beginning of fishery, fishermen get more profit with lower FI. At this stage, the spurs generated by fishery, fascinates more and more fishermen to join fishery however a stage approaches when profit goes negative. At this stage, for more FI lesser FO is obtained and BCUR becomes lower than BMSY. Consequently, fishing does not remain economic. Hence, fishery stock building is usually recommended in order to make fishing beneficial again.
The ideas of fishery stock rebuilding sounds great but practically it confers many problems. These problems are associated with the willingness of fishers to comply with the idea of fishery stock rebuilding. These reasons for this opposition are the difference in the growth rate of the fishes. Obviously, fast growing fishes will rebuild quickly where for slow growing fish species it will take so long time, even decades (Grafton et al., 2007). Another drawback of fishery stock rebuilding for fishers is that during the time of fishers have to pay for the transition cost. Thus, in order to agree fishers for rebuilding these transition costs may be supplemented by attractive incentives such as permission of harvesting rights (Hilborn, 2007). These incentives may prove very effective tool to motivate fishers for rebuilding (Grafton, 1995).
Fishery management is principally an integrated process which employs data collection, analysis, explanation of results, consultation, planning and decision making (FAO, 1997) involving stakeholders (Die, 2002). In this study, famous fishery SPMs are used which have already been used for the assessment of stock status of fishery resources in Pakistan (Memon et al., 2015; Siyal et al., 2013; Kalhoro et al., 2013; Panhwar et al., 2012; Kalhoro et al., 2014; Panhwar and Liu, 2013; Kalhoro et al., 2018). Actually, these SPMs possess many advantages over the other routine used in the science of fishery management. Because, the various assumptions of classic SPMs i.e. Fox and Schaefer assume that fishery stock is in equilibrium state which is rarely true in nature (Liu and Su, 1998). However, the recent use of CEDA is valuable and provides more suitable and trustworthy estimations as this suppose fishery stock in non-equilibrium state which exists in nature. Hence, in contrast to classical computation of MSY, these non-equilibrium SPMs have implausible elasticity and are reliable tools for fishery management advice (Hoggarth et al., 2006; Medley and Ninnes, 1997).
These models use simple data related to FI and FO. In addition to this, these models estimated simultaneously exclusive parameters of the fishery stock. Besides, computed parameter such as q indicates the fishery stock status. Other main computed fishery parameters include F, FMSY, B and BMSY. It is necessary to mention that these SPMs rely on some assumption which may not be met in nature. These assumptions include non-existence of immigration or emigration in the fishery stock, age composition of the fishery stock has no relation with r, q does not change with the passage of time, there exists single fishery stock and natural with fishing mortality occur at the same time (Ewald and Wang, 2010; Hoggarth et al., 2006). Moreover, these models does not use data related to age structure of the population and confer the risk of uncertainty in their estimation. Nevertheless, these models are frequently used in the science of fishery management and are very effective tools which tell us about the status of the fishery stock upon which fishery management advice is made (Musick and Bonfil, 2005).
As this study finds that Scomberomorus spp. are overexploited in Pakistani marine waters. Usually, overcapacity is blamed for overexploitation of marine fishery resources. Unfortunately, in Pakistan there exists no proper legislation and its implementation related to the fishery resource utilization. In 2007, first ever national policy related to fisheries was formulated (GoP, 2007). This policy, with many other aims, intended to control FO and FI in order to manage fisheries. However, practically predicted results of this policy regarding FO and FI are not witnessed. A study finds that in Sindh, the number of trawlers used for fishing is more than double as compared to recommended ones (Schmidt, 2014) which indicates that there is found no real existence of fishery management policies.
Conclusion
Computed MSY values for IP 0.9, ranged as 2000 t – 70000 t and 2300 t – 8000 for CEDA and ASPIC, respectively. Thus, it means although ASPIC is sensitive to IP values but its sensitivity is less than CEDA and CEDA in terms of computed MSY seems to be more conventional. Higher values of R2 for ASPIC point to that its results are more reliable. Since the computed MSY range by F-M and L-M overlaps thus by considering the results of both the software and applying pulse fishing rule we recommend that the MSY, TRP range of Scomberomorus spp. is as 2300 t – 5100 t in Pakistani marine waters. Capture production of 5500 t or more must be considered as a LRP. By comparing computed MSY values with recorded data (Fig. 1) and considering F/FMSY and B/BMSY, it can be concluded that Scomberomorus spp. stock has constantly been overexploited earlier. Scomberomorus spp. stock is declining with the passage of time due to overfishing. Consequently, instant steps with proper forecast with legal execution are surely needed to conserve this fishery resource for future.
Acknowledgement
The first author is grateful to Chinese Scholarship Council (CSC) for funding his PhD. Degree. This work is supported by the special research fund of China Agriculture Research System (CARS-49).
Statement of conflict of interest
We declare that we have no conflict of interest.
References
Clark, C.W., 1973. The economics of overexploitation. Science, 181: 630-634. https://doi.org/10.1126/science.181.4100.630
Christensen, V., 2010. MEY= MSY. Fish Fish., 11: 105-110.
Die, D., 2002. Design and implementation of management plans, Chapter 9, pp. 205-220. In: Management measures and their application: A fishery manager’s guidebook (ed. K.L. Cochrane). FAO Fisheries Technical Paper, 424, FAO, Rome, Italy, pp. 231.
Ewald, C.O. and Wang, W.K., 2010. Sustainable yields in fisheries: Uncertainty, risk-aversion, and mean-variance analysis. Nat. Res. Model., 23: 303-323. https://doi.org/10.1111/j.1939-7445.2010.00065.x
FAO, 1997. Fisheries management. FAO Technical Guidelines for Responsible Fisheries No. 4, FAO, Rome, Italy, pp. 1-82.
Fox, Jr. W.W., 1970. An exponential surplus-yield model for optimizing exploited fish populations. Trans. Am. Soc., 99: 80–88. https://doi.org/10.1577/1548-8659(1970)99<80:AESMFO>2.0.CO;2
GoP, 2007. National policy and strategy for fisheries and aquaculture development in Pakistan. Ministry of Food, Agriculture and Livestock, Islamabad, Government of Pakistan, pp. 1-13. Retrieved from: http://faolex.fao.org/docs/pdf/pak150786.pdf
Gordon, H.S., 1954. Classic Papers in Natural Resource Economics. Palgrave Macmillan, London, pp. 178-203.
Grafton, R.Q., Kompas, T. and Hilborn, R.W., 2007. Economics of overexploitation revisited. Science, 318: 1601-1601.
Grafton, R.Q., 1995. Rent capture in a rights-based fishery. J. environ. Econ. Manage., 28: 48-67. https://doi.org/10.1006/jeem.1995.1004
Haddon, M., 2011. Modelling and quantitative methods in fisheries, 2nd ed. Chapman & Hall/CRC, New York, London, pp. 285-300.
Helfman, G., Collete, B. and Facey, D., 1997. The diversity of fishes. Blackwell, Malden, MA.
Hilborn, R. and Walters, C.J., 1992. Quantitative fisheries stock assessment and management. Chapman-Hall, New York. https://doi.org/10.1007/978-1-4615-3598-0
Hilborn, R., 2007. Defining success in fisheries and conflicts in objectives. Mar. Pol., 31: 153-158. https://doi.org/10.1016/j.marpol.2006.05.014
Hoggarth, D.D., Abeyasekera, S., Arthur, R.I., Beddington, J.R., Burn, R.W., Halls, A.S., Kirkwood, G.P., McAllister, M., Medley, P., Mees, C.C., Parkes, G.B., Pilling, G.M., Wakeford, R.C. and Welcomme, R.L., 2006. Stock assessment for fishery management-A framework guide to the stock assessment tools of the fisheries management science programme. FAO Fisheries Technical Paper 487, FAO, Rome, Italy, pp. 261.
Jensen, A.L., 2002. Maximum harvest of a fish population that has the smallest impact on population biomass. Fish. Res., 57: 89-91. https://doi.org/10.1016/S0165-7836(01)00337-X
Johnson, G. and Gill, A., 1998. Perches and their allies. In: Encyclopedia of fishes-Second edition (eds. W. Eschmeyer and J. Paxton). Academic Press, San Diego, CA, pp. 190.
Kalhoro, M.A, Liu, Q., Memon, K.H., Chang, M.S. and Jatt, A.N., 2013. Estimation of maximum sustainable yield of Bombay duck, Harpodon nehereus fishery in Pakistan using the CEDA and ASPIC packages. Pakistan J. Zool., 45: 1 757-1 764.
Kalhoro, M.A., Liu, Q., Waryani, B., Panhwar, S. K. and Hussain, K., 2014. Growth and mortality of Brushtooth lizardfish, Saurida undosquamis, from Pakistani Waters. Pakistan J. Zool., 46: 139-151.
Kalhoro, M.A., Tang, D., Ye, H.J., Evgeny, M., Wang, S. and Buzdar, M.A., 2018. Fishery appraisal of Portunus spp. (Family Portunidae) using different surplus production models from Pakistani Waters, Northern Arabian Sea. Pakistan J. Zool., 50: 135-141.
Maunder, M.N., John, R.S., Fonteneau, A., Hampton, J., Kleiber, P. and Harley, S.J., 2006. Interpreting catch per unit effort data to assess the status of individual stocks and communities. ICES J. Mar. Sci., 63: 1373-1385. https://doi.org/10.1016/j.icesjms.2006.05.008
Medley, P.A.H. and Ninnes, C.H., 1997. A recruitment index and population model for spiny lobster (Panulirus argus) using catch and effort data. Canadian J. Fish. aquat. Sci., 54: 1414–1421. https://doi.org/10.1139/cjfas-54-6-1414
Memon, A.M, Liu, Q., Memon, K.H., Baloch, W.A., Memon, A. and Baset, A., 2015. Evaluation of the fishery status for king soldier bream Argyrops spinifer in Pakistan using the software CEDA and ASPIC. Chinese J. Oceanol. Limnol., 33: 966-973. https://doi.org/10.1007/s00343-015-4330-4
Musick, J.A. and Bonfil, R., 2005. Management techniques for elasmobranch fisheries. FAO Fisheries Technical Paper 474, FAO, Rome, Italy, pp. 251.
Orrell, T.M., Collette, B.B. and Johnson, G.D., 2006. Molecular data support separate scombroid and xiphioid clades. Bull. Mar. Sci., 79: 505-519.
Panhwar, S.K. and Liu, Q., 2013. Population statistics of the migratory hilsa shad, Tenualosa ilisha, in Sindh, Pakistan. J. appl. Ichthyol., 29: 1091-1096. https://doi.org/10.1111/jai.12134
Panhwar, S.K., Liu, Q. Khan, F. and Siddiqui, P.J.A., 2012. Maximum sustainable yield estimates of Ladypees, Sillago sihama (Forsskål), fishery in Pakistan using the ASPIC and CEDA packages. J. Ocean Univ. China, 11: 93-98. https://doi.org/10.1007/s11802-012-1880-3
Pella, J.J. and Tomlinson, P.K., 1969. A generalized stock production model. Inter-Am. Tropic. Tuna Comm., 13: 416–497.
Pitcher, T.J. and Hart, P.J.B., 1982. Fisheries ecology. The AVI Publishing Company, Inc. Westport, Connecticut.
Prager, M.H., 1994. A suite of extensions to a non-equilibrium surplus-production model. Fish. Bull., 92: 374-389.
Quinn II, T.J. and Deriso, R.B., 1999. Quantitative fish dynamics. Oxford University Press, New York, U.S.A.
Ricker, W.E., 1975. Computation and interpretation of biological statistics of fish populations. Bull. Fish. Res. Bd. Canada, 191: 1-382.
Schaefer, M.B., 1954. Some aspects of the dynamics of populations important to the management of the commercial marine fisheries. Inter-Am. Tropic. Tuna Comm., 1: 23-56.
Sinha, M.K., Premchand and Tiburtius, A., 2015. Status of seer fish fishery including some biological characteristic of Scomberomerus commerson in Indian. Indian Ocean Tuna Commission Publication No: WPNT05-14 Rev_1.
Siyal, F.K., Li, Y., Gao, T.X. and Liu, Q., 2013. Maximum sustainable yield estimates of silver pomfret, Pampus argenteus (Family: Strometidae) fishery in Pakistan. Pakistan J. Zool., 45: 447-452.
Wheeler, A., 1985. The world encyclopedia of fishes. Macdonald, London.
To share on other social networks, click on any share button. What are these?


