Management of Callosobruchus chinensis L. (Coleoptera: Bruchidae) in Stored Chickpea Grains by using Entomopathogenic Fungi
Management of Callosobruchus chinensis L. (Coleoptera: Bruchidae) in Stored Chickpea Grains by using Entomopathogenic Fungi
Mohsin Iqbal1, Farid Asif Shaheen1*, Farah Naz2, Muhammad Usman Raja2, Muhammad Fiaz3 and Muhammad Nadeem1
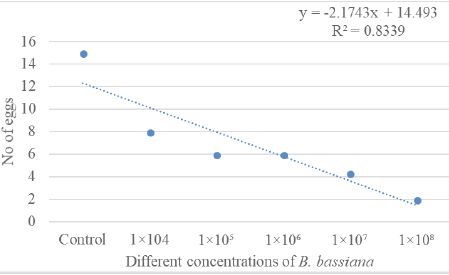
Modeling trend for mean number of eggs laid by pulse beetle in response to different concentrations of B. bassiana.
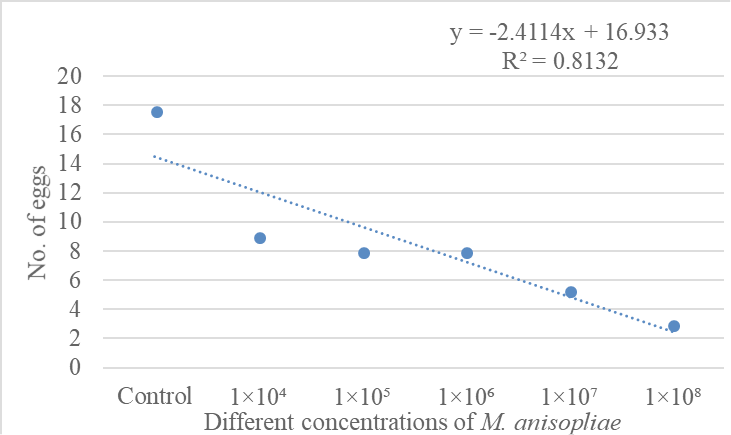
Modeling trend for mean number of eggs laid by pulse beetle in response to different concentrations of M. anisopliae.
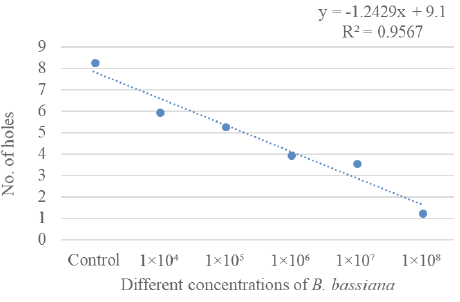
Modeling trend for mean number of holes made by C. chinensis in response to different concentrations of B. bassiana.
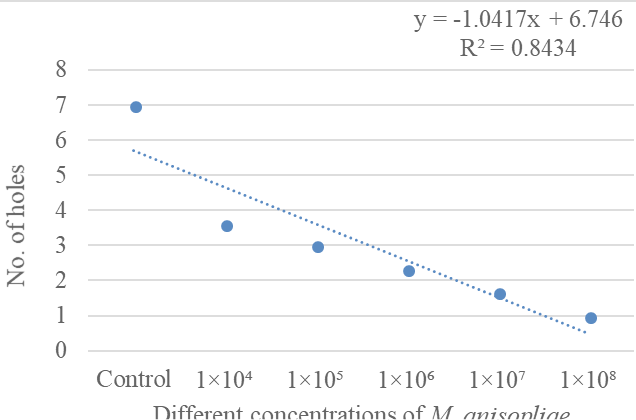
Modeling trend for mean number of holes made by C. chinensis in response to different concentrations of M. anisopliae.
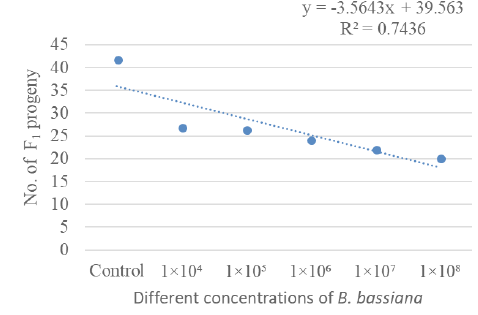
Modeling trend for emergence of F1 adults of pulse beetle in response to different concentrations of B. bassiana.
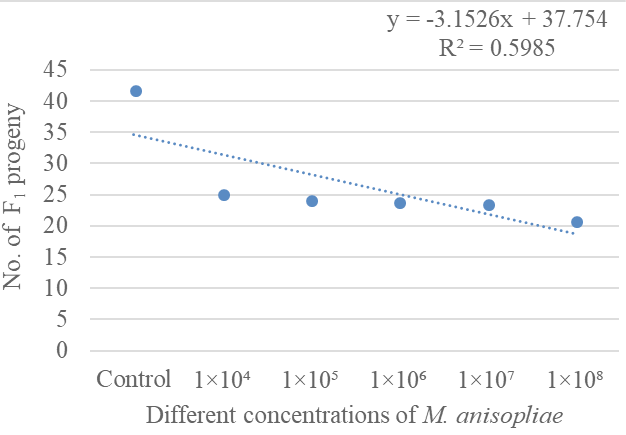
Modeling trend for emergence of F1 adults of pulse beetle in response to different concentrations of M. anisopliae.
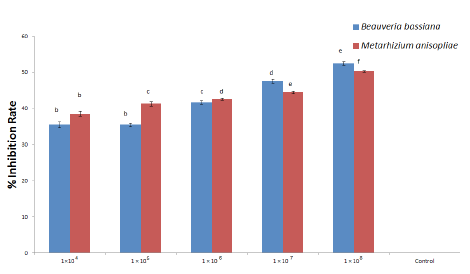
Percent inhibition rate (Mean ± SE) of pulse beetle in stored chickpea treated with different concentrations of B. bassiana and M. anisopliae.
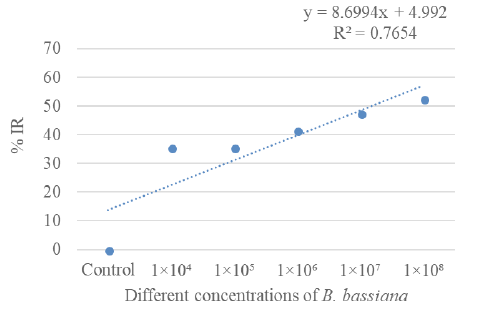
Modeling trend of percent inhibition rate (Mean ± SE) of pulse beetle in stored chickpea treated with different concentrations of B. bassiana.
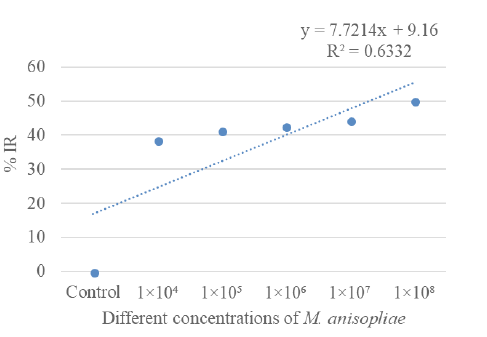
Modeling trend of percent inhibition rate (Mean ± SE) of pulse beetle in stored chickpea treated with different concentrations of M. anisopliae.
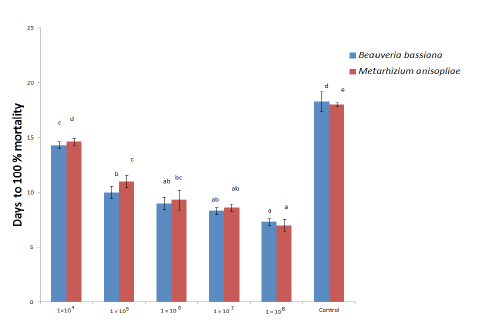
Modeling trend of days to 100% mortality of F1 adults (Mean ± SE) of pulse beetle in stored chickpeas treated with different concentrations of B. bassiana and M. anisopliae.
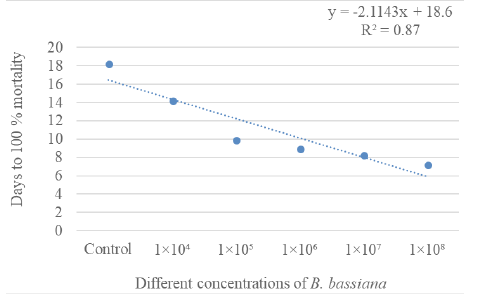
Modeling trend of days to 100% mortality of F1 adults (Mean ± SE) of pulse beetle in stored chickpeas treated with different concentrations of B. bassiana.
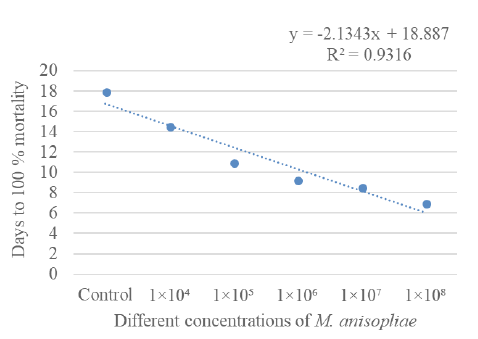
Modeling trend of days to 100% mortality of F1 adults (Mean ± SE) of pulse beetle in stored chickpeas treated with different concentrations of M. anisopliae.
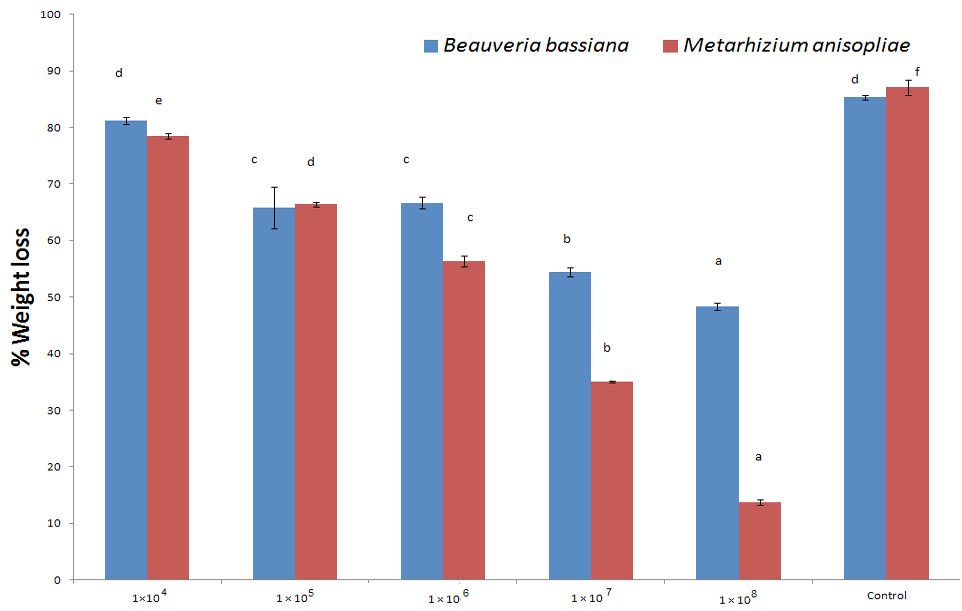
Percent weight loss (Mean ± SE) caused by pulse beetle in stored chickpeas treated with different concentrations of B. bassiana and M. anisopliae.
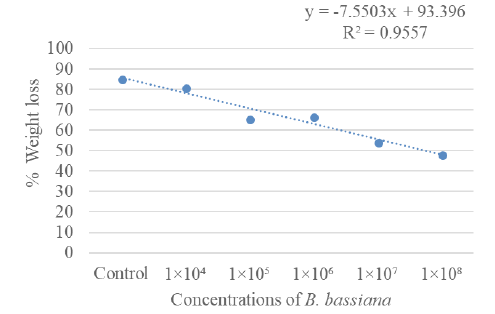
Modeling trend of percent weight loss (Mean ± SE) caused by pulse beetle in stored chickpeas treated with different concentrations of B. bassiana.
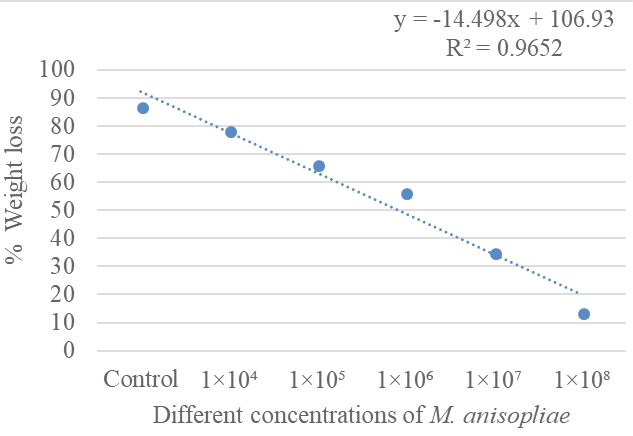
Modeling trend of percent weight loss (Mean ± SE) caused by pulse beetle in stored chickpeas treated with different concentrations of M. anisopliae.
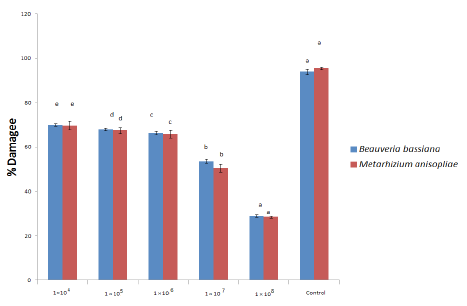
Percent damage (Mean ± SE) caused by pulse beetle in stored chickpeas treated with different concentrations of B. bassiana and M. anisopliae.
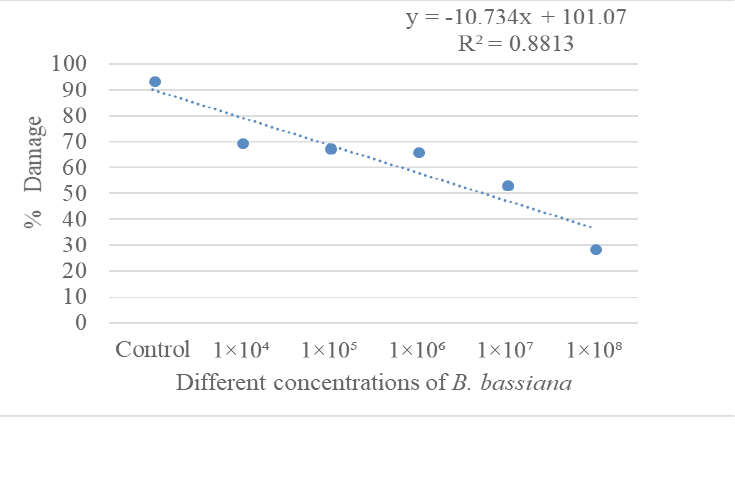
Modeling trend of percent damage (Mean ± SE) caused by pulse beetle in stored chickpeas treated with different concentrations of B. bassiana.
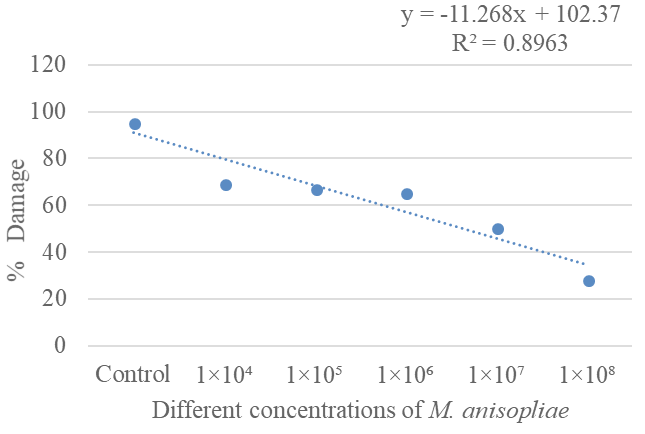
Modeling trend of percent damage (Mean ± SE) caused by pulse beetle in stored chickpeas treated with different concentrations of M. anisopliae.


