Management Practices and Economic Analysis of Camel in District Khairpur Mir’s, Sindh
Management Practices and Economic Analysis of Camel in District Khairpur Mir’s, Sindh
Turab Ali Kaurajo1*, Huma Rizwana1, Gulbahar Khaskheli2, Muhammad Haroon Baloch1, Muhammad Naeem Rajput1, Asad Ali Khaskheli3 and Mohsin Solangi1
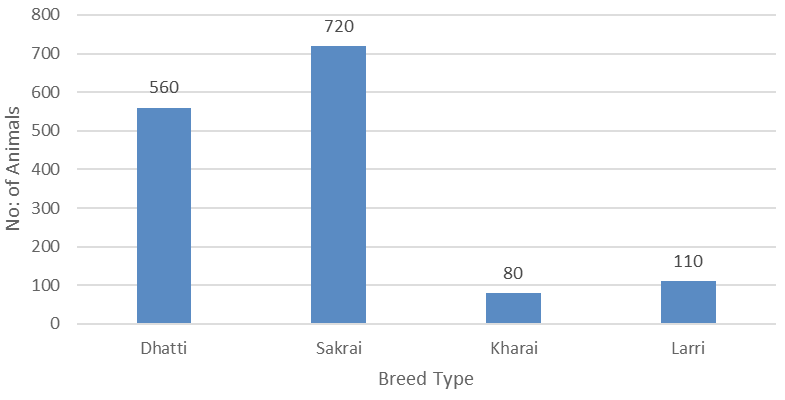
Camel breeds in district Khairpur Mir’s.
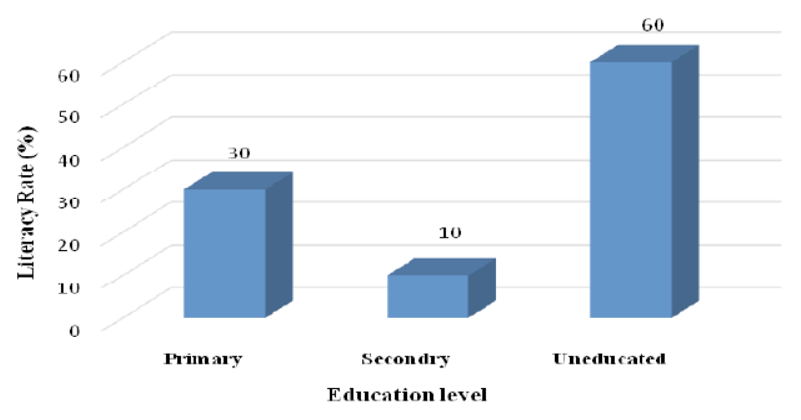
Educational level of the camel herders in District Khairpur Mir’s.
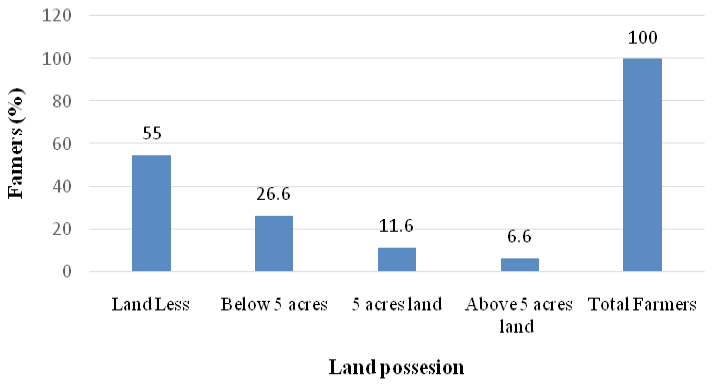
Land holding of the camel herders in District Khairpur.
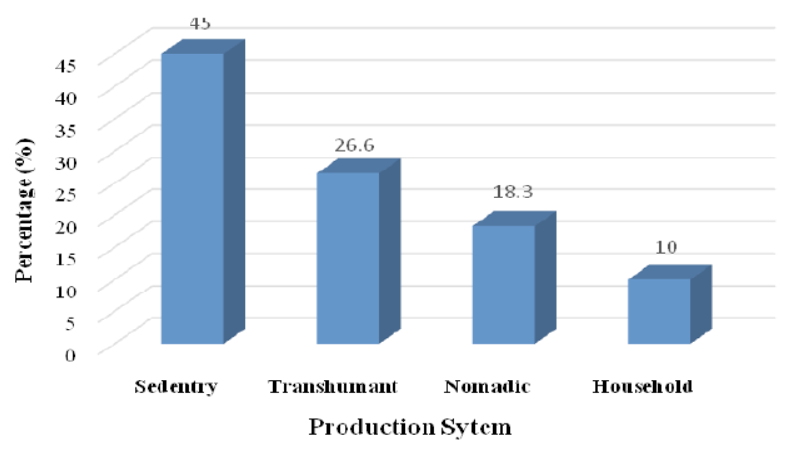
Production System of Camel Herding in District Khairpur.
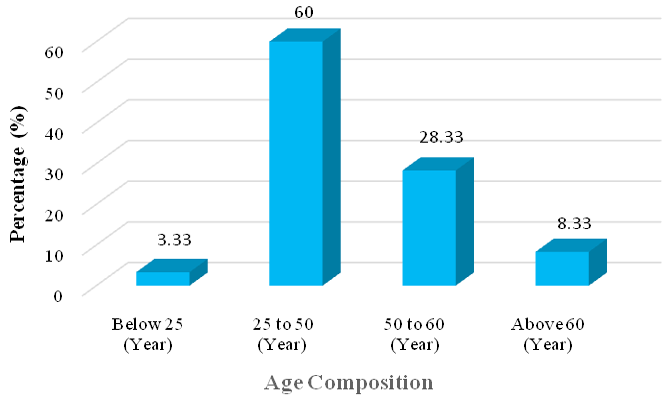
Age Composition of Camel herders in district Khairpur Mir’s.
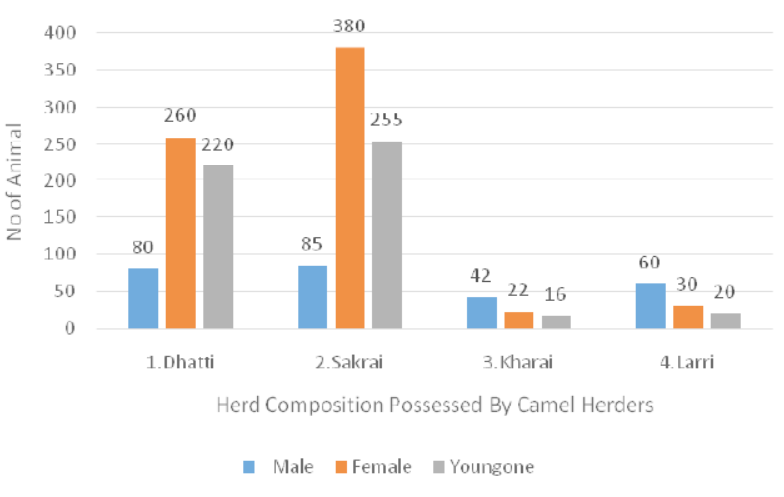
Herd Composition of Camel possessed by camel herders in district Khairpur Mir’s.
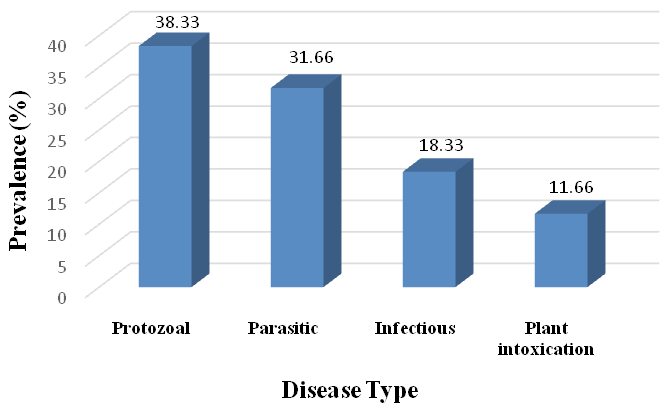
Camel diseases in district Khairpur Mir’s.
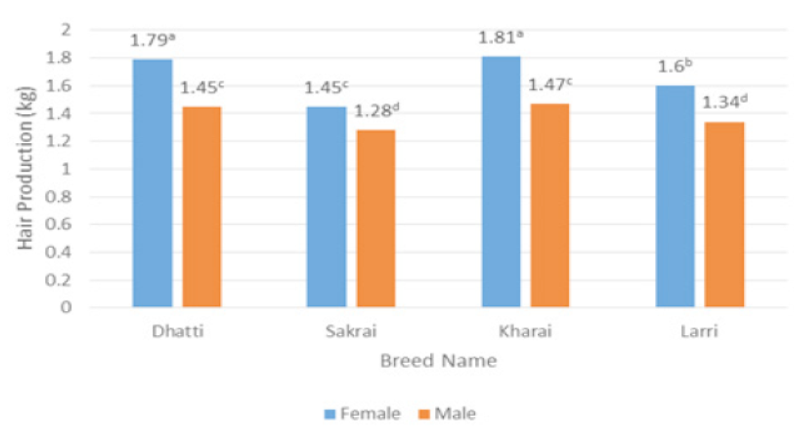
Interactive hair production of different camel breeds; SE+0.0359; LSD (0.05) 0.0712
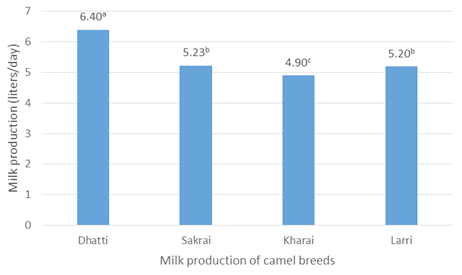
Productive performance of different camel milk/day in district Khairpur Mir’s; SE+0.1510; LSD (0.05) 0.2992
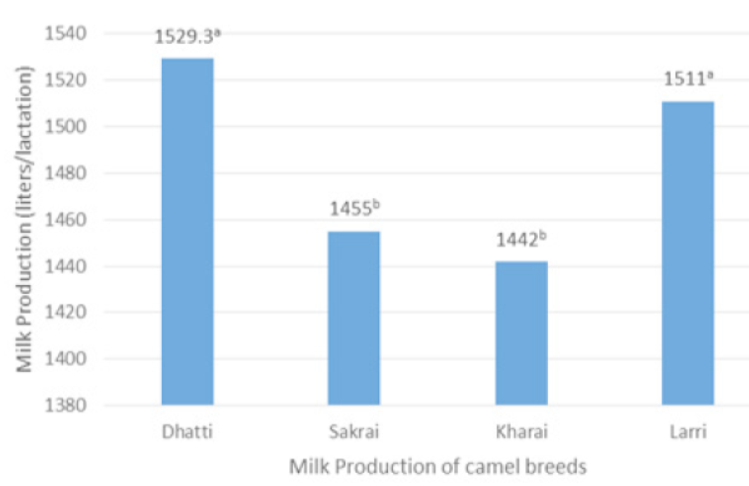
Productive performance of different camel milk /lactation in district Khairpur Mir’s; SE + 25.822; LSD (0.05) 51.164
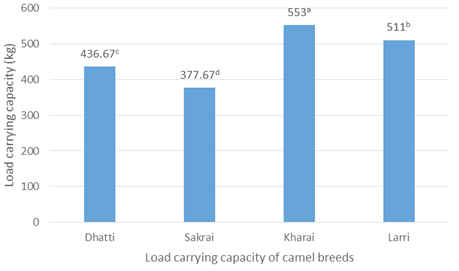
Load carrying capacity of different camel breeds in district Khairpur Mir’s; SE+10.974; LSD (0.05) 21.744
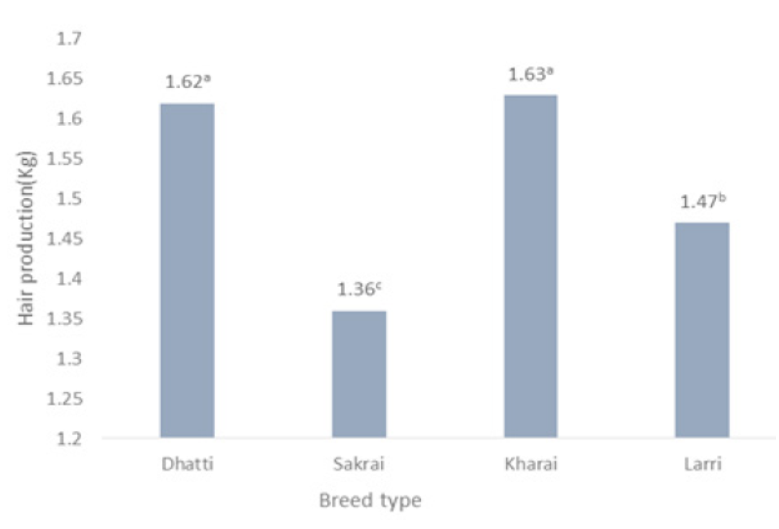
The Hair production (kg) of different camel breeds in district Khairpur Mir’s; SE+0.0359; LSD (0.05) 0.0712.


